Abstract
Objective:
To examine temperature in relation to stroke mortality in a multicity time series study in China.
Methods:
We obtained data on daily temperature and mortality from 8 large cities in China. We used quasi-Poisson generalized additive models and distributed lag nonlinear models to estimate the accumulative effects of temperature on stroke mortality across multiple days, adjusting for long-term and seasonal trends, day of the week, air pollution, and relative humidity. We applied the Bayesian hierarchical model to pool city-specific effect estimates.
Results:
Both cold and hot temperatures were associated with increased risk of stroke mortality. The potential effect of cold temperature might last more than 2 weeks. The pooled relative risks of extreme cold (first percentile of temperature) and cold (10th percentile of temperature) temperatures over lags 0–14 days were 1.39 (95% posterior intervals [PI] 1.18–1.64) and 1.11 (95% PI 1.06–1.17), compared with the 25th percentile of temperature. In contrast, the effect of hot temperature was more immediate. The relative risks of stroke mortality over lags 0–3 days were 1.06 (95% PI 1.02–1.10) for extreme hot temperature (99th percentile of temperature) and 1.14 (95% PI 1.05–1.24) for hot temperature (90th percentile of temperature), compared with the 75th percentile of temperature.
Conclusions:
This study showed that both cold and hot temperatures were associated with increased risk of stroke mortality in China. Our findings may have important implications for stroke prevention in China.
Stroke is one of the leading causes of death and disability worldwide.1 In contrast to developed countries, where stroke incidence declined by 42% over the last 4 decades, stroke incidence in developing countries doubled, surpassing that from developed countries.2 China is the largest developing country in the world and stroke burden is disproportionately high. In China, stroke mortality accounts for 19% of the total mortality, more than twice the mortality from ischemic heart disease (8%).3 Moreover, stroke patients in China have higher fatality than patients from developed countries.4 Stroke has substantial medical, public health, and economic impacts in China.
To reduce the burden of stroke, it is crucial to identify modifiable risk factors. It is well-known that some traditional cerebrovascular risk factors, including hypertension, high cholesterol levels, obesity, smoking, and alcohol consumption, increased the risk for stroke.5 However, the potential relationships of environmental risk factors and stroke have not been adequately studied in China.
One such environmental risk factor may be ambient temperature. Seasonal variations of stroke incidence and mortality have been widely reported worldwide, although the peak season was often different across countries, such as spring in Japan,6 summer in Turkey,7 and winter in Hong Kong.8 However, the existing epidemiologic findings on ambient temperature and stroke are inconsistent.9 We therefore examined the effects of temperature on daily stroke mortality in 8 Chinese cities using a standardized analytic protocol.
METHODS
Data collection.
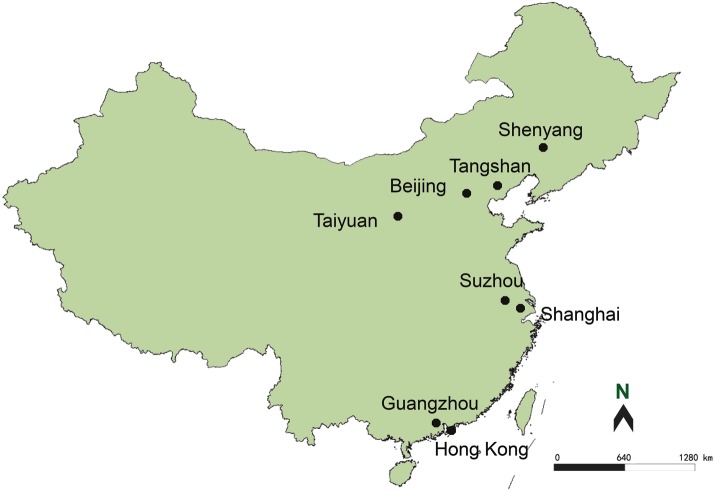
This study included 8 large cities from northern to southern China: Shenyang, Beijing, Tangshan, Taiyuan, Suzhou, Shanghai, Guangzhou, and Hong Kong (figure 1). Of these cities, Shenyang, Beijing, Tangshan, and Taiyuan belong to the warm-temperate zone; and Suzhou, Shanghai, Guangzhou, and Hong Kong belong to the subtropical zone. The study period varied between 1996 and 2008 from city to city, depending on data availability. Our analysis was restricted to the urban areas because the Death Registry has not been well-established in suburban and rural areas in China.
Figure 1. Map of cities in this study.
We obtained daily counts of stroke deaths from the Municipal Center for Disease Control and Prevention in each city. Stroke was defined according to the ICD-10, with codes I60–I69. In China, death certificates are completed at the time of death either by community doctors for deaths at home or by hospital doctors for deaths at the hospitals.
We obtained data on mean temperature, relative humidity, and apparent temperature (AT) from the Meteorological Bureau in each city. To control for potential confounding from outdoor air pollution, we also obtained daily data on air pollution from the National Air Pollution Monitoring System, which is certified by the Ministry of Environmental Protection of China. We included 3 air pollutants in the analyses: particulate matter less than 10 microns in aerodynamic diameter (PM10), sulfur dioxide (SO2), and nitrogen dioxide (NO2). The Chinese government has mandated detailed quality assurance and quality control programs at each monitoring station providing air pollution data.
Standard protocol approvals, registrations, and patient consents.
The Institutional Review Board at the School of Public Health, Fudan University, approved the study protocol (no. 2012-03-0324) with a waiver of informed consent. Data were analyzed at aggregate level and no participants were contacted.
Statistical analysis.
We did 2-stage analyses to investigate the associations between temperatures and daily stroke mortality. In the first stage, we calculated city-specific estimates using time-series regression models.10 This approach has the advantage of automatically controlling for time-invariant confounders (such as diabetes, smoking, drinking, and sociodemographic characteristics) by examining the same population repeatedly over time.11 In the second stage, we obtained the overall effect estimates by pooling city-specific results with the Bayesian hierarchical models.12 We also did a sensitivity analysis to examine the associations between AT and daily stroke mortality.
In city-specific analyses, we applied quasi-Poisson generalized additive models (GAM) because daily stroke deaths typically followed an overdispersed Poisson distribution.12 We incorporated several covariates in the GAM: 1) a natural cubic smooth function of calendar time with 7 degrees of freedom (df) per year, which excluded unmeasured long-term and seasonal trends in stroke mortality11; 2) measured confounders including air pollutants and relative humidity; and 3) an indicator variable for “day of the week.” We included temperature in the GAM as “cross-basis” function, which was constructed using distributed lag nonlinear model (DLNM) in order to flexibly account for the potential lagged and nonlinear effect of temperature on stroke mortality.13 This DLNM has the advantage of estimating cumulative effects of temperature on multiple days after adjusting for the collinearity of temperature on neighboring days.14 Similarly, we also introduced air pollutants and humidity as cross-basis functions to control for their lagged confounding effects on mortality. Specifically, for the DLNM of temperature, we used a natural cubic spline with 5 df to account for the nonlinear effect of temperature14 and a maximum lag of 14 days because previous studies showed that the mortality effects of low temperature could last for weeks, while the effects from hot temperatures tended to be shorter.15 For the DLNMs of air pollutants and humidity, we selected a natural cubic spline of 3 df and a maximum lag of 3 days. For all the DLNMs, we used the natural cubic spline with 4 df for the lagged effects (lag space) of temperature, air pollutants, and humidity.14
After the core model was built, we plotted flexibly the temperature–mortality relationships for each city. Because a unit change of temperature above or below a threshold would lead to different effect estimates using the DLNMs, we calculated the temperature's risks at a cutoff (percentile) of temperature relative to another cutoff in each city over lags 0–14 days. Specifically, we calculated the relative risks (RRs) for stroke mortality at extreme cold (first percentiles of city-specific temperature distribution) and cold (10th percentiles) temperatures, compared with the 25th percentiles of temperature; and the RRs for stroke mortality at extreme hot (99th percentiles of city-specific temperature distribution) and hot (90th percentiles) temperatures, compared with the 75th percentiles of temperature in each city. The selection of these cutoffs for calculating the RRs was somewhat arbitrary, but was similar to those from other studies.16,17 As previous studies indicated that the effects of hot temperatures were generally more short-term than those from cold temperatures, we also estimated temperature effects over the following lag periods: 0–3, 0–7, 0–21, and 0–28 days.
In the second stage, we used the Bayesian hierarchical models to pool the city-specific effect estimates.12,18 This approach provides a flexible tool to combine effect estimates while accounting for within-city statistical error and between-city variability (heterogeneity) of the “true” effects. The model generated a posterior probability distribution of the pooled mean estimates, from which we reported the combined log RRs as the posterior mean and 95% posterior interval (PI). We applied this hierarchical model by using 2-level normal independent sampling estimation with uniform priors, which could be implemented in TLNise package of R software.19 We performed a c2 test to examine heterogeneity of city-specific estimates (Cochran Q test). All models were fitted with the R software (version 2.15.1): the mgcv package for GAMs and the dlnm package for DLNMs.
RESULTS
Our study included almost 48 million urban residents from 8 large Chinese cities (table 1). During the study period, a total of 127,750 stroke deaths occurred, with higher stroke mortality in northern cities. We also observed a seasonal trend, with higher mortality in the winter. Further descriptive data on study population, air pollution, and humidity in these cities are available in table e-1 on the Neurology® Web site at www.neurology.org. There were no missing data in our dataset and few days with zero deaths. The annual mean temperature ranged from 8.2°C in Shenyang to 23.7°C in Hong Kong, which fully captures the temperature variations in China.
Table 1.
Descriptive data on study population, stroke deaths, and temperature in 8 Chinese cities
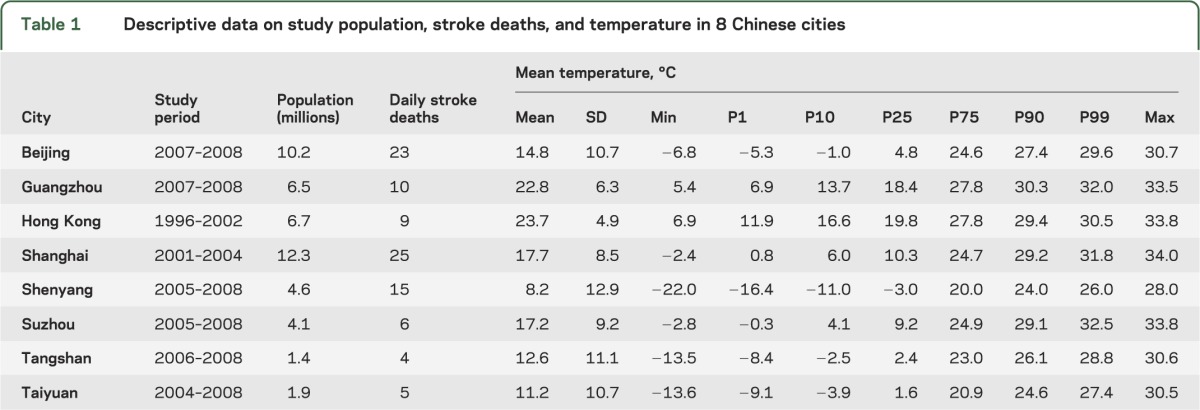
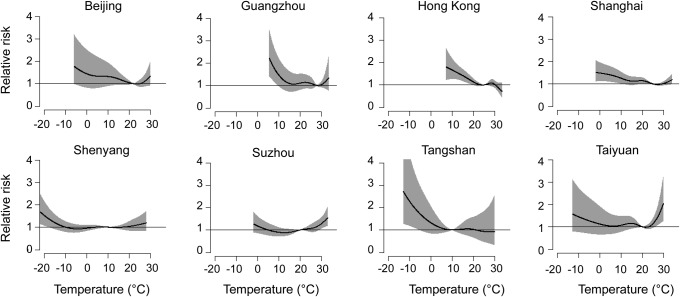
Figure 2 shows the cumulative effects of temperature on daily stroke mortality at lags 0–14 days in each city. The temperature–mortality relationship curves differed across cities; however, most curves were either U- or J-shaped with higher risks of stroke mortality at both low and high temperatures regardless of the statistical significance.
Figure 2. Nonlinear relationships between outdoor temperature and daily stroke mortality in 8 Chinese cities.
The associations were presented as relative risks of the full range of temperature with lags of 0–14 days compared to the minimum-mortality temperature. The black lines are the central effect estimates and the gray areas are the 95% intervals.
Generally, the effects of low temperature lasted for more than 2 weeks; however, the effects of high temperature were limited to the first 3 days and followed by decreased or even negative effects during the subsequent days. The curves of lag structure for the effects of extreme cold and extreme hot temperatures in each city over lags 0–14 days are available in figures e-1 and e-2.
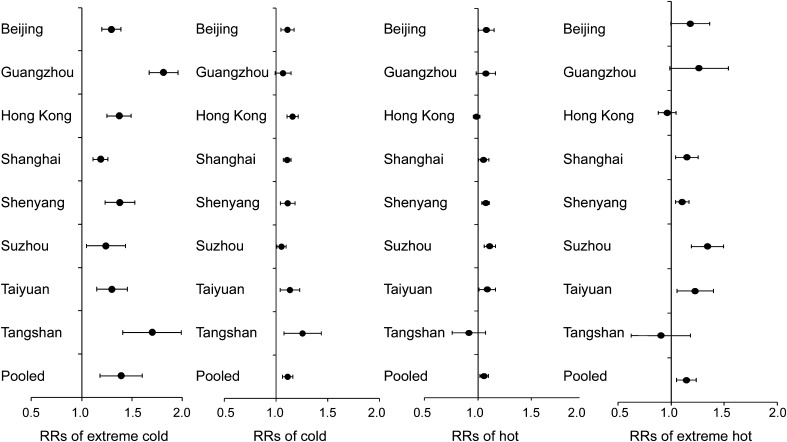
Figure 3 provides the city-specific and pooled RRs of extreme cold, cold, extreme hot, and hot temperatures as compared to their respective reference temperatures. The RRs varied across cities (p < 0.001 for Cochran Q test) for all temperature categories.
Figure 3. City-specific relative risks of stroke mortality for extreme cold, cold, hot, and extreme hot temperatures.
The dots are for the central effect estimates and the horizontal lines represent the 95% intervals. Extreme cold was defined as first percentile of temperature and cold as 10th percentile, both compared with the 25th percentile of temperature over lag 0–14 days. Extreme hot was defined as 99th percentile of temperature and hot as 90th percentile, both compared with the 75th percentile of temperature over lag 0–3 days. RR = relative risk.
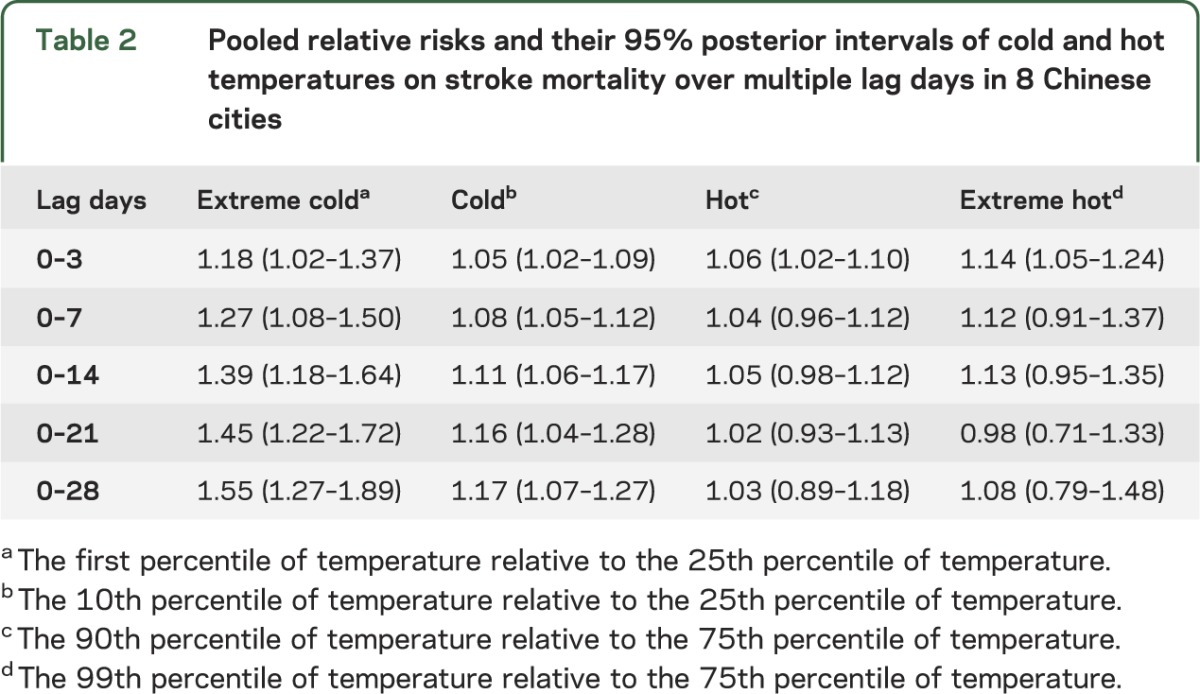
As indicated in table 2, the temperature's effects also varied by lag periods. The pooled RRs for cold and extreme cold temperatures increased with more lagged days. At lags 0–14 days, compared with the 25th percentile of temperature, the RR was 1.39 for extreme cold (first percentile) and 1.11 for cold (10th percentile) temperatures, respectively. In contrast, the adverse effects of hot temperatures were modest and more immediate. Compared with the 75th percentile of temperature, the pooled RRs during the first 3 lag days were 1.06 for hot (90th percentile) temperature and 1.14 for extreme hot (99th percentile) temperature.
Table 2.
Pooled relative risks and their 95% posterior intervals of cold and hot temperatures on stroke mortality over multiple lag days in 8 Chinese cities
We examined daily mean AT in relation to daily stroke mortality as a sensitivity analysis and obtained similar results as with temperature. Specifically, the RR was 1.36 (95% PI 1.06–1.73) comparing the first percentile of AT with the 25th percentile, 1.12 (95% PI 1.06–1.19) comparing the 10th percentile of AT with the 25th percentile, 1.06 (95% PI 1.02–1.10) comparing the 90th percentile of AT with the 75th percentile, and 1.13 (95% PI 1.03–1.24) comparing the 99th percentile of AT with the 75th percentile.
DISCUSSION
Using data from 8 large cities in China, we found that both cold and hot temperatures were associated with increased risk of stroke mortality. Further, our data suggest the potential effect of cold temperature lasts longer than that of hot temperature. Temperatures and associated adverse effects are potentially modifiable, for example, via air conditioning or lifestyle changes. These findings, if confirmed, may have important public health implications for stroke control in China.
Many epidemiologic studies have reported an association between temperature and the risk for stroke, although the exact findings were inconsistent.20 In mainland China, 2 studies in Beijing21 and Shenzhen22 found that the low weekly average temperature was associated with increased incidence of stroke. Similar findings on low temperature and higher stroke occurrence were also reported in South Korea,23 northern Portugal,24 and Hong Kong.8 On the other hand, hot temperature was linked to higher stroke risk in studies in Scotland,25 Mantua (Italy),9 New York City,26 California,27 Brisbane (Australia),28 and 4 cities in Korea.29 In the present study, we found that the associations between temperature and stroke mortality were often nonlinear—both low and high temperatures were linked to more stroke deaths. The exact reasons for these observational differences are difficult to disentangle, but may involve differences in study populations, geographic and meteorologic characteristics, periods of the study, and health care systems. Further, study designs and analytical strategies may contribute to the inconsistency between our results and previous findings. For example, most previous studies assumed a linear association in the analyses and did not examine the possibility of nonlinear relationships.
In the present study, we observed some differences across city-specific analyses. These differences may be due in part to characteristics of the study sites, such as climatic adaptation, housing types, building thermal isolation, and use of cooling and heating equipment. Previous studies reported that these characteristics accounted for some city-specific differences in the associations between temperature and other outcomes such as total mortality and hospitalizations.30
Various weather indicators have been used in meteorologic epidemiology. AT considers both air temperature and humidity, and thus it seems to be a better parameter to estimate the biological effects in comparison to air temperature alone. We observed similar effects of AT with temperature, which was consistent with previous studies showing that no single temperature measure is superior to the others.31
Our findings that both high and low temperatures were associated with increased risk of stroke mortality were consistent with previous findings on other cardiovascular outcomes, such as myocardial infarction,32 coronary heart disease mortality,33 and ischemic heart disease mortality.34 There are plausible, albeit complex, potential biological explanations for these observations. For example, cold temperature may lead to vasoconstriction to divert blood flow to central vital organs, resulting in a rise in blood pressure.35 Low outdoor temperature was strongly associated with high blood pressure in Chinese adults across a range of climatic conditions,36 and hypertension is the most important risk factor for hemorrhagic stroke in China. Cold stress may theoretically increase oxygen demand of the brain,37 which may in turn induce an excess of cerebral blood flow and exacerbate brain ischemia. Furthermore, a number of thrombogenic factors may rise in response to cold environment, such as blood cell counts, plasma cholesterol, C-reactive protein, fibrinogen concentrations, and platelet reactivity.38 On the other hand, when exposed to a hot environment, the body needs to increase heat diffusion via thermoregulatory means, such as elevating heart rates, vasodilatation, and sweating; as a result, blood supply to the brain may be reduced and existing ischemia may be aggravated. Dehydration on hot days may also increase blood viscosity and cholesterol levels, which in turn increases the likelihood of microvascular thrombosis and subsequent stroke.35 Finally, high temperature is associated with worse endothelial function.39 Further mechanistic studies are warranted to disentangle these complex relationships between ambient temperature and stroke.
Previous studies have shown that air pollution can also trigger stroke events.40 In our analysis, similar effects of temperature were observed before and after adjusting for PM10, SO2, and NO2 (data not shown), suggesting that our findings were robust against this potential confounder. We were unable to adjust for fine particles and ozone because they were not criteria pollutants in China and were not routinely monitored during the study period.
Our analysis had several strengths. The impact of temperature on health might be easier to be identified in developing countries, where air conditioning is less used. Further, the analysis included 127,750 stroke deaths from 8 large cities in China, lending sufficient statistical power to investigate the relationship between temperature and stroke mortality. Further, these cities cover large geographic regions in China (figure 1) and thus allowed our examination across diverse climatic environments.
Several limitations of our study should be mentioned. First, we utilized the 24-hour average outdoor temperature in the analysis, which may have underestimated the effect of shorter periods of exposures to extreme temperatures. Second, people often spent more time indoors in extreme weather, and therefore we might have underestimated the true effect of temperature on stroke mortality. Third, as in any study using registry-based mortality data, coding errors may occur. Also, we were unable to differentiate hemorrhagic from ischemic stroke, which may be of substantial interest in mechanistic studies. Previous studies have reported different impacts of ambient temperature on ischemic and hemorrhagic stroke.8,29 Finally, this study was inherently an ecologic analysis and thus potential confounding from individual-level risk factors could not be fully excluded.
Supplementary Material
GLOSSARY
- AT
apparent temperature
- df
degrees of freedom
- DLNM
distributed lag nonlinear model
- GAM
generalized additive models
- ICD-10
International Classification of Diseases, 10th revision
- NO2
nitrogen dioxide
- PI
posterior interval
- PM10
particulate matter less than 10 microns in aerodynamic diameter
- RR
relative risk
- SO2
sulfur dioxide
Footnotes
Supplemental data at www.neurology.org
AUTHOR CONTRIBUTIONS
R.C., C.W., and X.M. performed the statistical analysis and wrote the manuscript. H.K. took full responsibility for the whole study and revised the manuscript. T.Q.T., C.-M.W., and H.C. helped interpret the results and revise the manuscript.
STUDY FUNDING
Supported by the National Basic Research Program (973 program) of China (2011CB503802), Gong-Yi Program of China Ministry of Environmental Protection (201209008), National Natural Science Foundation of China (81222036), Shanghai Municipal Committee of Science and Technology (12dz1202602), and Shanghai Health Bureau (GWDTR201212). Dr. Honglei Chen is supported by the Intramural Program of NIH, the National Institute of Environmental Health Sciences.
DISCLOSURE
The authors report no disclosures relevant to the manuscript. Go to Neurology.org for full disclosures.
REFERENCES
- 1.Johnston SC, Mendis S, Mathers CD. Global variation in stroke burden and mortality: estimates from monitoring, surveillance, and modelling. Lancet Neurol 2009;8:345–354 [DOI] [PubMed] [Google Scholar]
- 2.Feigin VL, Lawes CM, Bennett DA, Barker-Collo SL, Parag V. Worldwide stroke incidence and early case fatality reported in 56 population-based studies: a systematic review. Lancet Neurol 2009;8:355–369 [DOI] [PubMed] [Google Scholar]
- 3.Kim AS, Johnston SC. Global variation in the relative burden of stroke and ischemic heart disease. Circulation 2011;124:314–323 [DOI] [PubMed] [Google Scholar]
- 4.Strong K, Mathers C, Bonita R. Preventing stroke: saving lives around the world. Lancet Neurol 2007;6:182–187 [DOI] [PubMed] [Google Scholar]
- 5.Go AS, Mozaffarian D, Roger VL, et al. Heart disease and stroke statistics: 2013 update: a report from the American Heart Association. Circulation 2013;127:e6–e245 [DOI] [PMC free article] [PubMed] [Google Scholar]
- 6.Turin TC, Kita Y, Murakami Y, et al. Higher stroke incidence in the spring season regardless of conventional risk factors: Takashima Stroke Registry, Japan, 1988–2001. Stroke 2008;39:745–752 [DOI] [PubMed] [Google Scholar]
- 7.Anlar O, Tombul T, Unal O, Kayan M. Seasonal and environmental temperature variation in the occurrence of ischemic strokes and intracerebral hemorrhages in a Turkish adult population. Int J Neurosci 2002;112:959–963 [DOI] [PubMed] [Google Scholar]
- 8.Goggins WB, Woo J, Ho S, Chan EY, Chau PH. Weather, season, and daily stroke admissions in Hong Kong. Int J Biometeorol 2012;56:865–872 [DOI] [PubMed] [Google Scholar]
- 9.Giua A, Abbas MA, Murgia N, Corea F. Climate and stroke: a controversial association. Int J Biometeorol 2010;54:1–3 [DOI] [PubMed] [Google Scholar]
- 10.Ye X, Wolff R, Yu W, Vaneckova P, Pan X, Tong S. Ambient temperature and morbidity: a review of epidemiological evidence. Environ Health Perspect 2012;120:19–28 [DOI] [PMC free article] [PubMed] [Google Scholar]
- 11.Peng RD, Dominici F, Louis TA. Model choice in time series studies of air pollution and mortality. J R Stat Soc Ser A Stat Soc 2006;169:179–203 [Google Scholar]
- 12.Dominici F, Peng RD, Bell ML, et al. Fine particulate air pollution and hospital admission for cardiovascular and respiratory diseases. JAMA 2006;295:1127–1134 [DOI] [PMC free article] [PubMed] [Google Scholar]
- 13.Gasparrini A, Armstrong B, Kenward MG. Distributed lag non-linear models. Stat Med 2010;29:2224–2234 [DOI] [PMC free article] [PubMed] [Google Scholar]
- 14.Gasparrini A. Distributed lag linear and non-linear models in R: the package dlnm. J Stat Softw 2011;43:1–20 [PMC free article] [PubMed] [Google Scholar]
- 15.Guo Y, Barnett AG, Pan X, Yu W, Tong S. The impact of temperature on mortality in Tianjin, China: a case-crossover design with a distributed lag nonlinear model. Environ Health Perspect 2011;119:1719–1725 [DOI] [PMC free article] [PubMed] [Google Scholar]
- 16.Guo Y, Punnasiri K, Tong S. Effects of temperature on mortality in Chiang Mai City, Thailand: a time series study. Environ Health 2012;11:36. [DOI] [PMC free article] [PubMed] [Google Scholar]
- 17.Goldberg MS, Gasparrini A, Armstrong B, Valois MF. The short-term influence of temperature on daily mortality in the temperate climate of Montreal, Canada. Environ Res 2011;111:853–860 [DOI] [PubMed] [Google Scholar]
- 18.Bell ML, Peng RD, Dominici F, Samet JM. Emergency hospital admissions for cardiovascular diseases and ambient levels of carbon monoxide: results for 126 United States urban counties, 1999-2005. Circulation 2009;120:949–955 [DOI] [PMC free article] [PubMed] [Google Scholar]
- 19.Everson PJ, Morris CN. Inference for multivariate normal hierarchical models. J R Stat Soc Ser B Stat Methodol 2000;62:399–412 [Google Scholar]
- 20.Dawson J, Quinn T, Walters MR. Under the weather with stroke; more data emerge. Int J Stroke 2009;4:19–20 [DOI] [PubMed] [Google Scholar]
- 21.Liu F, Zhang JL, Lu C. The relationship of temperature and stroke incidence in Beijing: a time-series study [in Chinese]. Chin J Epidemiol 2004;25:962–966 [PubMed] [Google Scholar]
- 22.Chen J, Liu J, Zhang R. Relationship between temperature and stroke incidence in Shenzhen [in Chinese]. Chin J Public Health 2007;23:39–42 [Google Scholar]
- 23.Hong YC, Rha JH, Lee JT, Ha EH, Kwon HJ, Kim H. Ischemic stroke associated with decrease in temperature. Epidemiology 2003;14:473–478 [DOI] [PubMed] [Google Scholar]
- 24.Magalhaes R, Silva MC, Correia M, Bailey T. Are stroke occurrence and outcome related to weather parameters? Results from a population-based study in northern Portugal. Cerebrovasc Dis 2011;32:542–551 [DOI] [PubMed] [Google Scholar]
- 25.Dawson J, Weir C, Wright F, et al. Associations between meteorological variables and acute stroke hospital admissions in the west of Scotland. Acta Neurol Scand 2008;117:85–89 [DOI] [PubMed] [Google Scholar]
- 26.Low RB, Bielory L, Qureshi AI, Dunn V, Stuhlmiller DF, Dickey DA. The relation of stroke admissions to recent weather, airborne allergens, air pollution, seasons, upper respiratory infections, and asthma incidence, September 11, 2001, and day of the week. Stroke 2006;37:951–957 [DOI] [PubMed] [Google Scholar]
- 27.Basu R, Pearson D, Malig B, Broadwin R, Green R. The effect of high ambient temperature on emergency room visits. Epidemiology 2012;23:813–820 [DOI] [PubMed] [Google Scholar]
- 28.Wang XY, Barnett AG, Hu W, Tong S. Temperature variation and emergency hospital admissions for stroke in Brisbane, Australia, 1996-2005. Int J Biometeorol 2009;53:535–541 [DOI] [PubMed] [Google Scholar]
- 29.Lim YH, Kim H, Hong YC. Variation in mortality of ischemic and hemorrhagic strokes in relation to high temperature. Int J Biometeorol 2013;57:145–153 [DOI] [PubMed] [Google Scholar]
- 30.Basu R, Samet JM. Relation between elevated ambient temperature and mortality: a review of the epidemiologic evidence. Epidemiol Rev 2002;24:190–202 [DOI] [PubMed] [Google Scholar]
- 31.Kim YM, Kim S, Cheong HK, Kim EH. Comparison of temperature indexes for the impact assessment of heat stress on heat-related mortality. Environ Health Toxicol 2011;26:e2011009. [DOI] [PMC free article] [PubMed] [Google Scholar]
- 32.Schwartz J, Samet JM, Patz JA. Hospital admissions for heart disease: the effects of temperature and humidity. Epidemiology 2004;15:755–761 [DOI] [PubMed] [Google Scholar]
- 33.Tian Z, Li S, Zhang J, Jaakkola JJ, Guo Y. Ambient temperature and coronary heart disease mortality in Beijing, China: a time series study. Environ Health 2012;11:56. [DOI] [PMC free article] [PubMed] [Google Scholar]
- 34.Guo Y, Li S, Zhang Y, et al. Extremely cold and hot temperatures increase the risk of ischaemic heart disease mortality: epidemiological evidence from China. Heart 2013;99:195–203 [DOI] [PubMed] [Google Scholar]
- 35.McArthur K, Dawson J, Walters M. What is it with the weather and stroke? Expert Rev Neurother 2010;10:243–249 [DOI] [PubMed] [Google Scholar]
- 36.Lewington S, Li L, Sherliker P, et al. Seasonal variation in blood pressure and its relationship with outdoor temperature in 10 diverse regions of China: the China Kadoorie Biobank. J Hypertens 2012;30:1383–1391 [DOI] [PMC free article] [PubMed] [Google Scholar]
- 37.Croughwell N, Smith LR, Quill T, et al. The effect of temperature on cerebral metabolism and blood flow in adults during cardiopulmonary bypass. J Thorac Cardiovasc Surg 1992;103:549–554 [PubMed] [Google Scholar]
- 38.Wolf K, Schneider A, Breitner S, et al. Air temperature and the occurrence of myocardial infarction in Augsburg, Germany. Circulation 2009;120:735–742 [DOI] [PubMed] [Google Scholar]
- 39.Nawrot TS, Staessen JA, Fagard RH, Van Bortel LM, Struijker-Boudier HA. Endothelial function and outdoor temperature. Eur J Epidemiol 2005;20:407–410 [DOI] [PubMed] [Google Scholar]
- 40.Kan H, Jia J, Chen B. Acute stroke mortality and air pollution: new evidence from Shanghai, China. J Occup Health 2003;45:321–323 [DOI] [PubMed] [Google Scholar]
Associated Data
This section collects any data citations, data availability statements, or supplementary materials included in this article.


