

Abstract
Berberine (BER), a natural product and active ingredient of genera Berberis and Coptis, has been demonstrated to possess anti-diabetic activities. However, the poor bioavailability of this agent greatly limits its clinical application. In our previous study, we demonstrated that co-administration of sodium caprate, an absorption enhancer, with BER could significantly increase the bioavailability of BER without any serious mucosal damage. Here, we investigated the effects of BER on AMP-activated protein kinase (AMPK)/gluconeogenesis pathway and the effects of sodium caprate on hypoglycemic action of BER. The ability of BER co-administered with sodium caprate to reduce insulin resistance was investigated in diabetic rat model induced by high-fat diet and low dose STZ. Western blot was performed to evaluate effects of BER on AMPK signaling proteins involved in hepatic gluconeogenesis in diabetic rat and HepG2 hepatocytes. BER reduced body weight and caused a significant improvement in glucose tolerance without altering food intake in diabetic rats. Similarly, BER reduced plasma triglycerides and improved insulin action in diabetic rats. BER down-regulated the elevated expressions of gluconeogenesis key enzymes PEPCK and G6Pase, inhibited the translocation of TORC2 from cytoplasm to nucleus and increased AMPK activity in liver tissues. The effect of BER was higher when co-administered with sodium caprate. BER treatment resulted in reduced glucose production in HepG2 hepatocytes. BER increased AMPK activity, reduced the expression of PEPCK, and the nuclear transcription factors PGC-1, HNF-4α and FOXO1. The effect of BER on gluconeogenesis could be partly blocked by AMPK inhibitor, Compound C. BER could suppress hepatic gluconeogenesis in rat model of diabetes at least in part via stimulation of AMPK activity and this action of BER is augmented by sodium caprate.
Keywords: Berberine, Sodium caprate, AMP-activated protein kinase, Diabetes, Hepatic gluconeogenesis, Metabolic syndrome
1. Introduction
Diabetes mellitus is a serious, complex metabolic disorder affecting approximately 4% of the population worldwide and is expected to increase to 5.4% in 2025 (Roglic et al., 2004). Despite introduction of hypoglycemic drugs in recent years, the prevalence of diabetes and related complications still remain a major global medical problem. The traditional Chinese medicines have become candidates as novel and potential hypoglycemic agents (Yang et al., 2011).
Berberine (BER) is an isoquinoline alkaloid extracted from the genera Berberis and Coptis which have been commonly used as an oral drug to treat gastroenteritis and secretary diarrhea as traditional Chinese medicines for more than 1400 years (Zhang and Shen, 1989). Its therapeutic potential for the treatment of diabetes (Wang et al., 2010; Yin et al., 2008) and its complications, such as hyperlipidemia and cardiovascular diseases (Wang et al., 2009; Zeng et al., 2003) in human and animal models has been widely studied. While, it has been reported that BER is a xenobiotic with poor bioavailability (<5%) (Maeng et al., 2002) due to less absorption from the intestine. High dose oral administration usually causes gastrointestinal side effects, which greatly limit its clinical application. In our previous study, we chose sodium caprate, an absorption enhancer, co-administered with BER, to improve its intestinal absorption. Sodium caprate, a medium chain fatty acid, is a well-recognized absorption enhancer. It increases the paracellular permeability through enlarging the tight junctions, and then expanding paracellular routes for water-soluble, low lipophilic, and poorly absorbable drugs. Our previous data showed that sodium caprate could significantly increase the bioavailability of BER without any serious mucosal damage (Lv et al., 2010). In this study, we investigated whether co-administration of sodium caprate would alter the hypoglycemic effect of BER in diabetes mellitus in rats.
Type 2 diabetes mellitus is a complicated glucose metabolic disease characterized by impairment of both glucose utilization and gluconeogenesis. Presently, the anti-diabetic effects of BER have been mostly studied on glucose uptake, which might be via regulation of AMP-activated protein kinase (AMPK) activity (Brusq et al., 2006; Cheng et al., 2006; Kim et al., 2007; Lee et al., 2006; Liu et al., 2010a). However, there is a few studies exploring its effect on gluconeogenesis but its mechanisms of action remain uncertain.
AMPK is an attractive drug target that plays a key role in regulation of whole-body energy homeostasis. Activation of hepatic AMPK leads to increased fatty acid oxidation and simultaneously inhibition of hepatic glucose production as well as lipogenesis, and cholesterol synthesis. Recently, activation of AMPK was found to phosphorylate TORC2 (Koo et al., 2005), which mediates CREB-dependent transcription of PGC1 and its subsequent gluconeogenic targets PEPCK and G6Pase, thus inhibiting the hepatic gluconeogenesis. BER has been reported to display insulin-sensitizing properties in rodent models of insulin resistance and diabetes (Lee et al., 2006). These beneficial effects of BER are related in part to its ability to activate AMPK (Brusq et al., 2006; Cheng et al., 2006; Lee et al., 2006). In this study, effect of BER on hepatic gluconeogenesis mediated by AMPK was studied in diabetic rats and HepG2 hepatocytes. We also examined the effect of BER co-administered with sodium caprate on this response.
2. Materials and methods
2.1. Experimental animals
Male Wistar rats (160–180 g) aged 8–10 weeks were purchased from the Experimental Animal Holding Facility of Jilin University. The animals were housed in standard polypropylene cages (three rats/cage) and maintained under the experimental conditions (temperature: 20 ± 2 °C, humidity: 60 ± 5%, 12-h dark–light cycle). All procedures were approved by the Ethics Committee for the Use of Experimental Animals of Jilin University.
2.2. Rat studies
The method of Streptozotocin (STZ) and the high fat diet induced T2DM diabetic animals was performed as previously described (Zhang et al., 2008). The control group was fed regular chow, and the DM group was given a high fat diet for 4 weeks. Regular chow consisted of 5% fat, 53% carbohydrate, 23% protein, with a total caloric value of 25 kJ/kg and a high fat diet consisted of 22% fat, 48% carbohydrate, and 20% protein with a total caloric value of 44.3 kJ/kg were provided by the Artificial Diet Center of the Experimental Animal Holding Facility.
After high fat diet fed for 4 weeks, the DM group were injected intraperitoneally (i.p.) with STZ (30 mg/kg) after an overnight fast. After 1 week, fasting blood glucose was measured in this group. The rats with fasting blood glucose <7.8 mmol/L were injected with STZ again (30 mg/kg), while the control rats were given vehicle citrate buffer (pH 4.4) both in a volume of 0.25 ml/kg, i.p. Four weeks after STZ injection, the rats with a two-time the fasting blood glucose of ≥7.8 mmol/L were considered to be diabetic.
Then the rats were divided into 7 groups: age-matched rats that neither received STZ nor the high fat diet served as the control (CON) group; diabetic rats without any drug treatment (DM); diabetic rats treated with BER at the oral dose of 50 mg/kg (LB) or 100 mg/kg (HB) every day; diabetic rats treated with BER (50 mg/ kg and 100 mg/kg) combined with sodium caprate (50 mg/kg) [LBS and HBS, respectively]; and diabetic rats treated with only sodium caprate (50 mg/kg) (SC group). There were 10 animals in each group. Animal weight was measured each week throughout the experiment and the drug dose was adjusted accordingly. After 4 weeks treatment, intraperitoneal glucose tolerance test was conducted, and fasting plasma was collected for further measurement of fasting insulin, triglyceride, total cholesterol, and blood glucose. At the end of the study, the rats were sacrificed and the livers were isolated and stored in −80 °C immediately for later analysis.
2.3. Measurement of fasting blood glucose, fasting insulin, triglyceride, total cholesterol, ISI and IPGTT
Rats were fasted for 12–16 h. Blood was collected from tail vein, and plasma was separated by centrifugation at 3500g for 10 min. Fasting blood glucose, total cholesterol, and triglyceride were measured according to the instructions of corresponding commercial kits. Fasting insulin was assayed by RIA (radioimmunoassay) according to the instructions provided by the manufacture. According to the fasting insulin and glucose concentration of each rat, we calculated the insulin sensitivity index by the formula Ln (fasting blood glucose × fasting insulin)−1 (Zhou et al., 2009).
The i.p. glucose tolerance test (IPGTT) was conducted after an overnight fast (12–16 h). Rats were injected with 40% glucose (2 g/kg body weight, i.p). Blood samples were collected from the tail at 0, 30, 60 and 120 min thereafter for measurement of glucose.
2.4. Cell experiments
HepG2 cell line was purchased from ATCC. The cells were grown in DMEM (11.1 mmol/L glucose) containing 12% fetal bovine serum. Two days before the experiments, the cells were plated into 6-well tissue culture plates. After the cells reached confluence, the medium was replaced by DMEM supplemented with 0.2% BSA. After 12 h, the medium was removed and the same medium containing 10 μmol/l BER and/or 20 μmol/l AICAR and/or 20 μmol/l Compound C was added. Total protein and nucleoprotein were extracted after 24 h incubation, using the protein extraction kits. The total protein was immunoblotted with antibodies specific for AMPK, pThr172-AMPK and PEPCK, while nucleoprotein for PGC-1α, FOXO1 and HNF4α.
2.5. Glucose production assay
Glucose production from HepG2 cell was measured according to the manufacturer’s protocol, using a colorimetric glucose oxidase assay (Sigma). Briefly, after the experimental time period as indicated, the cells were washed and incubated for 3 h in glucose production buffer (glucose-free Dulbecco’s modified Eagle’s medium, pH 7.4, containing 20 mmol/l sodium lactate, 1 mmol/l sodium pyruvate, and 15 mmol/l HEPES, without phenol red). The readings were then normalized to the total protein content determined from the whole-cell lysates (Dentin et al., 2007).
2.6. Total RNA extraction and RT-PCR
RT-PCR assays were performed as previously described (Zhang et al., 2009). Total RNA was extracted from 100 mg rat frozen liver tissue by the Trizol method, and the first-strand cDNAs were synthesized from 5 μg total RNA using SuperScript reverse transcriptase and oligo (deoxythymidine) primers. The reverse transcription products (5 μg) were amplified by PCR using Taq DNA polymerase and specific primers (G6Pase: sense: 5′-ACAT CCGGGGCATCTACAATG-3′, antisense: 5′-AAAGAGATGCAGCAGGC CCAA-3′, 338 bp; PEPCK: sense: 5′-AGCCTCGACAGCCTGC CCC AGG-3′, antisense: 5′-CCAGTTGTTGACCAAAGGCTTTT-3′, 575 bp; GAPDH: sense: 5′-CCATGGAGAAGGCTGGG-3′, antisense: 5′-CCAGT TGTTGACCAAAGGCTTTT-3′, 194 bp). Another 5 μg of the reverse transcription product was amplified with GAPDH primers as an internal control. For each gene, the PCR program consisted of denaturation at 94 °C for 5 min, followed by 30 cycles of 45 s at 94 °C, 45 s at specific annealing temperatures (62 °C for G6Pase and GAPDH, 57 °C for PEPCK), 90 s at 72 °C, and a final 7 min at 72 °C. The expected RT-PCR products are shown in Table 1. RT-PCR products (10 μg) were electrophoresed in a 1.0% agarose gel, stained with ethidium bromide, and densitometrically analyzed using Image software.
Table 1.
Changes induced by BER co-administered with sodium caprate in biochemical parameter and insulin sensitivity index in diabetic rats.
| Group | n | Body weight (g)
|
FBG (mmol/l) | FINS (mmol/l) | ISI | TG | TC | |
|---|---|---|---|---|---|---|---|---|
| Initial | Final | |||||||
| Control | 10 | 433.12 ± 19.23 | 464.92 ± 22.8 | 4.67 ± 0.53 | 10.49 ± 1.48 | −3.84 ± 0.19 | 0.63 ± 0.09 | 1.76 ± 0.18 |
| DM | 8 | 438.77 ± 27.50 | 454.75 ± 24.02 | 10.68 ± 0.76### | 9.15 ± 0.95 | −4.56 ± 0.17# | 2.05 ± 0.30### | 3.12 ± 0.26## |
| LB | 8 | 440.9 ± 22.03 | 424.92 ± 17.5* | 10.92 ± 0.54 | 9.47 ± 1.66 | −4.60 ± 0.22 | 1.15 ± 0.11* | 3.38 ± 0.30 |
| HB | 8 | 444.27 ± 32.67 | 417.41 ± 32.39* | 7.91 ± 1.41* | 9.68 ± 0.92 | −4.27 ± 0.20 | 0.92 ± 0.12* | 2.94 ± 0.73 |
| LBS | 8 | 445.36 ± 23.62 | 404.66 ± 29.61* | 6.15 ± 0.39** | 9.32 ± 1.49 | −4.00 ± 0.19 | 0.94 ± 0.10* | 3.09 ± 0.33 |
| HBS | 8 | 431.35 ± 20.72 | 400.25 ± 24.32* | 5.42 ± 0.55*Δ | 10.39 ± 1.54*Δ | −3.97 ± 0.24 | 0.79 ± 0.08* | 2.57 ± 0.24* |
| SC | 8 | 443.35 ± 19.43 | 474.47 ± 14.04 | 10.06 ± 0.52 | 9.18 ± 1.34 | −4.52 ± 0.28 | 2.15 ± 0.24 | 3.33 ± 0.72 |
Control: age-matched normal control rats; DM: diabetic rats without any drug treatment; LB: diabetic rats treated with BER at a lower (50 mg/kg) dose. HB: diabetic rats treated with BER at a higher (100 mg/kg) dose; diabetic rats treated with BER (50 mg/kg, 100 mg/kg) combined with sodium caprate (50 mg/kg) (LBS and HBS, respectively); SC: diabetic rats treated with only sodium caprate (50 mg/kg). FBG: fasting blood glucose; FINS: fasting blood insulin; ISI: insulin sensitivity index; ISI = ln (FBG × FINS)− 1; TG: triglyceride; TC: total cholesterol.
P < 0.05,
P < 0.01,
P < 0.001 vs. Control group;
P < 0.05,
P < 0.01,
P < 0.001 vs. DM group;
P < 0.05 vs. HB group, respectively.
Data shown are means ± SE (n = 8–10 rats/group).
2.7. Preparation of tissue extracts for protein determination
Liver tissue (50 mg) was homogenized on ice at setting 8 for 2 ± 30 s with 30 s interval in using a Polytron PT 3000 tissue homogenizer (Brinkmann Instruments) in 1 ml of buffer containing: 10 mM Tris–HCl, 0.25 M sucrose, 10 mM NaCl, 1 mM EDTA, 1% SDS and protease inhibitor cocktail (Roche), pH 7.5. The suspension was centrifuged at 3000g for 15 min in an ultracentrifuge (Thermo Company). The supernatant was collected, and then centrifuged at 12,000g for 15 min. The supernatant obtained was labeled as total protein extract. Nuclear and cytoplasm protein isolation was performed as the instruction of Nuclear and Cytoplasm Protein Extraction Kit. Protein concentration was estimated by the microassay procedure of Bradford. Tissue samples were diluted to a final volume of 1600 μl, and treated identically to standards. A standard curve was obtained by taking different samples of BSA solution containing 2.5, 5, 7.5, 10 μg/ml. The color reagent (400 μl) was added to each tube and the mixture incubated for 15 min at 22 °C. The color intensity was measured in a spectrophotometer at 595 nm.
2.8. Analysis of protein content
The immunoblotting analysis was performed by separation of 80 μg protein on a 12% SDS–polyacrylamide electrophoresis gel (SDS–PAGE) followed by immunostaining by Western blot assay. The concentration of protein in these samples was adjusted to 8 mg/ml with 4× SDS–PAGE loading buffer containing 250 mM Tris–HCl (pH 6.8 at 25 °C), 8% w/v SDS, 40% glycerol, 200 mM β-mercaptoethanol and 0.4% w/v bromophenol blue. The electrophoresis was carried out first at 80 V for 20 min followed by 180 V for 60–85 min. The proteins separated by SDS–PAGE were then electroblotted at 4 °C to polyvinylidene difluoride membrane (PVDF) by employing a transfer buffer containing 25 mM Tris–HCl, 192 mM glycine and 20% methanol (v/v) for the determination of relative protein content with immunoblotting analysis. The transferred membranes were incubated 2 h in blocking buffer, TBST (10 mM Tris–HCl, 150 mM NaCl and 0.1% Tween-20) containing 5% non-fat milk powder and then incubated overnight with primary antibody (1:800 or 1:1000) in 10 ml TBST with gentle agitation at 4 °C. The membranes were then washed three times for 10 min each with 15 ml of TBST and then incubated with second antibody (1:2000 Goat Anti-Rabbit IgG Horseradish Peroxidase Conjugate) at room temperature for 1 h. The membranes were again washed three times with TBST, as described above. Antigen– antibody complexes in all membranes were detected by the chemiluminescence ECL plus kit. An imaging densitometer was used to scan the protein bands and the densities were quantified using the image analysis software. Protein loading was checked in every experiment by staining the membrane with ponseau S before immunoblotting.
2.9. Statistical analysis
The data are presented as mean with the SEM as indicated. All data were normally distributed. To determine treatment effects, a parametric one-way analysis of variance (ANOVA) followed by Tukey’s post hoc test was used as appropriately indicated to calculate statistical differences using Statistical Product and Service Solutions (SPSS) software. P values of less than 0.05 were considered statistically significant.
2.10. Materials
Reference grade BER (purity quotient > 99.8%) was purchased from the Institute for the Northeast tragacanth, Changchun, China. Sodium caprate was purchased from Sigma Chemical Company. STZ was purchased from Sigma, insulin was purchased from Eli Lilly, Changchun, China; glucose, total cholesterol, and triglyceride test kits were purchased from Beijing BHKT Clinical Reagent Co., Ltd., Beijing, China; Iodine[125I] Insulin Radioimmunoassay Kit was purchased from Tianjing Nine Tripods Medical & Bioengineering Co., Ltd., Tianjing, China; Other reagents were purchase from Beijing General Chemical Reagent Factory, Beijing, China. Cytoplasm Protein Extraction Kit was purchased from Beyotime Institute of Biotechnology, Shanghai, China. Antibodies (AMPK, p-AMPK, FOXO1, HNF-4α, PGC-1, TORC2, PEPCK, Actin and G-6-Pase) were purchased from Santa Cruz. The chemical agents for Western blot and RT-PCR were purchased from Sigma–Aldrich. The enzymes and dNTP mixtures for RT-PCR were purchased from Fermentas Company. Oligo dt(18) was purchased from TaKaRa Company.
3. Results
3.1. Effects of BER co-administered with sodium caprate on glucose and lipid metabolic parameters
The biochemical parameter and body weight measured at the end of the studies are presented in Table 1. In the DM group, fasting blood glucose (FBG), triglyceride, and total cholesterol were significantly higher compared to control group. Fasting insulin levels seemed no difference between the two groups, however, the insulin sensitivity index was much lower in the DM than control group, indicating that the insulin sensitivity was remarkably decreased in this group. High dose of BER decreased FBG, while the effect was augmented when co-administered with sodium caprate. After 30 days of treatment, all BER groups obviously had reduced body weight. The TC and TG levels of diabetic rats were significantly higher than those of the control ones. BER for 4 weeks significantly reversed TC and TG contents toward normal levels. Sodium caprate alone had no effects on these parameters.
3.2. Effects of BER co-administered with sodium caprate on intraperitoneal glucose tolerance test in the experimental diabetic model
The glucose tolerance test is shown in Fig. 1. As can be observed, blood glucose in the DM group was higher than control group at every time point, and the area under the glucose concentration curve (AUC) was significantly greater compared with control. Low-dose BER did not affect the glucose tolerance, compared with the DM group. In the low dose and high dose BER groups which were co-administered sodium caprate, glucose concentrations declined faster at each time point compared with the DM group. And compared with BER alone, a BER group which was co-administered with sodium caprate showed better glucose tolerance improvement.
Fig. 1.

(A) Plasma glucose (mmol/L) in diabetic and control rats 8 weeks after STZ (30 mg/kg, twice, i.p.) treatment. (B) The area under the glucose concentration curves (mmol/L min) in different groups. Control: age-matched normal control rats; DM: diabetic rats without any drug treatment; LB: diabetic rats treated with BER at a lower (50 mg/kg) dose; HB: diabetic rats treated with BER at a higher (100 mg/kg) dose; diabetic rats treated with BER (50 mg/kg, 100 mg/kg) combined with sodium caprate (50 mg/kg) (LBS and HBS, respectively). *P < 0.05, **P < 0.01, ***P < 0.001, vs. DM group, ΔP < 0.05, vs. Ber group, respectively. Data shown are means ± SE (n = 6– 8 rats/group per time point).
3.3. Effects of BER co-administered with sodium caprate on gluconeogenesis in liver tissues of diabetic rats
To test the mechanism of enhanced hypoglycemic effect of BER when co-administered with sodium caprate, hepatic gluconeogenesis at the gene expression level was determined. The mRNA and protein levels of PEPCK and G6Pase were significantly increased in DM group compared with the control group. After BER treatment, the expression of both gene and protein was decreased; moreover, the effect of BER co-administered with sodium caprate seemed to be more significant than BER alone. On the other hand, sodium caprate alone did not alter gene and protein expression (Fig. 2). Fig. 3 showed that the PGC-1α level was increased in diabetic group compared with control group, while both doses of BER and co-administered with sodium caprate could significantly reverse this change. Meanwhile, Fig. 4 showed that the protein level of TORC2-mediated PGC-1a in nucleus was increased in diabetic group compared to control group, its level in cytoplasm in diabetic group was decreased at same time. However, high dose of berberine treatment and co-administered with sodium caprate could significantly block this translocation, and inhibitory efficacy was stronger when co-administered than BER alone.
Fig. 2.

Expression of PEPCK and G6Pase mRNA (left) and protein (right) levels in the liver. Protein levels are expressed relative to the control. Con: normal control rats; DM: diabetic rats; HB: diabetic rats treated with BER at a higher (100 mg/kg) dose; HBS: diabetic rats treated with BER (100 mg/kg) combined with sodium caprate (50 mg/kg). Values are the means ± SE (n = 6–8). *P < 0.05, vs. DM group. #P < 0.05, vs. CON group.
Fig. 3.
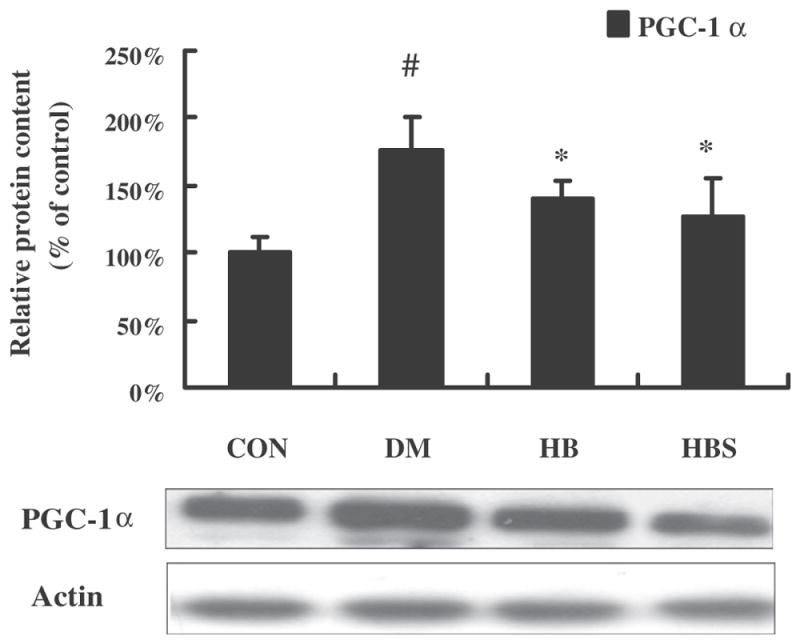
Expression of PGC-1α protein levels in the liver. Protein level of PGC-1α is expressed relative to the control. Con: normal control rats; DM: diabetic rats; HB: diabetic rats treated with BER at the dose of 100 mg/kg; HBS: diabetic rats treated with BER (100 mg/kg) combined with sodium caprate (50 mg/kg). Values are the means ± SE (n = 6–8 rats/group). *P < 0.05, vs. DM group. #P < 0.05 vs. CON group.
Fig. 4.

Expression of TORC2 levels in nuclear and cytoplasm of liver. Protein levels are expressed relative to the control. Con: normal control rats; DM: diabetic rats; HB: diabetic rats treated with BER (100 mg/kg); HBS: diabetic rats treated with BER (100 mg/kg) combined with sodium caprate (50 mg/kg). Values are the means ± SE (n = 6–8 rats/group). *P < 0.05, vs. DM group. #P < 0.05 vs. CON group.
3.4. Effects of BER co-administered with sodium caprate on phosphorylation of AMPK in liver tissue of diabetic rats
As shown in Fig. 5, AMPK phosphorylation was lower in DM group than in the control group while AMPK protein level seemed to be comparable between two groups. After 4 weeks treatment, BER induced less AMPK protein expression, but more phosphorylation of AMPK (Thr172) increasing the ratio of p-AMPK/total AMPK. The BER + sodium caprate group had the highest ratio of p-AMPK/ total AMPK among the four groups.
Fig. 5.

Expression of AMPK/P-AMPK and PGC-1protein levels in the liver. Protein levels are expressed relative to the control. Con: normal control rats; DM: diabetic rats; HB: diabetic rats treated with BER (100 mg/kg); HBS: diabetic rats treated with BER (100 mg/kg) combined with sodium caprate (50 mg/kg). Values are the means ± SE (n = 6–8 rats/group). *P < 0.05, vs. DM group. #P < 0.05 vs. CON group.
3.5. Effects of BER on hepatic gluconeogenesis in HepG2 hepatocytes
In order to confirm hepatic gluconeogenesis inhibition by BER via AMPK activation, the effect of BER 10 μmol/Lon glucose output in HepG2 hepatocytes was first examined. As shown in Fig. 6, BER and the AMPK activator AICAR significantly decreased glucose production. However, Compound C, AMPK inhibitor, reversed the effect of BER in HepG2 hepatocytes. Second, effects of BER on AMPK mediated hepatic gluconeogenesis pathway were determined. As illustrated in Fig. 7, BER increased phosphorylation of AMPK remarkably, even stronger than AICAR, and this effect was blocked by Compound C. Both BER and AICAR also significantly down-regulated PEPCK in HepG2 cells, however BER and Compound C co-incubation had a weaker inhibitory effect on PEPCK than BER group, suggesting that inhibitory action of BER on key enzyme PEPCK during hepatic gluconeogenesis is at least partly mediated by activating AMPK (Fig. 8A).
Fig. 6.
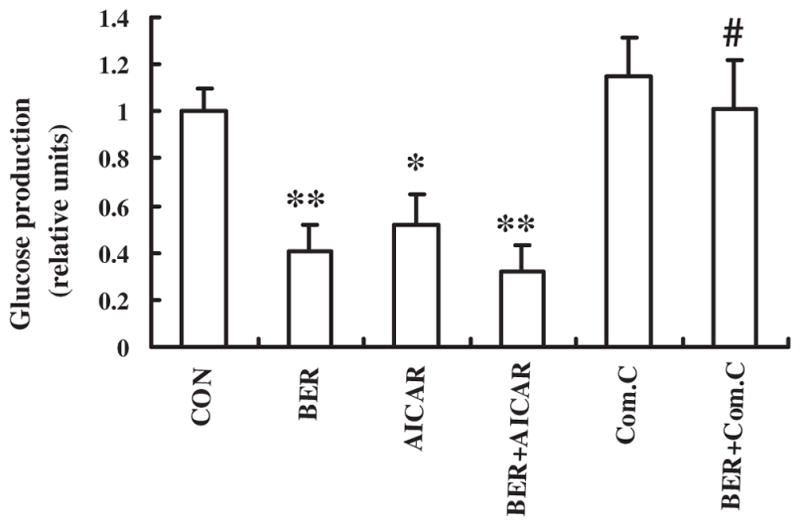
BER suppresses hepatic glucose production in HepG2 hepatocytes. Glucose output assay was performed using HepG2 hepatocytes treated with 10 μmol/l BER and/or 20 μmol/l AICAR and/or 20 μmol/l Compound C for 24 h, using glucose-free media supplemented with gluconeogenic substrate sodium lactate (20 mM) and sodium pyruvate (1 mM). Data was expressed as means ± SEM (n = 3). *P < 0.05 vs. CON group; #P < 0.05 compared with AICAR group.
Fig. 7.

Effect of BER on AMPK in HepG2 hepatocytes. The cells were incubated for 10 μmol/l BER and/or 20 μmol/l AICAR and/or 20 μmol/l Compound C. Total protein was extracted after 24-h incubation, using the protein extracted kits. Western blot was performed in the cells to check phosphorylation and total protein levels of AMPK. Ratio of pAMPK/AMPK was quantified in three independent experiments per condition. Data was expressed as means ± SEM (n = 3). *P < 0.05 compared with control group; #P < 0.05 vs. BER group.
Fig. 8.

Effect of BER on hepatic gluconeogenesis pathway in HepG2 cells. HepG2 cells were incubated for 10 μmol/L BER and/or 1 mmol/L AICAR and/or 10 μmol/L Compound C. Total protein were extracted after 24-h incubation, using the protein extracted kits. The total protein was immunoblotted with antibodies specific for PEPCK (A), PGC-1α, FOXO1 and HNF4α (B–D). Data was expressed as means ± SEM (n = 3). *P < 0.05, Compared with CON group. #P < 0.05, Compared with BER group.
HNF4α and FOXO1 are two important nuclear transcription factors controlling PEPCK transcription. TORC2 was dephosphorylated and translocated into nuclear, association with CREB transcription factor, driving the expression of the PGC1α co-activator. Expression of the coactivator PGC-1α drives the transcription of key gluconeogenic enzymes such as PEPCK and G6Pase in association with the transcription factor HNF4 and the forkhead family activator FoxO1 (Koo et al., 2005). In our study, we examine the transcription factors in nucleoprotein. BER significantly decreased the expression of PGC-1α, FOXO1 and HNF4α (Fig. 8B–D) and these effects were blocked by Compound C. Together, these results suggest that BER inhibits hepatic gluconeogenesis at least partly by activating AMPK and the downstream signaling pathway in HepG2 hepatocytes.
4. Discussion
BER is the major active ingredient of rhizome coptidis, a popular traditional Chinese herb used for the treatment of infection and inflammation. Many animal studies and clinical trials have proved that BER has significant hypoglycemic effect, even comparable to metformin. Although hypoglycemic effect of BER is so enticing, it has not yet been used clinically as an anti-diabetic drug, mainly because of its low bioavailability (<5%) (Maeng et al., 2002). We also observed its poor intestinal absorption in vivo and in vitro in our previous study (Lv et al., 2010). As a result, BER has to be administered repeatedly and at high doses (1500–2000 mg/d) when used in diabetic patients (Yin et al., 2008). Although high dose of BER decreases the blood glucose, it causes major gastrointestinal side-effects, which greatly limits its clinical application. So enhancing the bioavailability of BER will not only increase its hypoglycemic effect, but also reduce its gastrointestinal side effects. Until recently, there is no multicenter, well controlled, long-term clinical trial to evaluate the efficacy of BER in the treatment of diabetes, due to its low bioavailability. There were a few reports focusing on the development of new dosage forms of BER to increase its bioavailability. In our previous study, we increased the bioavailability of BER by using the intestinal absorption enhancer, sodium caprate. The result showed that sodium caprate significantly improved the intestinal absorption of BER in vivo and in vitro, and its bioavailability was increased 1.5- to 2.3-fold without any significant damage to the intestinal mucosa (Lv et al., 2010). In this investigation, we first studied the effect of BER coadministered with sodium caprate on glucose homeostasis and hepatic gluconeogenesis pathway to assess if sodium caprate could enhance the effect of BER on these parameters. The present study showed that BER reduced hyperlipidemia and hyperglycemia in diabetic rats, which were consistent with other studies (Lee et al., 2006; Leng et al., 2004). FBG was decreased and glucose tolerance was improved by BER treatment in rats with type 2 diabetes induced by high-fat diet and low dose STZ. No significant influence on FBG level was observed in sodium caprate treated group, indicating that sodium caprate could not directly depress blood glucose in diabetic rat. But the therapeutic effects of BER were obviously improved when combined with sodium caprate. It showed that the ability of sodium caprate to enhance the efficacy of BER was most probably by improving its bioavailability and increasing its blood level.
At present, the mechanism of BER in improving the diabetic phenotype is still unclear. It has been suggested that AMPK signaling pathways are involved in anti-diabetic effects of BER. AMPK activation has been link to the effect BER to mediate the metabolic activities (Brusq et al., 2006; Cheng et al., 2006; Lee et al., 2006; Zhou et al., 2007). Activation of AMPK-P38 pathway by BER was proposed to be responsible for induction of glucose uptake in muscle cells (Brusq et al., 2006; Cheng et al., 2006; Lee et al., 2006). Chen and colleagues reported that BER mimics insulin action by increasing glucose uptake ability by 3T3-L1 adipocytes and L6 myocytes in an insulin-independent manner, inhibiting phosphatase activity of protein tyrosine phosphatase 1B (PTP1B), and increasing phosphorylation of IR, IRS-1 and Akt (Chen et al., 2010). Liu et al. reported that BER exhibited synergistic effect on insulin-induced glucose uptake and GLUT4 translocation in insulin- resistant state accompanied by enhancement in insulin-induced PKCzeta and PKB activity. The key mechanism was related to the inhibition of mTOR and activation of AMPK by BER, which attenuated serine-phosphorylation of IRS-1 (Liu et al., 2010a,b). BER also stimulated glucose uptake and increased the expression of GLUT1 via AMPK in 3T3-L1 adipocytes (Kim et al., 2007). Further, BER has hypolipidemic effects and could inhibit cholesterol and triglyceride synthesis, which occurs when AMPK signaling pathways are activated following the inhibition of ACC in HepG2 cells (Brusq et al., 2006). These results indicate that the effect of BER in diabetes is associated with the activation of AMPK via the modulation of downstream molecules. Our present results showed that BER significantly inhibited the two key enzymes PEPCK and G6Pase protein level and RNA expression in diabetic rats, while the inhibitory effect of the combination of BER with sodium caprate was more noticeable. The results illustrate that BER not only promotes glucose uptake (Kim et al., 2007; Liu et al., 2010a,b), but also inhibits glucose production in liver.
Many anti-diabetic drugs regulated blood glucose by transcriptional inhibition of the gluconeogenic program, such as metformin. The glucose-lowering effect of metformin has been mainly attributed to its ability to suppress hepatic gluconeogenesis through the AMPK signaling pathway. Recent results obtained using various animal models of type 2 diabetes confirm the physiological importance of hepatic AMPK in glucose homeostasis (Viollet et al., 2009). The AMPK pathway has been reported to regulate the phosphorylation and nuclear exclusion of CREB-regulated transcription coactivator 2 (TORC2) (Shaw et al., 2005). In response to fasting stimuli, TORC2 is dephosphorylated and transported from cytoplasm to the nucleus, where it enhances the transcriptional activation of the gluconeogenic genes. This transcriptional coactivator mediates CREB-dependent transcription of PPARγ coactivator-1α (PGC-1α). Expression of the coactivator PGC-1α further induces the transcription of key gluconeogenic enzymes such as PEPCK and G6Pase in association with the factors HNF4α and FOXO1. AMPK could phosphorylate TORC2 and sequestered it in the cytoplasm to inhibit gluconeogenic program. Metformin has been identified as an inhibitor of hepatic glucose output by activating AMPK (Koo et al., 2005).
It is intriguing to compare the metabolic effects of BER with another insulin-sensitizing agent metformin. Based on the reports, BER and metformin share a number of common features. Metformin causes weight reduction, improves insulin sensitivity, and lowers lipid in both human and animal models of insulin resistance (Saenz et al., 2005). Moreover, BER and metformin have a direct effect on AMPK activity in a variety of tissues, such as liver, adipose and skeletal muscle. As the present results illustrate that BER was able to induce activation of AMPK, block the translocation of TORC2 from cytoplasm to nuclear and inhibit the downstream protein level of PGC1α in liver of diabetic rats, it hinted that BER also inhibited the hepatic gluconeogenesis pathway through the activation of AMPK. The mechanism was further verified in HepG2 cells. We firstly examined the effect of BER (10 μmol/l) on glucose output in HepG2 hepatocytes. As shown in Fig. 5, the hepatic glucose production was suppressed by BER and by an AMPK activator, AICAR, in HepG2 hepatocytes and AMPK inhibitor, Compound C, attenuated the inhibitory effect of BER on gluconeogenesis. We further examined the protein expression, and BER significantly increased phosphorylation of AMPK, even higher than the AMPK activator AICAR. Interestingly, BER also down-regulated the key gluconeogenic enzymes PEPCK, which was blocked by AMPK inhibitor, Compound C. BER could significantly decrease the expression of transcription factors FOXO1, HNF4α and PGC-1α in nucleoprotein, and these effects could also be blocked by Compound C. These results suggest that BER inhibits hepatic gluconeogenesis at least partly by activating AMPK and the downstream signaling pathway in HepG2 cells (see Supplemental data). However, Compound C could not completely block the inhibitory effect of BER on the PEPCK, indicating that other pathways may also contribute to the beneficial effects of BER.
5. Conclusion
BER, a traditional oriental herbal medicine, reduces body weight, FBG and suppresses hepatic gluconeogenesis in animal models of diabetes and HepG2 cells, at least in part, by activating AMPK. Collectively, these findings indicate that sodium caprate is an effective vehicle for enhancing bioavailability and thus substantially reducing the oral dose required for beneficial metabolic effects of BER on parameters seen in rat model of type 2 diabetes. New preparation including BER and sodium caprate represents an attractive potential therapy for the treatment of type 2 diabetes and other components of the metabolic syndrome.
Supplementary Material
Acknowledgments
We thank Dr. Kabirullah Lutfy for the critical reading of this manuscript in the Department of Pharmacology of Western University of Health Sciences. This work was supported by National Natural Science Foundation of China (81170745) and in part by funding from NIH Grants SC1DK087655 (to Y. Liu).
Abbreviations
- AMPK
AMP-activated protein kinase
- BER
berberine
- DM
diabetes mellitus
- FBG
fasting blood glucose
- G6Pase
glucose-6-phosphatase
- ISI
insulin sensitivity index
- OGTT
oral glucose tolerance test
- PEPCK
phosphoenolpyruvate carboxykinase
- PGC-1
peroxisome proliferator-activated receptor-γ coactivator
- SC
sodium caprate
- STZ
streptozotocin
- TG
triglyeride
- TC
total cholesterol
Appendix A. Supplementary data
Supplementary data associated with this article can be found, in the online version, at http://dx.doi.org/10.1016/j.mce.2012.08.006.
References
- Brusq JM, Ancellin N, Grondin P, Guillard R, Martin S, Saintillan Y, Issandou M. Inhibition of lipid synthesis through activation of AMP kinase: an additional mechanism for the hypolipidemic effects of berberine. J Lipid Res. 2006;47:1281–1288. doi: 10.1194/jlr.M600020-JLR200. [DOI] [PubMed] [Google Scholar]
- Chen C, Zhang Y, Huang C. Berberine inhibits PTP1B activity and mimics insulin action. Biochem Biophys Res Commun. 2010;397:543–547. doi: 10.1016/j.bbrc.2010.05.153. [DOI] [PubMed] [Google Scholar]
- Cheng Z, Pang T, Gu M, Gao AH, Xie CM, Li JY, Nan FJ, Li J. Berberine-stimulated glucose uptake in L6 myotubes involves both AMPK and p38 MAPK. Biochim Biophys Acta. 2006;1760:1682–1689. doi: 10.1016/j.bbagen.2006.09.007. [DOI] [PubMed] [Google Scholar]
- Dentin R, Liu Y, Koo SH, Hedrick S, Vargas T, Heredia J, Yates J, III, Montminy M. Insulin modulates gluconeogenesis by inhibition of the coactivator TORC2. Nature. 2007;449:366–369. doi: 10.1038/nature06128. [DOI] [PubMed] [Google Scholar]
- Kim SH, Shin EJ, Kim ED, Bayaraa T, Frost SC, Hyun CK. Berberine activates GLUT1-mediated glucose uptake in 3T3-L1 adipocytes. Biol Pharm Bull. 2007;30:2120–2125. doi: 10.1248/bpb.30.2120. [DOI] [PubMed] [Google Scholar]
- Koo SH, Flechner L, Qi L, Zhang X, Screaton RA, Jeffries S, Hedrick S, Xu W, Boussouar F, Brindle P, Takemori H, Montminy M. The CREB coactivator TORC2 is a key regulator of fasting glucose metabolism. Nature. 2005;437:1109–1111. doi: 10.1038/nature03967. [DOI] [PubMed] [Google Scholar]
- Lee YS, Kim WS, Kim KH, Yoon MJ, Cho HJ, Shen Y, Ye JM, Lee CH, Oh WK, Kim CT, Hohnen-Behrens C, Gosby A, Kraegen EW, James DE, Kim JB. Berberine, a natural plant product, activates AMP-activated protein kinase with beneficial metabolic effects in diabetic and insulin-resistant states. Diabetes. 2006;55:2256–2264. doi: 10.2337/db06-0006. [DOI] [PubMed] [Google Scholar]
- Leng SH, Lu FE, Xu LJ. Therapeutic effects of berberine in impaired glucose tolerance rats and its influence on insulin secretion. Acta Pharmacol Sin. 2004;25:496–502. [PubMed] [Google Scholar]
- Liu LZ, Cheung SC, Lan LL, Ho SK, Chan JC, Tong PC. The pivotal role of protein kinase C zeta (PKCzeta) in insulin- and AMP-activated protein kinase (AMPK)-mediated glucose uptake in muscle cells. Cell Signal. 2010a;22:1513–1522. doi: 10.1016/j.cellsig.2010.05.020. [DOI] [PubMed] [Google Scholar]
- Liu LZ, Cheung SC, Lan LL, Ho SK, Xu HX, Chan JC, Tong PC. Berberine modulates insulin signaling transduction in insulin-resistant cells. Mol Cell Endocrinol. 2010b;317:148–153. doi: 10.1016/j.mce.2009.12.027. [DOI] [PubMed] [Google Scholar]
- Lv XY, Li J, Zhang M, Wang CM, Fan Z, Wang CY, Chen L. Enhancement of sodium caprate on intestine absorption and antidiabetic action of berberine. AAPS PharmSciTech. 2010;11:372–382. doi: 10.1208/s12249-010-9386-z. [DOI] [PMC free article] [PubMed] [Google Scholar]
- Maeng HJ, Yoo HJ, Kim IW, Song IS, Chung SJ, Shim CK. P-glycoprotein- mediated transport of berberine across Caco-2 cell monolayers. J Pharm Sci. 2002;91:2614–2621. doi: 10.1002/jps.10268. [DOI] [PubMed] [Google Scholar]
- Roglic G, Green A, Sicree R, King H. Global prevalence of diabetes: estimates for the year 2000 and projections for 2030. Diabetes Care. 2004;27 (5):1047–1053. doi: 10.2337/diacare.27.5.1047. [DOI] [PubMed] [Google Scholar]
- Saenz CA, Fernandez EI, Mataix SA, Ausejo SM, Roque M, Moher D. Metformin for type-2 diabetes mellitus. Systematic review and meta-analysis. Aten Primaria. 2005;36:183–191. doi: 10.1157/13078602. [DOI] [PMC free article] [PubMed] [Google Scholar]
- Shaw RJ, Lamia KA, Vasquez D, Koo SH, Bardeesy N, Depinho RA, Montminy M, Cantley LC. The kinase LKB1 mediates glucose homeostasis in liver and therapeutic effects of metformin. Science. 2005;310:1642–1646. doi: 10.1126/science.1120781. [DOI] [PMC free article] [PubMed] [Google Scholar]
- Viollet B, Guigas B, Leclerc J, Hebrard S, Lantier L, Mounier R, Andreelli F, Foretz M. AMP-activated protein kinase in the regulation of hepatic energy metabolism: from physiology to therapeutic perspectives. Acta Physiol (Oxf) 2009;196:81–98. doi: 10.1111/j.1748-1716.2009.01970.x. [DOI] [PMC free article] [PubMed] [Google Scholar]
- Wang C, Li J, Lv X, Zhang M, Song Y, Chen L, Liu Y. Ameliorative effect of berberine on endothelial dysfunction in diabetic rats induced by high-fat diet and streptozotocin. Eur J Pharmacol. 2009;620:131–137. doi: 10.1016/j.ejphar.2009.07.027. [DOI] [PubMed] [Google Scholar]
- Wang Y, Campbell T, Perry B, Beaurepaire C, Qin L. Hypoglycemic and insulin-sensitizing effects of berberine in high-fat diet- and streptozotocin-induced diabetic rats. Metabolism. 2010;60 (2):298–305. doi: 10.1016/j.metabol.2010.02.005. [DOI] [PubMed] [Google Scholar]
- Yang LX, Liu TH, Huang ZT, Li JE, Wu LL. Research progress on the mechanism of single-Chinese medicinal herbs in treating diabetes mellitus. Chin J Integr Med. 2011;17 (3):235–240. doi: 10.1007/s11655-010-0674-6. [DOI] [PubMed] [Google Scholar]
- Yin J, Xing H, Ye J. Efficacy of berberine in patients with type 2 diabetes mellitus. Metabolism. 2008;57:712–717. doi: 10.1016/j.metabol.2008.01.013. [DOI] [PMC free article] [PubMed] [Google Scholar]
- Zeng XH, Zeng XJ, Li YY. Efficacy and safety of berberine for congestive heart failure secondary to ischemic or idiopathic dilated cardiomyopathy. Am J Cardiol. 2003;92:173–176. doi: 10.1016/s0002-9149(03)00533-2. [DOI] [PubMed] [Google Scholar]
- Zhang M, Lv XY, Li J, Xu ZG, Chen L. The characterization of high-fat diet and multiple low-dose streptozotocin induced type 2 diabetes rat model. Exp Diabetes Res. 2008;2008:704045. doi: 10.1155/2008/704045. Epub; 2009 January 4. 704045. [DOI] [PMC free article] [PubMed] [Google Scholar]
- Zhang M, Lv XY, Li J, Xu ZG, Chen L. Alteration of 11beta-hydroxysteroid dehydrogenase type 1 in skeletal muscle in a rat model of type 2 diabetes. Mol Cell Biochem. 2009;324:147–155. doi: 10.1007/s11010-008-9993-0. [DOI] [PubMed] [Google Scholar]
- Zhang MF, Shen YQ. Antidiarrheal and anti-inflammatory effects of berberine. Zhongguo Yaoli Xuebao. 1989;10:174–176. [PubMed] [Google Scholar]
- Zhou L, Yang Y, Wang X, Liu S, Shang W, Yuan G, Li F, Tang J, Chen M, Chen J. Berberine stimulates glucose transport through a mechanism distinct from insulin. Metabolism. 2007;56:405–412. doi: 10.1016/j.metabol.2006.10.025. [DOI] [PubMed] [Google Scholar]
Associated Data
This section collects any data citations, data availability statements, or supplementary materials included in this article.