Abstract
Purpose: To measure and investigate the improvement of microcalcification (MC) visibility in cone beam breast CT with a high pitch (75 μm), thick (500 μm) scintillator CMOS/CsI flat panel detector (Dexela 2923, Perkin Elmer).
Methods: Aluminum wires and calcium carbonate grains of various sizes were embedded in a paraffin cylinder to simulate imaging of calcifications in a breast. Phantoms were imaged with a benchtop experimental cone beam CT system at various exposure levels. In addition to the Dexela detector, a high pitch (50 μm), thin (150 μm) scintillator CMOS/CsI flat panel detector (C7921CA-09, Hamamatsu Corporation, Hamamatsu City, Japan) and a widely used low pitch (194 μm), thick (600 μm) scintillator aSi/CsI flat panel detector (PaxScan 4030CB, Varian Medical Systems) were also used in scanning for comparison. The images were independently reviewed by six readers (imaging physicists). The MC visibility was quantified as the fraction of visible MCs and measured as a function of the estimated mean glandular dose (MGD) level for various MC sizes and detectors. The modulation transfer functions (MTFs) and detective quantum efficiencies (DQEs) were also measured and compared for the three detectors used.
Results: The authors have demonstrated that the use of a high pitch (75 μm) CMOS detector coupled with a thick (500 μm) CsI scintillator helped make the smaller 150–160, 160–180, and 180–200 μm MC groups more visible at MGDs up to 10.8, 9, and 10.8 mGy, respectively. It also made the larger 200–212 and 212–224 μm MC groups more visible at MGDs up to 7.2 mGy. No performance improvement was observed for 224–250 μm or larger size groups. With the higher spatial resolution of the Dexela detector based system, the apparent dimensions and shapes of MCs were more accurately rendered. The results show that with the aforementioned detector, a 73% visibility could be achieved in imaging 160–180 μm MCs as compared to 28% visibility achieved by the low pitch (194 μm) aSi/CsI flat panel detector. The measurements confirm that the Hamamatsu detector has the highest MTF, followed by the Dexel detector, and then the Varian detector. However, the Dexela detector, with its thick (500 μm) CsI scintillator and low noise level, has the highest DQE at all frequencies, followed by the Varian detector, and then the Hamamatsu detector. The findings on the MC visibility correlated well with the differences in MTFs, noise power spectra, and DQEs measured for these three detectors.
Conclusions: The authors have demonstrated that the use of the CMOS type Dexela detector with its high pitch (75 μm) and thick (500 μm) CsI scintillator could help improve the MC visibility. However, the improvement depended on the exposure level and the MC size. For imaging larger MCs or scanning at high exposure levels, there was little advantage in using the Dexela detector as compared to the aSi type Varian detector. These findings correlate well with the higher measured DQEs of the Dexela detector, especially at higher frequencies.
Keywords: CBCT, high resolution detector, microcalcification visibility, dose saving, breast imaging, MTF, NPS, DQE
INTRODUCTION
Cone beam CT (CBCT) has been used in diagnosis, surgical planning, angiography, radiotherapy guidance, image guided intervention, and dentomaxillofacial imaging.1, 2, 3, 4, 5, 6, 7, 8, 9, 10, 11, 12, 13, 14 The advantages of CBCT include a higher contrast sensitivity as compared to projection imaging and nearly isotropic high spatial resolution, which have led to the development and investigation of dedicated pendant geometry breast CT technique.12, 13, 14, 15, 16, 17, 18 Although it has been shown that breast CT has many distinctive advantages, it also has some drawbacks with the two major concerns, poor detection of microcalcifications (MCs) and potentially high radiation dose to the breast. Detection and visualization of MCs play an important role in the screening and diagnosis of breast cancers. The presence of MCs in certain forms has been related to early stage breast cancers.19 Although an early simulation study indicated that MCs as small as 175–200 μm could be visible in flat panel-based breast CT when the mean glandular dose (MGD) is kept at an acceptable level, a later experimental study reported that the minimum detectable MC size was about 308 μm at the 75% visibility level under similar exposure conditions.18, 20, 21 Using a high resolution (48 μm pitch) CCD detector, we have demonstrated that MCs as small as 150 μm could be visualized at an elevated x-ray exposure level.22 However, it is essential to be able to improve the ability of the BCT system to image small MCs with MGDs as low as 6 mGy. In the past several years, large size CMOS detectors have become commercially available for medical x-ray imaging applications. Compared to amorphous silicon flat-panel detectors, CMOS detectors have much smaller pitch size and lower readout noise and lend themselves to high resolution imaging. It has been generally recognized that a high pitch (75 μm or smaller) detector needs be used with a thin (150 μm or thinner) scintillator to achieve optimal modulation transfer functions (MTFs). However, the use of a thin (150 μm or thinner) scintillator would result in inefficient x-ray absorption and poorer detective quantum efficiency (DQE) thus requiring higher exposures to be used. This is unacceptable in breast CT as it would increase the MGD to an unacceptable level. An approach often ignored is to use a high pitch detector in conjunction with a thick scintillator to preserve the quantum detection efficiency. Typical of many digital x-ray detectors, the presampling MTF values remain high at the Nyquist frequency due to the need to limit the matrix size and contain the cost of fabrication. This leads to the improper recording of image information at frequencies above the Nyquist frequency. Such information may be captured by using a high pitch detector to extend the MTF to a higher Nyquist frequency while using a thick scintillator to preserve the quantum detection efficiency. In this study, we explored the potential benefit in using a high pitch (75 μm), thick (500 μm) scintillator CMOS flat panel detector to improve the MC visibility with an acceptable MGD. MCs of various sizes were imaged with three detectors of different characteristics: low pitch (194 μm) with thick (600 μm) scintillator, high pitch (75 μm) with thick (500 μm) scintillator, and high pitch (50 μm) with thin (150 μm) scintillator. An observer study was conducted to evaluate and compare the MC visibilities for various combinations of the detector, MC size range, and MGD. The MTF, noise power spectrum (NPS), and DQE were also measured and compared to account for the reading results.
MATERIALS AND METHODS
Experimental setup
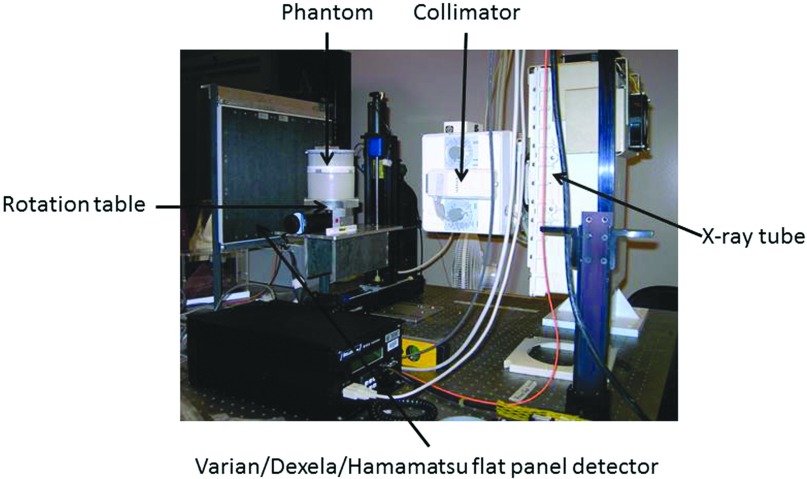
The imaging experiments were conducted on a benchtop experimental CBCT system shown in Fig. 1. It consisted of a high power x-ray generator (CPI Indico 100SP, Communications Power Industries, ON, Canada), an x-ray tube (G-1593, Varian Medical System, Salt Lake City, UT) with a nominal focal spot size of 0.3 or 1.2 mm and a stepping motor-driven rotation table (B4872TS, Velmex, Inc., Bloomfield, NY) to hold and rotate phantom during a CBCT scan. Three flat panel detectors were investigated in this study: Varian PaxScan 4030CB (Varian Medical Systems, Salt Lake City, UT), Dexela 2923 (Perkin Elmer, Waltham, MA), and Hamamatsu C7921CA-09 (Hamamatsu Corporation, Hamamatsu City, Japan). The Varian PaxScan 4030CB is a 14-bit amorphous silicon/cesium iodide (aSi/CsI)-based indirect conversion flat panel detector with a pixel size of 194 μm and a scintillator thickness of 600 μm. The Dexela 2923 is a 14-bit CMOS detector with a pixel size of 75 μm. It may be coupled to a 150 or 500 μm thick CsI scintillator plate (Hamamatsu Corporation). In this study, the latter was used to optimize x-ray absorption. The Hamamatsu C7921CA-09 detector (Hamamatsu Corporation) is a 12-bit CMOS detector with a pixel size of 50 μm coupled to a 150 μm thick CsI scintillator.
Figure 1.
Benchtop experimental CBCT system.
The x-ray source-to-isocenter distance (SCD) was set at 88 cm in all experiments. The source-to-image distance (SID) was varied to optimize the spatial resolution for image acquisition: 135 cm for the Varian detector, 108 cm for the Dexela detector, and 110 cm for Hamamatsu detector. All experiments were performed at 80 kVp with pulsed x-ray exposures. The characteristics of the detectors and the experimental conditions are listed in Table 1.
Table 1.
Detector characteristics and experimental conditions.
| Manufacturer | Varian | Dexela | Hamamatsu |
|---|---|---|---|
| Detector model | 4030CB | 2923 | C7921 |
| Detector type | aSi/CsI | CMOS/CsI | CMOS/CsI |
| Scintillator thickness (μm) | 600 | 500 | 150 |
| Matrix size | 2048 × 1536 | 3888 × 3072 | 1032 × 1032 |
| Data depth (bit) | 14 | 14 | 12 |
| Intrinsic pixel size (μm) | 194 | 75 | 50 |
| Active image area (cm2) | 40 × 30 | 29 × 23 | 5.28 × 5.28 |
| Frame rate at full resolution (fps) | 7.5 | 26 | 4 |
| SCD (cm) | 88 | 88 | 88 |
| SID (cm) | 135 | 108 | 110 |
| Magnification (SID/SCD) | 1.53 | 1.23 | 1.25 |
| Nominal focal spot size (mm) | 0.3 | 0.3 | 0.3 |
| kVp | 80 | 80 | 80 |
| Voxel size (μm) | 127 | 61 | 40 |
Phantoms
Paraffin, which is similar to adipose tissue in x-ray attenuation properties, was used as the background material to construct the breast phantoms. Its easy to mold characteristic allows the aluminum (Al) wires or calcium carbonate grains to be embedded to simulate imaging of calcifications in a breast. Two Al wire phantoms were constructed and imaged. One consisted of a 13 cm diameter, 8 cm thick paraffin cylinder embedded with 12 aluminum wires of various diameters (51, 76, 102, 127, 152, 178, 203, 229, 254, 279, 305, and 356 μm in diameter), all oriented parallel to each other and evenly spaced along an 8 cm diameter circle centered to the central axis of the phantom. Sections of the Al wires protruded into the air to produce high contrast in CBCT scan and allow the effects of detector resolution to be studied independently of the noise level in the images. A smaller Al wire phantom, similar in design, was constructed for scans with the small field of view Hamamatsu detector. It consisted of a 1.5 cm diameter, 6 cm high, paraffin rod embedded with eight aluminum wires (51, 76, 102, 127, 152, 178, 203, and 229 μm in diameter). This phantom, referred to as the small Al wire phantom here, also has sections of the wires protruding into the air, allowing the high contrast resolution to be studied with the Hamamatsu detector. The MC phantom consisted of a 13 cm diameter, 4 cm thick paraffin cylinder to simulate a 100% adipose breast. A cylindrical hole was opened at the center of the phantom into which a 1.5 cm diameter paraffin rod containing simulated MCs may be inserted for imaging. Calcium carbonate grains, divided into various size groups, ranging from 125 to 140, 140 to 150, 150 to 160, 160 to 180, 180 to 200, 200 to 212, 212 to 224, and 224 to 250 μm in size, were used to simulate the MCs. Groups of 25 similar size MCs were arranged into 5 × 5 clusters and embedded into the cylindrical inserts. Figure 2 is a diagram of the phantoms showing the positions of the aluminum wires and the simulated MCs within the phantoms. Both the Al wire and MC inserts were used to evaluate the ability of the CBCT techniques, based on three different detectors, to image small calcifications. The small Al wire phantom was used only with the Hamamatsu detector due to its limited field of view.
Figure 2.
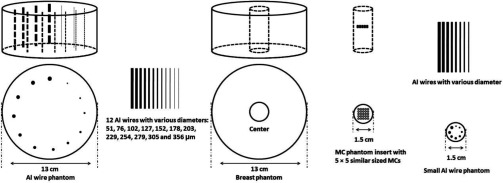
Schematic drawings for breast phantom with Al wires, breast phantom with MC phantom insert, and small Al wire phantom.
Image acquisition and reconstruction
Projection images were acquired at 80 kV. Optimization and selection of the x-ray spectrum for breast CT has been previously investigated with various conclusions.15, 18, 23, 24, 25, 26 Some of these studies suggested that lower kVs would result in better performance in optimizing the calcification contrast.24, 26 Our own study, based on direct evaluation of MC visibility, did not find any statistically significant improvement when using 60 kV x-rays instead of 80 kV x-rays.18 Since a regular x-ray tube designed for special procedures or CT was used in this study, we chose to acquire images at 80 kV based on the practical consideration that the x-ray window of the tube would be too absorptive at low kVs for the pulsed fluoro mode used. It should also be noted that the main goal of this study is to compare the three detectors for the visibility of MCs in BCT under identical imaging conditions. Since all three detectors use the same scintillation material (CsI), the use of 80 kV x-rays should not favor or disfavor any of the detectors. For image acquisition, the Varian and Dexela detectors were used to scan both the Al wire phantoms and the MC phantoms. Due to the limited field-of-view, the Hamamatsu detector was used to scan the smaller wire phantom and the central cylindrical portion of the MC phantom only. During each scan projection images were acquired for 300 evenly spaced views over 360°. To estimate the MGDs associated with each scan, the isocenter dose was measured by placing an optically stimulated light (OSL) dosimeter (microStar, Landauer, Inc., Glenwood, IL) in the central hole of the phantom. The dosimeter was calibrated by comparing the OSL readings against free air kerma measurements using a pencil probe ion chamber (10 × 5–6, Radcal Co., Monrovia, CA) placed at the isocenter with the phantom removed. The OSL point dose measurements were converted into the MGD values using conversion ratios estimated from Monte Carlo simulation using the DOSXYZnrc package.27 The scans were performed at various exposure levels corresponding to an MGD of 1.8–46 mGys.
For image reconstruction, the Feldkamp (FDK) filtered back projection algorithm was used.28 Because filters with roll-off at high frequencies tend to smooth the reconstructed images and reduce their spatial resolution, a simple ramp filter was used for reconstruction. This helped minimize the smoothing effect and optimize the spatial resolution for imaging small MCs, especially in retaining their apparent size and shape. Due to the limited field-of-view, projection images of the MC phantom acquired with the Hamamatsu detector were used to reconstruct the central cylindrical portion of the MC phantom only. Due to the circular symmetry of the phantom, the truncation of views resulted in a largely uniform bias of the CT numbers. Since this bias may be compensated for by adjusting the level for digital image display, it had little effect on the visibility of MCs in our perception study.
Observer study
An observer study was conducted to evaluate and compare the MC visibilities for various combinations of detector, MC size range, and MGD level. For each combination, 200 slices of 400 × 400 images were extracted from the original reconstructed images for a total of 129 image sets. These image sets were displayed in the coronal (posterior to anterior) view in random order with the OsiriX software package on a 30 in. 2560 × 1600 Apple LCD monitor. A total of six observers participated in the study. The observers were asked to search for and count the visible MCs in each image set. Due to imperfect alignment during fabrication, the MCs are usually spread over several consecutive slices. Observers were allowed to step through the slices back and forth, adjust the window and level settings, and magnify the digital display for optimized visualization. The numbers of visible MCs were recorded and averaged over all readers for each individual scan. The MC visibility was quantified as the percentages of visible MCs averaged over the six different viewers. The MC visibility was plotted as functions of the square root of MGD for various MC sizes and detectors.
MTF, NPS, and DQE measurements
The goal of this study is to measure and investigate how the MC visibility in the reconstructed CBCT images varies with the spatial resolution quality and the efficiency of the detectors, which are commonly characterized by the MTF and the DQE, respectively. To measure MTF, an x-ray slit camera (model 07-624, Nuclear Associates, Carle Place, NY) was imaged at 80 kV to measure the line spread functions (LSFs) which were then Fourier transformed to determine the MTF.29, 30 The slit made of steel is 10 μm wide and 8 mm long. The camera was placed against the detector near its center and tilted slightly (by ∼2°) with respect to vertical or horizontal lines to allow consecutive line profiles to be combined into one sampled with a much smaller pixel size. A lead collimator was used to block incident x-rays outside the slit camera to minimize scattered x-rays.
The noise power spectrum (NPS) was measured at 80 kV for an MGD of 3 mGy for the phantom scanned. This corresponds to a total x-ray air kerma of 2.89 mGy at 80 kV at the rotation center. Dividing it by 300 frames and correcting for the inverse square law, the detector input air kerma was estimated to be 4.1, 6.4, and 6.2 μGy/frame for Varian, Dexela, and Hamamatsu detectors, respectively. These exposures were made for the NPS measurement without any x-ray attenuation. Taking into account x-ray attenuation by the breast phantom, they correspond to detector exposures at about 5.5 cm from the central axis of the phantom for scans with an MGD of 12 mGy. For pixels closer to the central axis, the detector exposure could be even lower (with an air kerma per frame as low as 0.4 μGy) due to increased x-ray attenuation.
The NPS was measured according to the International Electrotechnical Commission (IEC) 62220-1 standard.31 144 half-overlapped ROIs were selected (256 × 256 pixels in each) in the central part of the image for the measurement. Following trend removal suggested by the IEC 62220-1 standard, two-dimensional Fourier transform was applied to the image signal profile and then squared to compute the two-dimensional NPS. One-dimensional NPS, horizontal or vertical, was computed by averaging the two-dimensional NPS over eight lines on either side of the horizontal axis or vertical axis (four on each side). The NPS results were normalized by the mean signal squared to obtain normalized NPSs (NNPSs) to eliminate the effects of signal levels.
The DQE measures the ability and characteristics of the detector to preserve the signal-to-noise ratio (SNR) of the x-ray information at the detector input surface. The measurement of the DQE for a digital x-ray image detector has been standardized in IEC 62220-1 and DQE can be calculated as31
| (1) |
where Wout( f ) is the NPS at the output of the detector, calculated using NNPS. Win( f ) is the NPS of the radiation field at the detector input surface and calculated as
| (2) |
where Q is photon fluence, Ka is air kerma, E is the x-ray photon energy, Φ(E)/Ka is the spectral x-ray fluence per unit air kerma, and SNRin2 is the squared signal-to-noise ratio per unit air kerma. The photon fluence spectrum, Φ(E), in computing Win(f) was estimated for 80 kV x-rays at 75 cm air, generated by using a tungsten target with 12° anode angle and a 2.5 mm Al filter, with a 0.5 kV increment, using a previously published software, SRS-78.32
RESULTS AND DISCUSSION
Visibility of Al wires
Figure 3 shows the reconstructed images of Al wires in air obtained with Varian, Dexela, and Hamamatsu detectors. While all or almost all Al wires were visible in all images, the shape and dimension of the wire cross-sections were better preserved in images obtained with the higher pitch Dexela and Hamamatsu detectors, demonstrating the advantage of their superior spatial resolution quality. Notice that high exposures have been used in obtaining these images to minimize the effect of image noise on the visibility of the wires. The noncircular appearance of the wire cross-sections in the Varian images is mainly due to pixelization with a voxel size of 127 μm. Due to the smaller (61 and 40 μm) voxel sizes with the Dexela and Hamamatsu detectors, the shape of the wire cross-sections were well preserved. However, sections of the wires may not be perfectly straight and may intersect the image plane at an angle other than 90°. Figure 4 shows the reconstructed images of Al wires embedded in the breast (paraffin) phantom at various MGD levels for Varian, Dexela, and Hamamatsu detectors. With an MGD of 3.6 and 7.2 mGy, 152 and 127 μm Al wires could be resolved in the images obtained with the Varian detector. In the images obtained with the Dexela detector, nearly all Al wires could be resolved with an MGD as low as 1.8 mGy.
Figure 3.

Reconstructed images of Al wires in air obtained with Varian, Dexela, and Hamamatsu detectors.
Figure 4.
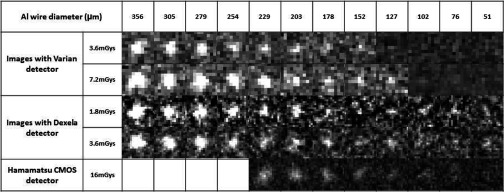
Reconstructed images of Al wires in paraffin obtained with Varian, Dexela, and Hamamatsu detectors.
Visibility of MCs
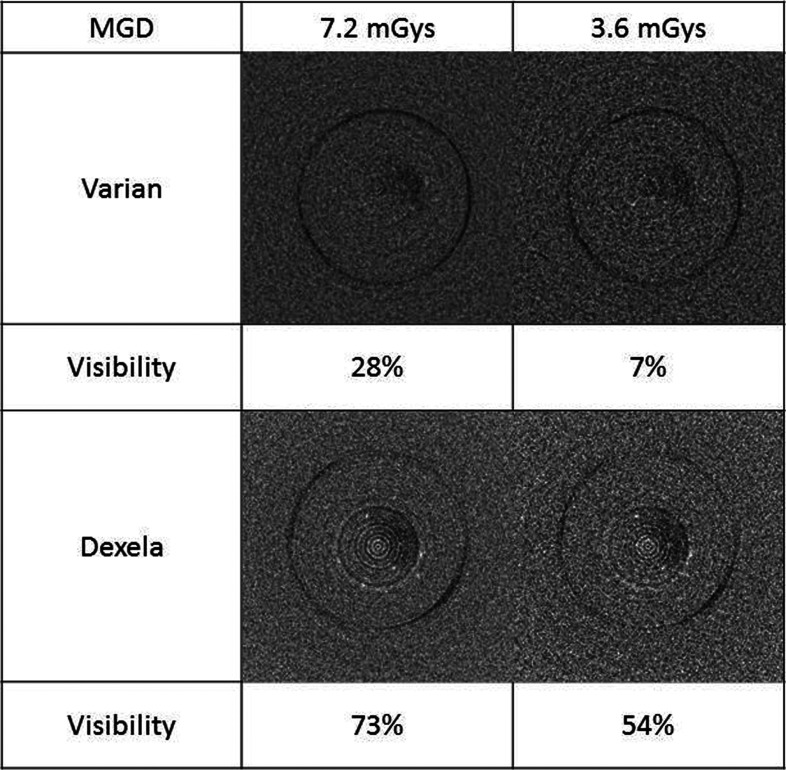
Figure 5 shows the reconstructed images of 160–180 μm MCs in the breast (paraffin) phantom obtained with the Varian and Dexela detectors at two different exposure levels corresponding to an MGD of 3.6 and 7.2 mGy. The visibility of MCs was 7% and 28% in the Varian image and 54% and 73% in the Dexela image for 3.6 and 7.2 mGy, respectively. With either MGD, the visibility of MCs in the Dexela images was superior to that in the Varian images. Not shown in Fig. 5 are the Hamamatsu images, in which none of the 160–180 μm MCs were visible. To make them visible, a much higher exposure level would be required, making it impractical for clinical use.
Figure 5.
Reconstructed images of 160–180 μm MCs embedded in breast phantom (paraffin) obtained with Varian and Dexela detectors.
In Fig. 6, the MC visibility was quantified as the percentage of visible MCs and plotted as a function of the square root of the MGD for Varian and Dexela detector and various MC sizes. The data were fitted to a modified Boltzmann function as follows:
| (3) |
where x and y are the square root of the MGD in mGys and the visibility, respectively; x0 and dx determine the mid MGD value and the slope for the fast changing part of the curve, respectively; y is forced to increase with the MGD from 0 to 1 with the rate of change approaching zero at very low or very high MGDs. For each different combination of the detector and MC size group, the visibility increases with the MGD over a range of MGDs with the mid MGD value of the range and the rate of increase determined by the fitted parameters, x0 and dx, respectively.
Figure 6.
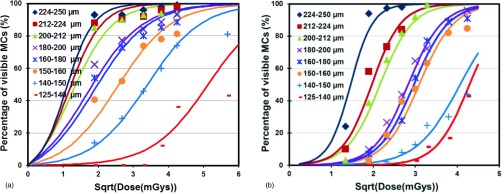
Visibility of MCs versus squire root of MGD in images obtained with (a) Dexela detector and (b) Varian detector.
The MC visibility is plotted as a function of the square root of the MGD for all three detectors for 200–212 μm MCs in Fig. 7a and for 150–160 μm MCs in Fig. 7b. The plots show that for MGDs of up to 7.2 and 11 mGys in Figs. 7a, 7b, respectively, the MC visibilities for the Dexela detector are highest, followed by those for the Varian detector and then those for the Hamamatsu CMOS detectors. For higher MGDs, the visibilities for the Varian detector appear to be similar to or even better than those for the Dexela detector. However, these MGDs may be too high for clinical applications.
Figure 7.
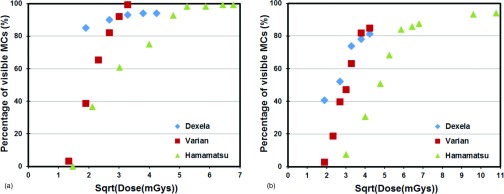
Comparison of three different detectors for visibility versus square root of MGD for (a) 200–212 and (b) 150–160 μm MCs.
Figure 6 indicates that 224 μm or larger MCs could be imaged with both Dexela and Varian detectors with a visibility of over 90% with a MGD of 3.6 mGy or higher. Thus, there is little advantage in using the Dexela detector for detecting these MCs. Figure 6 shows that the use of the Dexela detector helped make the 150–160, 160–180, and 180–200 μm MC groups more visible at MGDs up to 10.8, 9, and 10.8 mGy, respectively. It also made the 200–212 and 212–224 μm MC groups more visible at MGDs up to 7.2 mGy. Beyond the specified MGD level, the Varian detector performed similarly or even better for each specific size group. There was also no performance difference observed for the 224–250 μm or larger size groups. An additional benefit is that because the Dexela detector has a higher pitch (75 μm), it helped retain the dimension and shape of the MCs more accurately as shown by the Al wire images in Fig. 4. Figure 7 shows that the high pitch (50 μm) Hamamatsu detector could also be used to image the smaller MCs but only at substantially higher exposures corresponding to unacceptably higher MGDs to the breast. This agrees with our previously reported observations.22 The visibilities of the 200–212 μm MCs in the Varian images were lower than those in the Dexela images until the MGD exceeded 7.2 mGy. For the 150–160 μm MCs, the visibilities in the Varian images remained lower until the MGD exceeded 11 mGy. These observations seem to indicate that the advantage in using the Dexela detector was more significant at lower exposures and for imaging smaller MCs. This could be explained as a result of both the higher pitch (75 versus 194 μm for the Varian detector) and the lower electronic noises of the Dexela detector. The former may help reduce the partial pixel effect and help preserve the contrast of small MCs. The latter help minimize the degradation of image SNRs at lower exposure levels.
MTF, NPS, and DQE measurements
The measured MTFs in horizontal and vertical directions are plotted for all detectors in Fig. 8a. The plots show that the Hamamatsu detector has the highest MTF values followed by the Dexel detector and then the Varian detector. This is expected as the Hamamatsu detector employs the thinnest (150 μm) scintillator and smallest (50 μm) pixel size while the Varian detector employs a much thicker (600 μm) scintillator and a much larger (194 μm) pixel size. The Dexela detector employs a slightly thinner (500 μm) scintillator but a much smaller (75 μm) pixel size than the Varian detector. The MTF values of the Dexela detector are slightly lower than those of the Varian detector at frequencies below 1.3 cycles/mm but become increasingly higher as the frequency increases above 1.3 cycles/mm. One major advantage of the Dexela detector over the Varian detector is that there are significant MTF values beyond the Nyquist frequency of the Varian detector (2.58 cycles/mm). They range from ∼20% at 2.58 cycles/mm down to ∼3% at the Nyquist frequency at 6.7 cycles/mm. This enabled the Dexela detector to capture information over a wider frequency range thus resulting in significantly better visibility in imaging small MCs. The Dexela detector has been marketed for mammography or other high resolution applications with its CMOS chips coupled to a 150 μm thick CsI plate, thus resulting in very high MTF values. We have ordered and used the Dexela detector with a 500 μm thick CsI plate to preserve the efficiency of x-ray absorption at the expense of lower spatial resolution. Thus, our measured MTF values are lower than those from the manufacturer due to the thicker CsI plate used with our detector.
Figure 8.
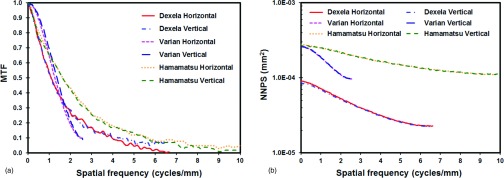
(a) Horizontal and vertical MTFs and (b) horizontal and vertical normalized NPSs measured with an air kerma of 4.1, 6.4, and 6.2 μGy/frame at the input of the Varian, Dexela, and Hamamatsu detectors, respectively.
Figure 8b shows the one-dimensional NNPSs in horizontal and vertical directions for the Varian, Dexela, and Hamamatsu detectors measured with the same exposure level at the rotation center. Based on the scanning geometries used and the inverse square law, the detector input air kermas were estimated to be 4.1, 6.4, and 6.2 μGy/frame for Varian, Dexela, and Hamamatsu detectors, respectively. The horizontal and vertical NNPS were found to be largely identical to each other for the same detector. All NNPSs decrease with the spatial frequency. However, the NNPSs for the two CMOS detectors decreased at a similar rate while the NNPS for the a-Si detector decreased at a faster rate. The Dexela detector was found to have the lowest NNPS. This result may be explained by the fact that each projection image was acquired at a low exposure level. As discussed in Sec. 2C, the air kerma used in our NNPS measurements corresponds to detector exposures at 5.5 cm from the central axis of the 13 cm diameter phantom (1 cm from the periphery of the phantom) for scans with an MGD of 12 mGy. For pixels closer to the central axis, the air kermas would be even lower due to increased x-ray attenuation. At such low exposure levels, the electronic noise would begin to dominate the quantum noise in determining the overall noise level. Thus, despite the slightly thinner CsI scintillator of the Dexela detector, its intrinsically low electronic noise level, which is typical of a CMOS type detector, helped achieve NNPSs lower than those of the aSi based Varian detector.
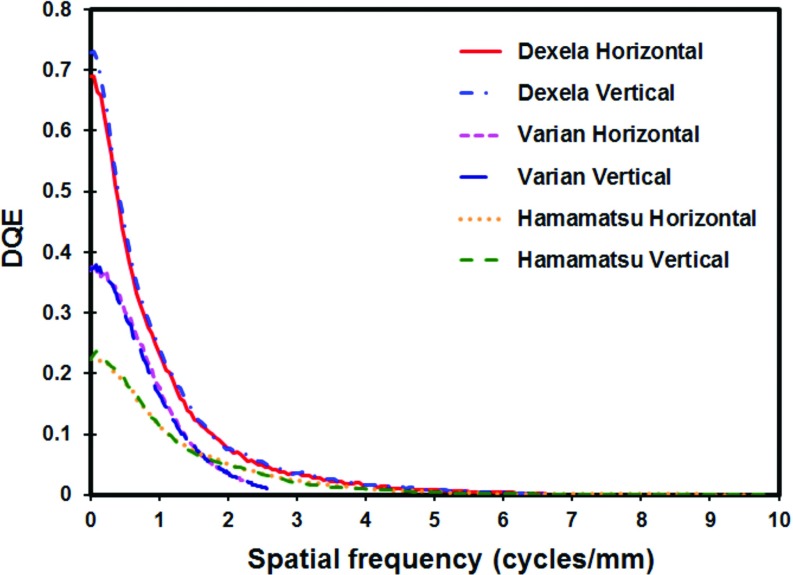
The DQEs in horizontal and vertical directions are plotted for Varian, Dexela, and Hamamatsu detectors in Fig. 9. The DQE values of the Dexela detector are higher than those of the two other detectors over the entire frequency range. The high DQE values of the Dexela detector may be explained as the result of the combination of the thick (500 μm) scintillator used, the intrinsically low electronic noise of a CMOS detector and the higher MTF values. DQE values vary with the exposure level at which they are measured. The DQE values reported in this paper were measured at low exposure levels typically encountered in breast CT. At such levels, the level of electronic noise relative to the quantum noise plays an important role in determining the DQE values. Despite the slightly thinner scintillator used by the Dexela detector, its inherently low electronic noise, typical of a CMOS detector, helped lower the NNPSs and increase the DQEs at low frequencies. At high frequencies, the higher MTF values of the Dexela detector also helped boost up its DQE values. In addition, the higher Nyquist frequency of the Dexela detector helped expand its DQE plots and its usability to higher frequencies. Like the Dexela detector, the Hamamatsu detector is also a CMOS type detector and therefore has intrinsically lower electronic noises. In addition, it has significantly better MTF values. However, the use of a thinner (150 μm) scintillator resulted in significantly lower x-ray absorption and therefore significantly poorer DQE values.
Figure 9.
Horizontal and vertical DQEs measured with an air kerma of 4.1, 6.4, and 6.2 μGy/frame at the input of the Varian, Dexela, and Hamamatsu detectors, respectively.
The above presented MTF, NPS, and DQE measurements may be used to explain the differences between the detectors in their ability to image small MCs. The Varian detector is widely used in building dedicated breast CT scanners. It employs large (194 μm) pixels and a thick (600 μm) scintillator layer to achieve high quantum efficiency but poorer spatial resolution which limits its ability to image small MCs. Although the Varian detector was operated without binning in this study, it has been widely used by others in the 2 × 2 binning mode to maximize the frame rate in acquisition. This also helps lower the image noise level but results in degraded spatial resolution with a pitch of 388 μm. The Hamamatsu detector, on the other hand, is representative of the other end of spectrum: a high resolution, low quantum efficiency detector. It employs small (50 μm) pixels and a thin (150 μm) CsI scintillator to optimize the spatial resolution at the expense of quantum efficiency. As the result, while it can be used to image very small MCs, the exposure level must be raised significantly higher, increasing the MGD to an unacceptable level. The Dexela detector, as configured for our study, is a mixture of the two: it employs small (75 μm) pixels to extend its MTF to higher frequencies but a thick (500 μm) CsI scintillator to achieve a quantum efficiency nearly as high as that of the Varian detector. From Fig. 8, it is obvious that the MTF of the Dexela detector is lower than that of the Hamamatsu detector. However, the visibility of MCs depends not only on the spatial resolution but also on the noise characteristics through the DQE. The high quantum efficiency of the thick (500 μm) CsI scintillator coupled with the low noise level typical of CMOS detectors helped boost up DQE values of the Dexela detector. This benefit more than compensated for the compromise on spatial resolution through the use of a thick (500 μm) CsI scintillator. This would explain well why the Dexela detector outperformed both the Varian and the Hamamatsu detectors in imaging small MCs.
Limitations of the study
While this study explored and demonstrated the use of a high pitch (75 μm) CMOS detector coupled with a thick (500 μm) CsI scintillator for imaging aluminum wires or small simulated calcifications, it has several limitations. First of all, the use of the adipose tissue like paraffin as the background material does not fully reflect realistic conditions of breast imaging, in which calcifications are often present within dense tissue. Thus, the contrast of the calcifications in this study were higher than what it would be realistically. One major goal of this study is to compare the performance of the Dexela detector with the Varian and Hamamatsu detectors for breast CT applications. To this purpose, the use of adipose tissue like paraffin as the background material should be adequate. However, it should be noted that the results cannot be used to establish the minimum visible calcification size in clinical applications as the contrast of the calcifications would be reduced in dense tissue regions and the visibility may further be affected by the degree of complexity of the tissue structures.
Another limitation is the simplicity of the observer study. We have quantified the visibility as the ratio of visible calcifications in 25 similar size calcifications arranged into a 5 × 5 array. A receiver operating characteristics (ROC) type study would provide more rigorous evaluation and comparison of the Dexela detector based CBCT system with those based on the Varian and Hamamatsu detectors. However, this type of study is prohibitively costly and time consuming at this stage of our work and it is often conducted with patient images during clinical studies. The use of the visibility as defined in this study allowed us to conduct a quantitative assessment within the limit of our resources and time. This is similar to the use of contrast detail phantoms or other test patterns in the evaluation of imaging systems in many imaging physics literature.
CONCLUSIONS
We have investigated the visibility of MCs in CBCT breast imaging using three different CsI based flat panel detectors. We have demonstrated that the use of a high pitch (75 μm) CMOS detector coupled with a thick (500 μm) CsI scintillator helped make 150–160, 160–180, and 180–200 μm MCs more visible at MGDs up to 10.8, 9 and 10.8 mGy, respectively. It also helped make 200–212 and 212–224 μm MCs more visible at MGDs up to 7.2 mGy. For higher MGDs, the Varian detector performed similarly or even better for these size groups. There was no performance difference observed for the 224–250 μm or larger size groups, either. With the higher spatial resolution of the Dexela detector based system, the apparent dimensions and shapes of MCs were more accurately rendered. These findings correlated well with the differences in MTFs, NPSs, and DQEs measured for these three detectors.
ACKNOWLEDGMENTS
This work was supported in part by research grants CA104759, CA135802, and CA124585 from NIH-NCI, a grant EB000117 from NIH-NIBIB, and a subcontract from NIST-ATP.
References
- Robb R. A., “The dynamic spatial reconstructor: An x-ray video-fluoroscopic CT scanner for dynamic volume imaging of moving organs,” IEEE Trans. Med. Imaging 1, 22–33 (1982). 10.1109/TMI.1982.4307545 [DOI] [PubMed] [Google Scholar]
- Cho P. S., Johnson R. H., and Griffin T. W., “Cone-beam CT for radiotherapy applications,” Phys. Med. Biol. 40, 1863–1883 (1995). 10.1088/0031-9155/40/11/007 [DOI] [PubMed] [Google Scholar]
- Fahrig R., Fox A. J., Lownie S., and Holdsworth D. W., “Use of a C-arm system to generate true three-dimensional computed rotational angiograms: Preliminary in vitro and in vivo results,” AJNR Am. J. Neuroradiol. 18, 1507–1514 (1997). [PMC free article] [PubMed] [Google Scholar]
- Jaffray D. A., Drake D. G., Moreau M., Martinez A. A., and Wong J. W., “A radiographic and tomographic imaging system integrated into a medical linear accelerator for localization of bone and soft-tissue targets,” Int. J. Radiat. Oncol., Biol., Phys. 45, 773–789 (1999). 10.1016/S0360-3016(99)00118-2 [DOI] [PubMed] [Google Scholar]
- Baba R., Ueda K., and Okabe M., “Using a flat-panel detector in high resolution cone beam CT for dental imaging,” Dentomaxillofac. Radiol. 33, 285–290 (2004). 10.1259/dmfr/87440549 [DOI] [PubMed] [Google Scholar]
- Gupta R., Bartling S. H., Basu S. K., Ross W. R., Becker H., Pfoh A., Brady T., and Curtin H. D., “Experimental flat-panel high-spatial-resolution volume CT of the temporal bone,” AJNR Am. J. Neuroradiol. 25, 1417–1424 (2004). [PMC free article] [PubMed] [Google Scholar]
- Daly M. J., Siewerdsen J. H., Moseley D. J., Jaffray D. A., and Irish J. C., “Intraoperative cone-beam CT for guidance of head and neck surgery: Assessment of dose and image quality using a C-arm prototype,” Med. Phys. 33, 3767–3780 (2006). 10.1118/1.2349687 [DOI] [PubMed] [Google Scholar]
- Moore C. J., Amer A., Marchant T., Sykes J. R., Davies J., Stratford J., McCarthy C., MacBain C., Henry A., Price P., and Williams P. C., “Developments in and experience of kilovoltage X-ray cone beam image-guided radiotherapy,” Br. J. Radiol. 79, S66–S78 (2006). 10.1259/bjr/68255935 [DOI] [PubMed] [Google Scholar]
- Peltonen L. I., Aarnisalo A. A., Kortesniemi M. K., Suomalainen A., Jero J., and Robinson S., “Limited cone-beam computed tomography imaging of the middle ear: A comparison with multislice helical computed tomography,” Acta Radiol. 48, 207–212 (2007). 10.1080/02841850601080465 [DOI] [PubMed] [Google Scholar]
- Khoury A., Whyne C. M., Daly M., Moseley D., Bootsma G., Skrinskas T., Siewerdsen J., and Jaffray D., “Intraoperative cone-beam CT for correction of periaxial malrotation of the femoral shaft: A surface-matching approach,” Med. Phys. 34, 1380–1387 (2007). 10.1118/1.2710330 [DOI] [PubMed] [Google Scholar]
- Orth R. C., Wallace M. J., and Kuo M. D., “C-arm cone-beam CT: General principles and technical considerations for use in interventional radiology,” J. Vasc. Interv. Radiol. 19, 814–820 (2008). 10.1016/j.jvir.2008.02.002 [DOI] [PubMed] [Google Scholar]
- Ning R., Chen B., Conover D., McHugh L., Cullinan J., and Yu R., “Flat panel detector-based cone beam volume CT mammography imaging: Preliminary phantom study,” Proc. SPIE 4320, 601–610 (2001). 10.1117/12.430901 [DOI] [Google Scholar]
- Boone J. M., Nelson T. R., Lindfors K. K., and Seibert J. A., “Dedicated breast CT: Radiation dose and image quality evaluation,” Radiology 221, 657–667 (2001). 10.1148/radiol.2213010334 [DOI] [PubMed] [Google Scholar]
- Chen L., Shaw C. C., Tu S.-J., Altunbas M., Wang T., Lai C.-J., Liu X., and Kappadath S. C., “Cone-beam CT breast imaging with a flat panel detector: A simulation study,” Proc. SPIE 5745, 943–951 (2005). 10.1117/12.597065 [DOI] [PubMed] [Google Scholar]
- Glick S., Vedantham S., and Karellas A., “Investigation of optimal kVp Settings for CT mammography using a flat panel detector,” Proc. SPIE 4682, 392–402 (2002). 10.1117/12.465581 [DOI] [Google Scholar]
- Boone J. M. and Lindfors K. K., “Breast CT: Potential for breast cancer screening and diagnosis,” Future Oncol. 2, 351–356 (2006). 10.2217/14796694.2.3.351 [DOI] [PubMed] [Google Scholar]
- Brzymialkiewicz C. N. et al. , “Performance of dedicated emission mammotomography for various breast shapes and sizes,” Phys. Med. Biol. 51, 5051–5064 (2006). 10.1088/0031-9155/51/19/021 [DOI] [PMC free article] [PubMed] [Google Scholar]
- Lai C. J., Shaw C. C., Chen L., Altunbas M. C., Liu X., Han T., Wang T., Yang W. T., Whitman G. J., and Tu S. J., “Visibility of microcalcification in cone beam breast CT: Effects of X-ray tube voltage and radiation dose,” Med. Phys. 34, 2995–3004 (2007). 10.1118/1.2745921 [DOI] [PMC free article] [PubMed] [Google Scholar]
- Thomas D. B., Whitehead J., Dorse C., Threatt B. A., F. I.Gilbert, Jr., Present A. J., and Carlile T., “Mammographic calcifications and risk of subsequent breast cancer,” J. Natl. Cancer Inst. 85, 230–235 (1993). 10.1093/jnci/85.3.230 [DOI] [PubMed] [Google Scholar]
- Gong X., Vedula A. A., and Glick S. J., “Microcalcification detection using cone-beam CT mammography with a flat-panel imager,” Phys. Med. Biol. 49, 2183–2195 (2004). 10.1088/0031-9155/49/11/005 [DOI] [PubMed] [Google Scholar]
- Chen B. and Ning R., “Cone-beam volume CT breast imaging: Feasibility study,” Med. Phys. 29, 755–770 (2002). 10.1118/1.1461843 [DOI] [PubMed] [Google Scholar]
- Shen Y., Chen L., Ge S., Yi Y., Han T., Zhong Y., Lai C.-J., Liu X., Wang T., and Shaw C. C., presented at the Medical Imaging 2009: Physics of Medical Imaging, Lake Buena Vista, FL, 2009. (unpublished).
- Crotty D. J., McKinley R. L., and Tornai M. P., “Experimental spectral measurements of heavy K-edge filtered beams for x-ray computed mammotomography,” Phys. Med. Biol. 52, 603–616 (2007). 10.1088/0031-9155/52/3/005 [DOI] [PMC free article] [PubMed] [Google Scholar]
- Glick S. J., Thacker S., Gong X., and Liu B., “Evaluating the impact of X-ray spectral shape on image quality in flat-panel CT breast imaging,” Med. Phys. 34, 5–24 (2007). 10.1118/1.2388574 [DOI] [PubMed] [Google Scholar]
- Vollmar S. V. and Kalender W. A., “Reduction of dose to the female breast as a result of spectral optimisation for high-contrast thoracic CT imaging: A phantom study,” Br. J. Radiol. 82, 920–929 (2009). 10.1259/bjr/28017710 [DOI] [PubMed] [Google Scholar]
- Prionas N. D., Huang S. Y., and Boone J. M., “Experimentally determined spectral optimization for dedicated breast computed tomography,” Med. Phys. 38, 646–655 (2011). 10.1118/1.3537077 [DOI] [PMC free article] [PubMed] [Google Scholar]
- Yi Y., Lai C.-J., Han T., Zhong Y., Shen Y., Liu X., Ge S., You Z., Wang T., and Shaw C. C., “Radiation doses in cone-beam breast computed tomography: A Monte Carlo simulation study,” Med. Phys. 38, 589–597 (2011). 10.1118/1.3521469 [DOI] [PMC free article] [PubMed] [Google Scholar]
- Feldkamp L. A., Davis L. C., and Kress J. W., “Practical cone-beam algorithm,” J. Opt. Soc. Am. 1, 612–619 (1984). 10.1364/JOSAA.1.000612 [DOI] [Google Scholar]
- Fujita H., Tsai D. Y., Itoh T., Doi K., Morishita J., Ueda K., and Ohtsuka A., “A simple method for determining the modulation transfer function in digital radiography,” IEEE Trans. Med. Imaging 11, 34–39 (1992). 10.1109/42.126908 [DOI] [PubMed] [Google Scholar]
- Liu X. and Shaw C. C., “A-Si:H/CsI(Tl) flat-panel versus computed radiography for chest imaging applications: Image quality metrics measurement,” Med. Phys. 31, 98–110 (2004). 10.1118/1.1625102 [DOI] [PubMed] [Google Scholar]
- “Medical electrical equipment: Characteristics of digital x-ray imaging devices _ part 1: Determination of the detective quantum efficiency,” IEC Report No. 62220-1 (International Electrotechnical Commission, Geneva, 2003).
- Cranley K., Gilmore B. J., Fogarty G. W. A., and Desponds L., “Catalogue of diagnostic x-ray spectra and other data,” The Institute of Physics and Engineering in Medicine, Report No. 78, 1997.


