Abstract
Spectral domain optical coherence tomography (SD-OCT) is a useful tool for the visualization of drusen, a retinal abnormality seen in patients with age-related macular degeneration (AMD); however, objective assessment of drusen is thwarted by the lack of a method to robustly quantify these lesions on serial OCT images. Here, we describe an automatic drusen segmentation method for SD-OCT retinal images, which leverages a priori knowledge of normal retinal morphology and anatomical features. The highly reflective and locally connected pixels located below the retinal nerve fiber layer (RNFL) are used to generate a segmentation of the retinal pigment epithelium (RPE) layer. The observed and expected contours of the RPE layer are obtained by interpolating and fitting the shape of the segmented RPE layer, respectively. The areas located between the interpolated and fitted RPE shapes (which have nonzero area when drusen occurs) are marked as drusen. To enhance drusen quantification, we also developed a novel method of retinal projection to generate an en face retinal image based on the RPE extraction, which improves the quality of drusen visualization over the current approach to producing retinal projections from SD-OCT images based on a summed-voxel projection (SVP), and it provides a means of obtaining quantitative features of drusen in the en face projection. Visualization of the segmented drusen is refined through several post-processing steps, drusen detection to eliminate false positive detections on consecutive slices, drusen refinement on a projection view of drusen, and drusen smoothing. Experimental evaluation results demonstrate that our method is effective for drusen segmentation. In a preliminary analysis of the potential clinical utility of our methods, quantitative drusen measurements, such as area and volume, can be correlated with the drusen progression in non-exudative AMD, suggesting that our approach may produce useful quantitative imaging biomarkers to follow this disease and predict patient outcome.
Keywords: Drusen segmentation, SD-OCT, projection image, retinal pigment epithelium, AMD
1. Introduction
Age-related macular degeneration (AMD) is a degenerative eye disease that affects central vision, and is the leading cause of severe visual impairment in patients over the age of 65 in the developed world (Klein et al., 1997). An estimated 8 million persons at least 55 years old in the United States have monocular or binocular intermediate AMD or monocular advanced AMD (In, 2003). One of its clinical characteristics and, in most cases, the first clinical finding is the presence of drusen (Jager et al., 2008). Drusen are focal deposits of extracellular material located between the basal lamina of the retinal pigment epithelium (RPE) and the inner collagenous layer of Bruch’s membrane (Abdelsalam et al., 1999). Numerous longitudinal studies have demonstrated positive correlations between estimated total drusen area and maximum drusen size with risk of progression to advanced AMD using fundus photography (Klein et al., 1997; Davis et al., 2005).
Evaluation of color fundus photographs (CFPs) represents the gold standard for drusen measurement in non-neovascular AMD. However, in CFPs it can be challenging to reliably localize drusen against the varying background of macula, RPE, and choroid pigment (Klein et al., 1991; Smith et al., 2005b; Shin et al., 1999). In addition, reliable quantitation of drusen on CFP is challenging. Moreover, a qualitative approach to drusen evaluation is likely less sensitive to small changes (and subject to errors of inter-observability), and it will likely miss early changes in the disease status.
Optical coherence tomography (OCT) provides in vivo cross sectional imaging of drusen with the capability of volumetric quantitative evaluation of retinal structure. Recent spectral domain OCT systems (SD-OCT), with their increase in imaging speed over conventional time-domain OCT, are able to obtain more than 100 high-resolution scans in the time required to capture less than 10 time-domain scans (Drexler et al., 2003; Wojtkowski et al., 2005; Srinivasan et al., 2006). Thus, SD-OCT represents a promising alternative modality for imaging drusen in high resolution and with the potential for measurement of these lesions.
At present, most of the drusen segmentation methods are proposed for CFPs, not OCT images. Duanggate and Uyyanonvara (Duanggate and Uyyanonvara, 2008) reviewed automatic drusen segmentation from CFPs. Many different approaches to automated segmentation of drusen in CFPs have been developed, which includes histogram-based approaches (Rapantzikos and Zervakis, 2001; Rapantzikos et al., 2003; Checco and Corinto, 2006; Smith et al., 2005a), texture-based approaches (Parvathi and Devi, 2007; Lee et al., 2008; Freund et al., 2009), morphological approaches (Sbeh et al., 1997, 2001), multi-level analysis approach (Brandon and Hoover, 2003) and fuzzy logic approaches (Thaibaoui et al., 2000; Liang et al., 2010; Quellec et al., 2011). A common challenge among these systems is that the margins of the drusen are difficult to discern reliably on CFP since this is a two-dimensional imaging modality.
To achieve drusen segmentation in OCT images, manual segmentation (Freeman et al., 2010; Bower et al., 2007) is generally adopted, and few automated methods have been reported. Farsiu et al. (2008) and Toth et al. (2008) proposed an automatic drusen segmentation algorithm. In the first step, the location of the retinal nerve fiber layer (RNFL) was estimated and then the RPE layer localized. By enforcing a local convexity condition and fitting second or fourth order polynomials to the possibly unhealthy (abnormal) RPE curve, the healthy (normal) shape of the RPE layer is estimated. The area between the estimated normal and the segmented RPE outlines was marked as possible drusen. Yi et al. (2009) utilized a similar algorithm to automatically segment drusen. The main difference between Farsiu’s method (Farsiu et al., 2008) and Yi’s method (Yi et al., 2009) was the extraction of RPE layers. Gregori et al. (2011) and Iwama et al. (2012) also segmented drusen based on the distance between the abnormal RPE and the normal RPE floor.
While the prior work on automated drusen segmentation is a step in the direction of quantitation, there are unsolved challenges. First, drusen may obscure portions of the image needed for accurate estimation of RPE layers. For example, there are no dark regions beneath RPE layers for the drusen that have high reflectivity, as shown in Fig. 10. Second, RPE layer segmentation is difficult even in normal patients because the inner segment/outer segment (IS/OS) retinal layers are often contiguous with the RPE and there is abundant noise in low signal-to-noise ratio (SNR) OCT images. To counteract these potential problems, Farsiu et al. (2008) provided a manual correction using a software interface.
Fig. 10.
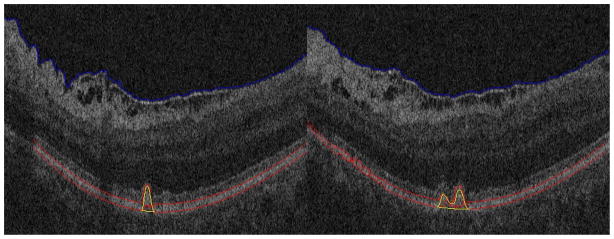
Segmentation results for drusen with convex, high reflectivity, homogeneous pattern
In this paper, we tackle the above challenges, and present a novel automated drusen segmentation method in SD-OCT images. In addition, we also provide a means of generating a high-quality projection image based on RPE layer estimation. According to one study (Jain et al., 2010), drusen detection in CFP and SD-OCT images has good concordance, and each imaging modality has its own advantages. Our algorithm utilizes the projection image to verify and refine the segmentation results from SD-OCT images, which reduces the influence of RPE estimation error and improves the robustness of drusen segmentation.
2. Methods
2.1. Review of Retinal Structures and Drusen in OCT
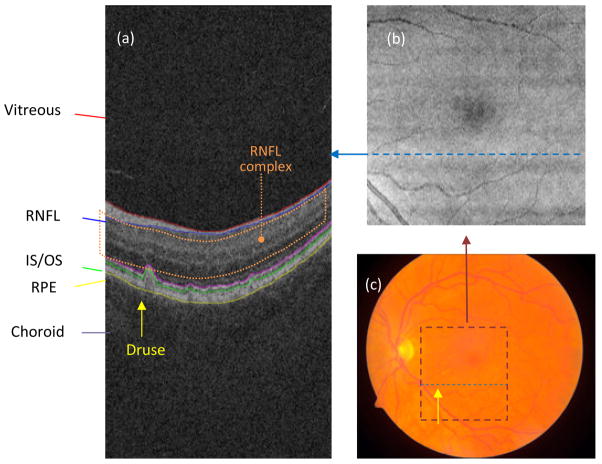
In our study, each SD-OCT image set was acquired over a 6×6 mm macular area (corresponding to 512×128 pixels) and a 2 mm axial depth (corresponding to 1024 pixels) with the CirrusHD-OCT 4000 (Carl Zeiss Meditec, Inc., Dublin, CA) device. Fig. 1 shows a diagram of the retinal structures seen on SD-OCT. Each cross-sectional SD-OCT image in the volumetric data set is called a “B-scan” and allows the visualization of intra-retinal layers. The location of the B-scan within the summed voxel projection (SVP) of the SD-OCT cube and within a fundus photography image of the same eye is indicated in Fig. 1 with a dashed blue line. The lateral and azimuthal extent of the SD-OCT scan is also indicated within the fundus image with a dashed maroon square. The retina is seen as a layered structure on B-scans; the most superficial layer is the RNFL, followed by the IS/OS, RPE, and choroid. The RPE has a uniform gently arcing shape. Drusen are small bumps that deposit under the RPE and lift it, interrupting its smoothly arced shape and causing it to have a bumpy contour (the location of one druse within a B-scan and fundus photography is indicated by a yellow arrow in Fig. 1). Our method seeks to characterize the normal shape of the RPE (had it not been deformed by drusen) and then use this information to measure the amount of drusen (thickness, area, volume, etc.).
Fig. 1.
(a) Target retinal layers of a cross-sectional SD-OCT image (B-scan). RNFL: retinal nerve fiber layer; IS/OS: photoreceptor inner/outer segments; RPE: retinal pigment epithelium. The location of a druse is indicated with a yellow arrow. The RNFL complex (defined as the region between the inner limiting membrane and outer plexiform layer) is indicated by the orange dotted region. (b) SVP image of the same eye. The dashed blue line indicates the location of the B-scan presented in (a) within the projection image. (c) Color fundus photograph of the same eye. The maroon dashed square indicates the area in the macula present in the SD-OCT scan. The dashed blue line indicates the location of the B-scan presented in (a) within the fundus photograph. The location of the druse clearly seen in (a) is indicated with a yellow arrow.
2.2. Overview of Method
We briefly introduce the algorithm before providing a detailed description of each individual step in the following subsections. A flowchart of our algorithm is shown in Fig. 2, which comprises the following operations on the input SD-OCT image:
Fig. 2.

Flowchart of the proposed algorithm
Image denoising: A modified bilateral filtering algorithm is used to reduce noise in order to facilitate the subsequent estimation of the RNFL and RPE retinal layer.
RNFL complex removal: The RNFL complex, defined as the region between the inner limiting membrane and the outer plexiform layer (indicated by the orange dotted outline in Fig. 1(a)), overlies the RPE and is removed to facilitate segmenting the RPE layer of the retina.
RPE segmentation: The RPE layer is extracted as a continuous structure through interpolation. In addition, the shape it would have had without drusen is estimated though a fitting procedure to interpolate its shape in areas where it is distorted by drusen.
Drusen segmentation: An initial segmentation of drusen is obtained from the RPE segmentation image as the areas located between the interpolated and fitted RPE shapes.
Drusen projection: To refine the initial drusen segmentation, an en face drusen projection image is generated on a volume of the SD-OCT image restricted to the sub-volume of the image containing the RPE and drusen segmentation.
Elimination of false positive drusen: Consecutive slices are evaluated to eliminate detections that are not drusen.
Drusen refinement: The intensity and shape information of drusen on the projection image are utilized to remove false drusen.
Drusen smoothing: A smoothing operation is performed in three-dimensional (3D) space to obtain the final segmentation results.
2.3. Image Denoising
OCT imaging is based on interferometric detection of coherent optical beams, and the beams have low temporal coherence and high spatial coherence. Thus, OCT images contain speckle. Speckle in OCT tomograms is dependent on several factors, such as the wavelength of the imaging beam and the structural details of the imaged object (Rogowska and Brezinski, 2000). Speckle size may be different in the axial and lateral dimensions, which are mainly determined by the source bandwidth and numerical aperture, respectively. Besides speckle noise, shot noise also exists in OCT images, which is additive in nature and can be adequately described by the Additive White Gaussian Noise (AWGN) process (Gargesha et al., 2008). To facilitate segmentation of the contours of the RNFL and RPE layers, noise removal is needed. In this paper, we adopted bilateral filtering (Tomasi and Manduchi, 1998):
| (1) |
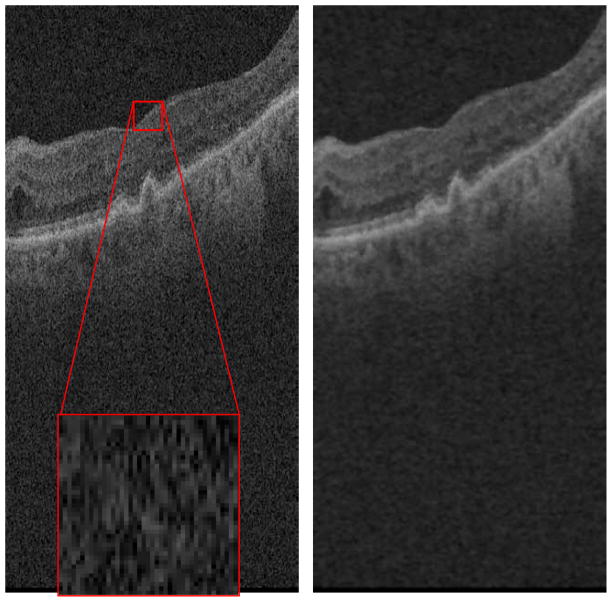
where f and h are the input and output images, respectively. c(ξ, x) measures the geometric closeness between the neighborhood center x and a nearby point ξ. The similarity function s measures the photometric similarity. The normalization function is . The functions c and s are Gaussian functions, where the standard deviations of c and s are experimentally fixed to 5 and 0.3 in this paper, respectively. These values were determined by visual inspection of the denoised images. The filter window is traditionally a small square neighborhood. Because layers in OCT retinal images generally tend to stretch in the horizontal direction in the image, as shown in Fig. 3a, we use a rectangle window of 7×19 pixels, in which the horizontal length is larger than the vertical length, instead of using a square filter window; the rectangle window will contain more similar pixels than the square window in object regions. The basic idea of most of image denoising methods is to find as many similar pixels as possible to obtain good denoising results. Thus, the rectangle filter window shape seems well suited for OCT retinal images. Although the bilateral filtering may not be optimal for SD-OCT image denoising compared with the patch-based methods (Buades et al., 2005; Fang et al., 2012), it has a relatively low time complexity and acceptable performance for the needs of our segmentation algorithm. Compared with traditional denoising methods, such as Gaussian filtering, the bilateral filtering is better for edge preservation. Thus, by considering the denoising performance and computing time, the improved bilateral filtering was considered as a pre-processing step in our drusen segmentation algorithm.
Fig. 3.
Denoising of 3D SD-OCT data
Fig. 3b is the denoised result of Fig. 3a after bilateral filtering with the described rectangular window. By comparing Fig. 3b with Fig. 3a, it can be seen that while the filtering step involves certain image blurring effects, the speckle noise reduction is apparent and the retinal layer edges are preserved with certain visual quality.
2.4. RNFL Complex Removal, RPE Estimation, and Drusen Segmentation
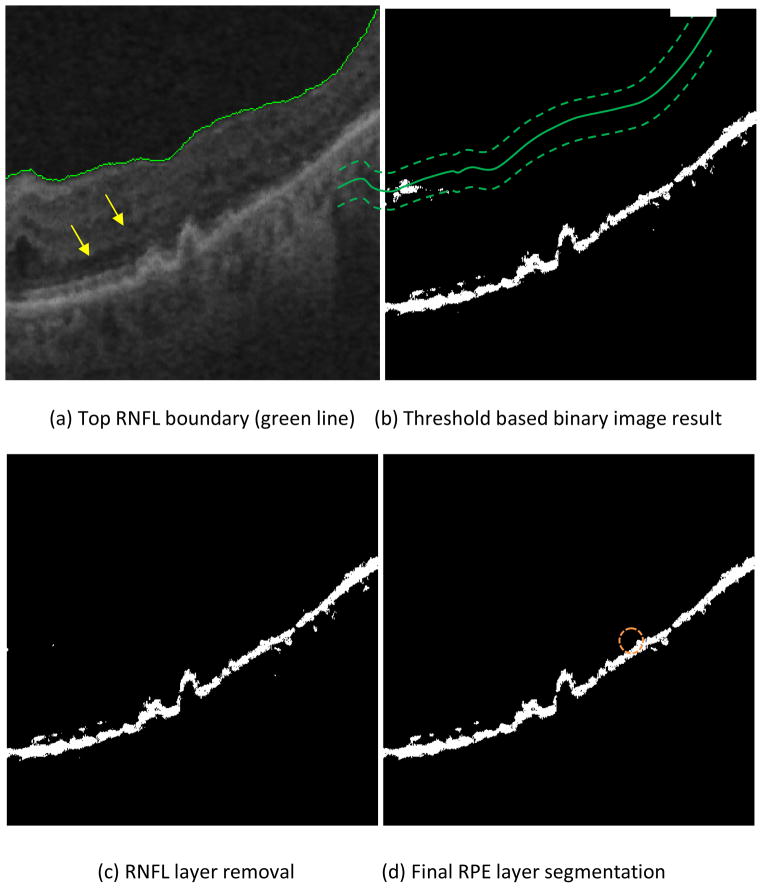
The purpose of removing the high reflectivity pixels in the RNFL complex (including the inner limiting membrane, RNF layer, and possible highly reflective areas in the inner and outer plexiform layers) is to facilitate segmenting the RPE layer of the retina. For a particular imaging device, the reflectivity of the background region (the vitreous of the eye) is similar throughout the image, and thus a constant threshold can be used to extract this background region, which helps to identify the contour of the inner surface of the RNFL complex (Fig. 1). The bottom boundary of the background region (the vitreous region as shown in Fig. 1) is taken as the inner boundary of the RNFL layer, as shown in Fig. 4a.
Fig. 4.
RNFL and RPE estimations
The RPE layer contains high pixel values in SD-OCT retinal images due to its high reflectivity, as shown in Fig. 1. Thus, threshold-based methods can be used to identify it. In addition, the RPE is normally relatively constant in thickness (20μm). Based on this information and the histogram statistics of the image pixels, a threshold can be determined (see appendix for the details), which separates the higher valued (candidate pixels that belong to the RPE) from the lower valued pixels (belonging to the background) regions to produce a binary image of the initial RPE estimation (Fig. 4b). In addition, the bright regions close to the estimated inner boundary of the RNFL layer are removed. Specifically, a narrow band of 20 pixel radius (approximately 40μm) is generated around the estimated inner RNFL boundary (indicated by the two dashed and the solid green curves shown in Fig. 4b, respectively), and then the high valued regions with pixel values above the indicated threshold connected with this narrow band are removed. This band was generated by dilating the top boundary of the RNFL layer and its radius (approximately 40μm) was determined by visual inspection of the normal thickness of the RNFL complex. Fig. 4c is binarized result after the RNFL layer removal. By comparing Figs. 4b&c, it can be seen that the bright regions in Fig. 4c are mainly composed of the RPE layer. The final segmentation of the RPE layer (Fig. 4d) is obtained by removing small bright regions (segmented regions with areas of less than 150 pixels) in Fig. 4c. To ensure that the RPE is a continuous linear structure, missing pixels are interpolated by bilinear interpolation. For example, the discontinuity in the RPE marked with the dashed orange circle in Fig. 4d and Fig. 5 was interpolated using neighboring information. Finally, the middle axis of the RPE is calculated (Fig. 5, red line) by taking the average height of the top and lower RPE boundaries in each column.
Fig. 5.
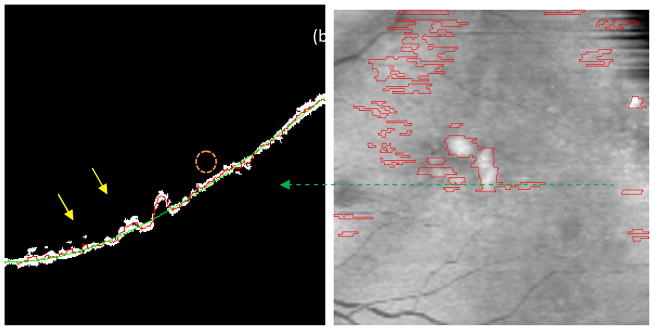
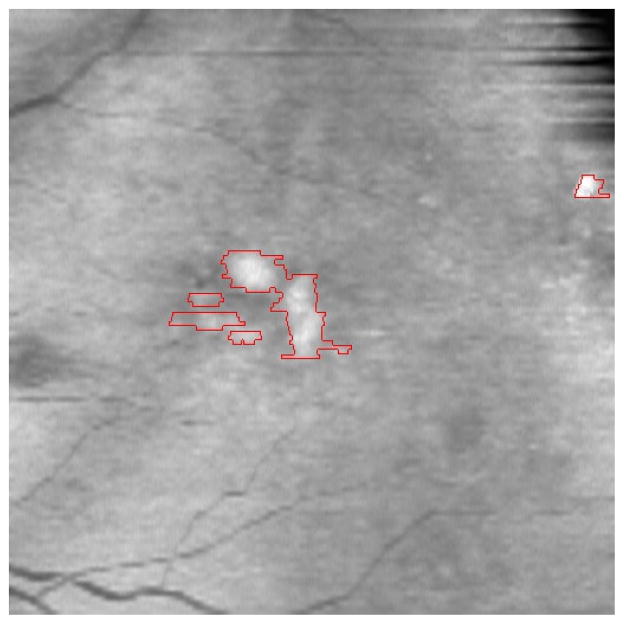
Drusen segmentation result. (a) Arrows show two drusen. Red line: the middle axis of the interpolated RPE; Green line: the middle axis of the fitted RPE). (b) Primary drusen result (the red lines represent drusen boundaries in the fundus projection image).
In normal retinas, the RPE is a smooth curved bright line (Fig. 5, green line). When drusen occurs, however, the RPE layer is displaced upwardly and its contour is distorted (Figs. 1, 3 and 4). To estimate the contour of the RPE layer had it not been distorted by drusen, we apply a 3rd order polynomial fitting function to the middle axis of the interpolated RPE, producing the middle axis of the fitted RPE layer (Fig. 5, green line).
The difference between the middle axes of the interpolated and fitted RPE layers is utilized to determine the location of drusen. Since the most common drusen pattern is convex (Yi et al., 2009), like a dome, drusen can exist in the position where the middle axis difference is larger than a nonnegative constant. Due to the influence of noise and IS/OS layers, the estimated middle axes of the abnormal and normal RPE layers are probably not precise. In order to improve the robustness of the drusen localization, the nonnegative constant is empirically set to be a small value, 5 in this study. This value was determined mainly by the axial resolution of the considered SD-OCT cubes and was fixed for the initial drusen segmentation in all the SD-OCT scans in this work. The drusen segmentation precision is improved in subsequent post-processing.
Fig. 5a shows the primary drusen segmentation result of Fig. 4a, where the red and green lines are the middle axes of the interpolated and fitted RPE layers, respectively. The corresponding drusen segmentation of Fig. 5a was indicated in the fundus projection image (Fig. 5b), marked with the dashed green line. The two areas with large difference pointed by the yellow arrows in Fig. 5a correspond to the two drusen pointed by the yellow arrows in Fig. 4a.
2.5. Drusen Projection Image Generation
A common method for creating 2D projection from SD-OCT datasets is summed-voxel projection (SVP) (Jiao et al., 2005), in which all the pixel values in the 3D images are summed along axial lines, producing an image showing the retinal surface en face, similar to the CFP. The SVP cannot effectively reflect the alteration in the RPE layer caused by drusen (Stopa et al., 2008). To date however, the en face SVP fundus image is not ideal for drusen visualization because most drusen have been found to not be visible when projected using this technique (Jiao et al., 2005). In order to make drusen appear more clearly in fundus projection images, we present a novel projection method of the RPE layer to generate the fundus image, based on a selective volume projection, analogous to that done in Gorczynska et al., 2009. Fig. 6a shows an example of selection of a sub-volume in a narrow band zone between two parallel curves to isolate the RPE. The bottom red curve is the base of the normal RPE layer, and the top red curve is determined by the tallest drusen in all of B-scans. As a result, the projection region contains only the RPE layer and drusen. To further enhance visualization of drusen, the dark regions beneath the drusen are replaced with the bright pixels in the same column, which enhances visibility of the drusen in the projection. Through this approach, the larger the height of the drusen, the brighter the drusen will appear in the projection image. Fig. 6b shows an example of drusen projection image, which is rescaled to a square by interpolation. The bright region in the central region of Fig. 6b corresponds to the large drusen in Fig. 6a, marked with the orange triangle in Fig. 6.
Fig. 6.
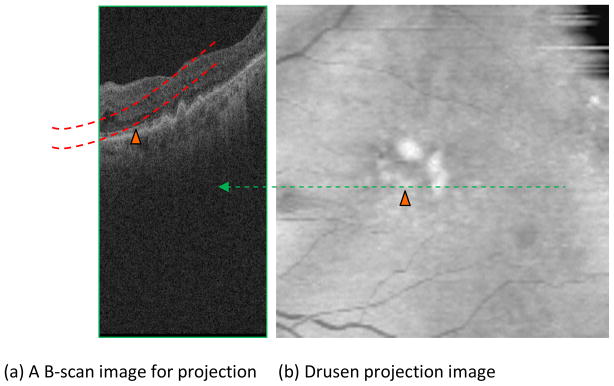
Drusen projection image generation
2.6. Post-processing
Drusen are composed of irregularly-shaped globular masses and of distinct spherical entities. Based on the shape characteristics of drusen, the following three step post-processing is adopted to improve drusen segmentation precision: elimination of false positive drusen with consecutive slices, drusen refinement with projection image, and drusen smoothing.
Elimination of false positive drusen. Given the density of the B-scans (128 B-scans per approximately 6 mm.), each drusen should appear in at least two consecutive B-scans with a fixed azimuthal interval (46.9μm). Here, we assume that the minimum size of drusen in the azimuthal dimension should be larger than such interval. If a drusen was only present in one B-scan, it was removed from the projection image as a likely false positive.
Drusen refinement with projection image. The primary drusen segmentation results were projected on the drusen projection image and the intensity and shape information was utilized to remove false drusen as follows. For each 4 adjacent drusen, if the difference of the average intensity of the inner and outer drusen regions (the outer regions are the background regions near drusen boundaries) is lower than a threshold (4 in this paper), or the ratio of the width and height of the drusen is larger than a threshold (6 in this paper), it was considered a false positive drusen and was removed. These thresholds are determined according to experimental results in Section 3. Fig. 7 shows the drusen refinement result of Fig. 5b based on the projection image. After the refinement, the false drusen that have similar average intensity with that of the background are removed, such as the initial drusen detections seen in the upper portion of Fig. 5b.
Drusen smoothing. Since drusen tend to have a smooth nature, Gaussian filtering is used to smooth the drusen segmentation results in 3D space. The drusen thickness map was smoothed with Gaussian filtering by keeping the baseline of drusen, and then the smoothed drusen thickness map was remapped into the original B-scans. Fig. A1a is the smoothed result of Fig. 7. The drusen boundaries in Fig. A1a become smoother, which is consistent with the drusen characteristics.
Fig. 7.
Drusen refinement result based on projection image
2.7. Experimental studies to evaluate the algorithm
2.7.1. Algorithm performance
The algorithm was implemented in Matlab and run on a 2.83 GHz Pentium 4 PC with 3.37GB memory. We recorded the time required to process the SD-OCT images and automatically segment drusen in each image.
2.7.2. Accuracy of automated segmentation
We obtained 143 SD-OCT volumetric image datasets (cubes) from 143 eyes in 99 patients with non-exudative AMD to test our automated drusen segmentation algorithm. All of the cubes were obtained using a CirrusHD-OCT 4000 device (Carl Zeiss Meditec, Inc., Dublin, CA). Each cube contained 128 contiguous 512×1024 pixel B-scan images (each B-scan comprising 512 A-scans containing 1024 pixels). The prevalence of drusen was 100%. Only patients who had dry AMD (ICD-9 362.51) with drusen in one or both eyes were included in the study and no normal subjects were included in the population. The B-scans for each cube where segmented using our automated segmentation algorithm. To evaluate the segmentations, we compared the results of our automated segmentation method with manual segmentations of drusen drawn by hand by expert readers. The manual raters used their knowledge of OCT anatomy to delineate and mark drusen on B-scan in eyes with AMD. They were made familiar with the proprietary markup tool and practiced marking images prior to actually performing the segmentation for the study. Quality control was established by having a third party (TL) grade the manual raters’ practice segmentations and feedback was given to improve their accuracy prior to the manual raters performing the segmentations for the study.
The segmentation protocol was as follows: each of the 128 B-scans in a 3D OCT dataset was loaded from superior to inferior into the marking software and the raters used the tool to delineate the top/anterior border of the drusen and RPE in the images and the bottom/posterior border of the drusen and RPE in the images. Segmentation was performed by using a mouse to mark with clicks the borders, which created a line that demarcated the drusen and RPE. After each of the 128 B-scans had been segmented, the data were used in the analysis.
This evaluation included two different analyses: First, a quantification of the possible discrepancies found in the manual segmentations drawn by different readers (inter-observer agreement) and by the same reader at different times (intra-observer agreement); second, a comparison of the differences between the automated method and manual segmentations with the measured observed inter-observer and intra-observer agreements. Evaluation of observer agreement was performed in four of the SD-OCT cubes (which contained drusen) from the manual segmentation by two experts (authors LZ and LK). Only four cubes were considered in the observer agreement assessment because of the enormity of the task (512 b-scans in total); each expert drew the outline of the RPE layer by hand—including the outline of drusen—in each of the 128 B-scan images in each cube. To assess intra-observer variation, each expert segmented each image twice in two different sessions at least 2 months apart.
We considered the absolute drusen area difference (ADAD) and the overlapping ratio (OR) as metrics to quantify the segmentation differences. The absolute drusen area difference mean ( ) and standard deviation (std(ADAD)) are defined as follows:
| (2) |
| (3) |
| (4) |
where K indicates the total number of drusen-present B-scans segmented in the evaluated set, indicates the set of points inside the drusen contour segmentation of the k-th B-scan drawn by expert X in the i-th session, and # A_ scans(k) indicates the number of A-scans where drusen were present in the k-th B-scan. Similarly, indicates the set of points inside the drusen segmentation contour drawn by expert Y for the k-th B-scan in the in the j-th session. The denominator in equation (3) indicates that the area differences were averaged for each B-scan by the number of A-scans containing drusen. The reason behind this averaging is because segmentation differences were only recorded in the depth axis (the manual segmentations were drawn as continuous lines along the RPE). In addition, we wanted our evaluation to be consistent with previous evaluation work done in similar OCT retinal segmentation algorithms. These metrics then represent an average error per A-scan containing drusen, which is the focus of this work, and not per A-scan in general.
In order to quantify within-expert agreement we computed the values of and where A and B indicate the two different experts respectively. The total number of segmented B-scans containing drusen (found in the four evaluated SD-OCT cubes) was K=340. For the between-expert agreement we compared the manual segmentations produced by the two different experts using the combination of the two segmentation sessions, so in this case we computed and K=680. Agreement in area estimates was also assessed by concordance correlation of the segmented areas between experts and sessions and the significance of their differences was tested by paired Wilcoxon test, which is the non-parametric counterpart of the paired sample t-test. The Wilcoxon paired singed-rank test is very commonly used when comparing repeated measurements in a single sample. In this case we are comparing the differences between two different segmentation results (either by two different readers, at different sessions or automatic versus manual segmentation) which are obtained from the same set of cases, so the results should be paired, and the Wilcoxon test is appropriate. The justification of using this nonparametric test over a paired sample t-test was that we could not assume the data (drusen areas segmented in B-scans) follow a normal distribution (which is assumed in a paired t-test), and we might expect large tails in their distribution.
The overlapping ratio was defined in the following way:
| (5) |
Mean and standard deviation values were computed across the B-scans containing drusen, in a similar manner as for the ADAD metrics.
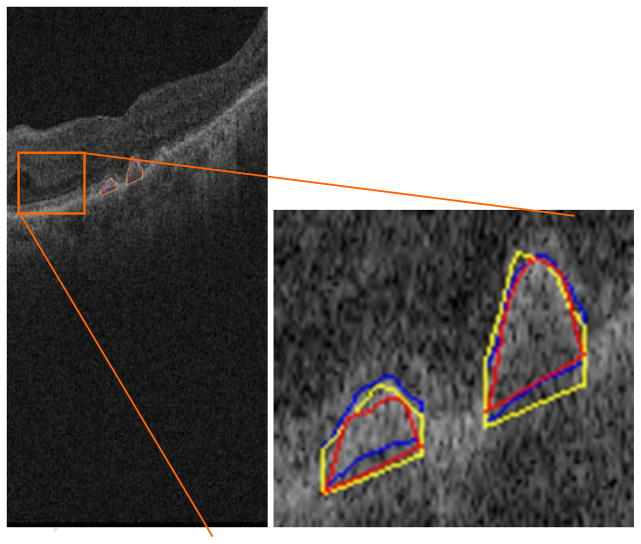
Once the variance of the manual segmentations was established, we used the same metrics to test the agreement between automated segmentations produced by our proposed method and those drawn by hand. We first compared the automated segmentation with the mean segmentation obtained from the four manual segmentations drawn by the two experts in the dataset of four eyes, taken as the gold standard. Fig. 8 demonstrates an example of the quantitative evaluation approach by overlapping the manual and automatic segmentation results in a single B-scan. The automatic drusen segmentation results are marked with red line.
Fig. 8.
Demonstration of the quantitative evaluation. The blue and yellow lines are the contours of two experts’ gold standard, respectively. The red line represents the contour of the automatic segmentation result.
In order to conduct a more thorough evaluation, manual segmentations were drawn by a third expert (author JM) on one B-scan in each of the 143 eyes in our complete dataset, selecting the most representative B-scan for each cube as the one that contained the largest area of drusen. The segmentations drawn by this third expert were taken as the gold standard to which we compared our method for the total set of eyes. While the automated method produces three dimensional segmentation of the drusen present in an SD-OCT cube, only one B-scan for each cube was manually segmented and considered in this second evaluation, with the goal of evaluating the method for a large number of different eyes while keeping the time intensive task of drawing drusen outlines to be within practical limits. We computed the mean and standard deviation of the ADAD and OR between the drusen areas segmented automatically and the selected gold standard segmentation, and OR(Autk,1;GSk,1) respectively.
2.7.3. Preliminary evaluation of drusen quantitation
To show that quantitative features of drusen can be extracted from our automatic segmentations, and to demonstrate the potential utility of using that information as a biomarker of disease status, we performed a pilot analysis of the drusen segmentation results in one patient who had SD-OCT on six different dates. At each time point, we produced a “drusen thickness map” and a “drusen surface map” to summarize the quantitative aspects of the drusen features we extracted. We analyzed two quantitative measurements, drusen area and volume, as biomarkers of disease status, and we plotted them over time. We correlated the temporal evolution in these imaging biomarkers with the evolution of the clinical status of the patient (visual acuity).
3. Results
3.1. Algorithm Performance
The pre-processing denoising step can be performed very rapidly by background batch processing. After image denoising, the 128 SD-OCT B-scans were segmented in approximately 6 minutes.
3.2. Drusen segmentation accuracy
Table 1 shows the segmented drusen area within-expert and between-expert agreement in terms of correlation coefficients, paired Wilcoxon test p-values and ADAD. 340 b-scans coming from 4 different eyes were considered. We noted that the boundaries of the RPE layers were often obscured due to noise and low resolution in OCT images, which produced discrepancies in the manual segmentation made by the two experts. The ADAD results are presented both in μm and in percentage values with respect to total segmented drusen area per b-scan. Both within-expert and between-expert evaluations present very high correlation values (between 0.97 and 0.98). The within-expert mean area differences were slightly higher for Expert B and the differences observed between the segmentations done by the two experts were higher in mean absolute value than those observed within-experts in the separate sessions. Nevertheless, all of the ADAD measurements lay within the standard deviation of each other. The low p-values obtained from the paired Wilcoxon test (p<0.05) indicate that there were significant differences in segmented drusen area between the two readers and between the two sessions for the first reader (A). Considering the high correlation coefficients of the measurements and low average area differences, these low p-values may have been produced by segmentation interpretation differences from the readers, and from the same reader at different times (as we can see for Expert A), such as a reader consistently estimating the drusen areas to be slightly higher than another one.
Table 1.
Within-expert and between-expert correlation coefficients (cc), paired Wilcoxon test p-values and mean absolute drusen area differences.
| Methods compared | Number of eyes/drusen present B-scans | cc | p-value | ADAD [μm] (mean, std) | ADAD [%] (mean, std) |
|---|---|---|---|---|---|
| Expert A1- Expert A2 | 4/340 | 0.97 | 0.0001 | 8.33 ± 9.50 | 12.38 ± 16.55 |
| Expert B1- Expert B2 | 4/340 | 0.98 | 0.73 | 9.64 ± 6.53 | 14.41 ± 12.24 |
| Expert A1&2- Expert B1&2 | 4/680 | 0.97 | 0.013 | 9.98 ± 9.49 | 14.17 ± 14.54 |
Table 2 shows the within-expert and between-expert agreement in terms of overlap ratio (OR). The manual segmentations drawn by expert A were slightly more consistent between the two sessions that those drawn by expert B in average, and the overlapping area was slightly higher for segmentations drawn by the same expert than when comparing areas drawn by different experts. Nevertheless, all measurements lay within the standard deviation of each other.
Table 2.
Overlap ratio evaluation between the manual segmentations.
| Methods compared | Number of eyes/drusen present B-scans | Overlap ratio [%] (mean, std) |
|---|---|---|
| Expert A1- Expert A2 | 4/340 | 81.08 ± 10.46 |
| Expert B1- Expert B2 | 4/340 | 80.73 ± 8.73 |
| Expert A1&2- Expert B1&2 | 4/680 | 79.24 ± 9.65 |
Table 3 shows the agreement between the automated segmentation and the gold standard for the same dataset of 4 eyes employed in the reader agreement measurement and for the complete dataset of 143 eyes. For the smaller dataset, the correlation coefficient between automated segmentations and gold standard (mean segmentation from the 4 manual segmentations) was very high (0.97), and similar to those observed within-experts (0.97 and 0.98) and between-experts (0.97) for the same dataset. The ADAD values were also very similar to those observed for the readers and within their measured standard deviation. The standard deviation values are in the order of the mean values because the segmentation results obtained from different methods resulted very similar, both when comparing two different manual segmentations or manual and automated segmentation results. The logic behind this is that since we are measuring the differences between two segmentation results from the same cases, a minimum requirement for us to say that they are similar is that the 95% of those differences for the population of tested cases includes the 0 value (which would indicate that the results are exactly the same). There are still differences in the segmentation methods as indicated by the mean values, but those differences are small when compared to the difference ranges, which also include the 0 value. The similar mean and standard deviation values in the inter-reader and intra-reader agreement assessment indicates that we might expect a deviation in the differences of two manual segmentations on the same order as their mean differences, which makes sense since they are drawn in the same set of images. The similar observed ranges of mean and standard deviation differences between automated and manual segmentations indicate that the automated method thus appears to closely represent the segmentation drawn by an average user (our gold standard in this case) in the same ranges as different readers or even the same reader at different sessions would agree on their manual segmentations for the given test. For the larger dataset of 143 eyes, the differences found between the automated segmentation and gold standard (segmentation from a third reader) were higher, but they showed very high correlation and their distribution still lay within the limits described for expert agreement. The correlation between areas of automated and gold standard segmentation was also very high for both datasets, and also in the same ranges when comparing different manual segmentations. The Wilcoxon p-values indicate that statistical differences could not be claimed between the distribution of areas of automated segmentations and an average manual segmentation in the first dataset. However, statistical differences (p<0.05) were found in the distribution when compared to manual drawings by a third expert in the second dataset. In the same way as for the inter-reader and intra-reader comparisons, considering the high correlation values, this might be due to the segmenting approach of a reader, as for a reader constantly over-estimating or under-estimating drusen borders.
Table 3.
Correlation coefficients (cc), paired Wilcoxon test p-values and absolute drusen area differences between the automated segmentation method (Aut. Seg.) and gold standard (GS).
| Methods compared | Number of eyes/drusen present B-scans | cc | p-value | ADAD [μm] (mean, std) | ADAD [%] (mean, std) |
|---|---|---|---|---|---|
| Aut. Seg. - GS | 4/340 | 0.97 | 0.48 | 10.29 ± 8.9 | 15.70 ± 15.50 |
| Aut. Seg. - GS | 143/143 | 0.94 | 0.006 | 19.97 ± 14.68 | 23.77 ± 13.8 |
Table 4 shows the overlap ratio (OR) between the automated segmentation and gold standard for the two datasets. For the dataset consisting in 4 eyes, the mean OR demonstrates that our method can obtain relatively high segmentation accuracy when compared to the gold standard, and its standard deviation was similar to that within and between experts. This suggests that the discrepancies in OR between the hand-drawn segmentations are comparable to those observed between the segmentation produced by our algorithm and gold standard. The mean OR observed in the dataset consisting in 143 eyes was lower but still showed sufficient overlap in the segmentations, being within the limits established by the smaller dataset.
Table 4.
Overlap ratio evaluation between the automated segmentation method (Aut. Seg.) and gold standard (GS).
| Methods compared | Number of eyes/drusen present B-scans | Overlap ratio [%] (mean, std) |
|---|---|---|
| Aut. Seg. - GS | 4/340 | 76.33 ± 11.29 |
| Aut. Seg. - GS | 143/143 | 67.18 ± 9.14 |
Fig. 9 shows two segmentation results for drusen with a convex, medium reflectivity and nonhomogeneous pattern. The regions remarked with yellow lines are the segmented drusen. The blue and red lines are the estimated RNFL boundary and RPE layer, respectively. Fig. 9 indicates that for the most common drusen pattern, the algorithm can effectively segment the drusen.
Fig. 9.
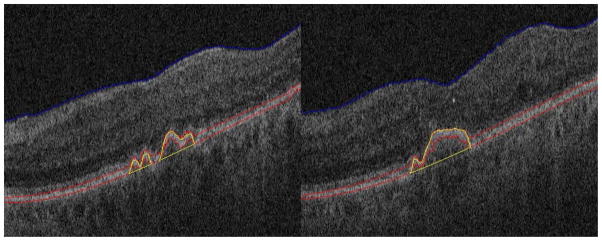
Segmentation results for drusen with convex, medium reflectivity, nonhomogeneous pattern
Fig. 10 shows two segmentation results for drusen with convex, high reflectivity and homogeneous pattern. Since the reflectivity of drusen is similar with that of the RPE layer, it is difficult to segment the RPE layer correctly. Specifically, the posterior RPE border was difficult to estimate. In our algorithm, the middle axes of the RPE layer is used to find drusen. Although the convexity of the posterior RPE border is difficult to estimate, the convexity of the anterior RPE border is easy to estimate. Thus, the middle axes of the RPE layer will be convex for the drusen with high reflectivity and a homogeneous pattern.
Fig. 11 shows two segmentation results for small drusen. For these two images, the IS/OS layers have similar reflectivity with the RPE layers, and the IS/OS layer is spatially close to the RPE layer. From Fig. 11, it can be seen that although the RPE layer estimation (the red lines) is not very accurate due to the confounding influence of the IS/OS layers, our algorithm can still obtain good segmentation results.
Fig. 11.
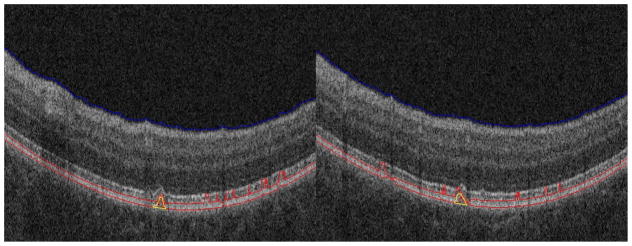
Segmentation results for small drusen with high reflectivity IS/OS layers
Fig. 12 shows that even when estimation of the boundary of the RNFL is not correct, the algorithm is effective. This is one of the reasons that RNFL removal is part of the image processing pipeline.
Fig. 12.
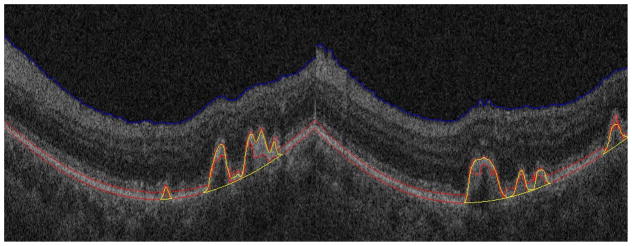
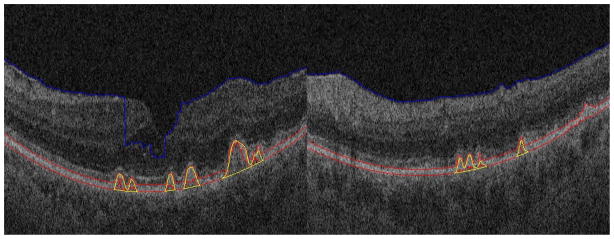
Drusen segmentation results of one patient
Discussion
The introduction of SD-OCT into clinical practice can dramatically improve the assessment of patients with AMD, since drusen, a key abnormality in the disease, can now be assessed volumetrically and objectively. Measurement of drusen on SD-OCT may become an important imaging biomarker to enable sensitive assessment for change in disease status—response to treatment or progression. At present, drusen are assessed qualitatively on CFP, but such assessment is subject to human variation and subtle changes in number or size of drusen lesions may not be noticed by the physician evaluating CFP images. Individual drusen are not routinely measured on SD-OCT since doing this by hand is time-consuming and few automated methods are available commercially. In addition, there are different types of drusen, some more or less amenable to automated segmentation. Khanifar et al. (2008) categorized drusen ultrastructure using SD-OCT according to four morphologic parameters: shape, predominant internal reflectivity, homogeneity, and presence of overlying hyper-reflective foci. Seventeen different drusen patterns were found in 120 total drusen. The most common were convex homogeneous drusen with medium internal reflectivity and no overlying hyper-reflective focus. Some patterns, such as drusen with high reflectivity IS/OS layers (Fig. 11) are challenging to segment automatically with current image processing methods.
Other challenges have hindered work thus far in automatically segmenting drusen. Some drusen obscure portions of the RPE layers. In addition, the IS/OS retinal layers are often contiguous with the RPE and there is abundant noise in low-SNR OCT images which hinders accurate segmentation of RPE.
We have described a method for automatic segmentation of drusen on SD-OCT images, and it addresses the several unsolved challenges emerging from the prior work: (1) obscuration by drusen of portions of the image needed for accurate estimation of RPE layers, (2) noise in low-SNR OCT images which challenges accurate segmentation of the RPE, (3) drusen with reflectivity similar with that of the RPE layer which makes it difficult to segment the RPE layer correctly, and (4) the IS/OS layers have similar reflectivity as RPE. Our method, which estimates the RPE layer through interpolation and fitting procedures, overcomes these challenges to some degree. By finding the middle axes of the RPE layer, our method is less sensitive to regional areas of obscuration of RPE by drusen (Figs. 9–12). The method includes a bilateral filtering denoising step which addresses the challenge of reliably detecting the RPE. Although bilateral filtering might not be optimal for speckle denoising in SD-OCT, it has a relatively low time complexity and acceptable performance for the needs of our segmentation algorithm. It is also known that a pre-processing noise filtering step can increase SNR and potentially the resulting accuracy of the segmentations, but there is a trade-off in the degrading of the spatial resolution that could also produce the opposite effect. In the future, we plan on investigating the effect of adopting more effective denoising methods to improve the performance of our method. The method can also detect drusen in cases where drusen and RPE have similar reflectivity (Fig. 10); in such cases, the IS/OS layer is similar reflectivity to RPE and thus difficult to separate from RPE. Our algorithm can still obtain relatively good segmentation results (Fig. 11). The method includes a pre-processing step to remove the RNFL, so even if the boundary of the RNFL is erroneously estimated, the drusen segmentation method can be successful (Fig. 12).
A novel aspect of the method is inclusion of analysis of the drusen in an en face projection to eliminate false positive drusen. Not only is this useful to improve the accuracy of the method, it provides a useful visualization to physicians, similar to the CFP view with which they are familiar (Fig. 7), and it also provides a means of computing additional imaging biomarkers for drusen evaluation, such as drusen area. In the future, we could calculate other drusen features from these images, such as shape.
Since hand-drawn drusen segmentations are reader-dependent and not perfect, we included an analysis characterizing the segmentation differences produced by two experts and at two different sessions on 340 drusen-present b-scans obtained from 4 different eyes. Such characterization gave us a reference to compare to when evaluating the segmentations produced by our automated method. The experts did vary in their segmentations (Table 1 and Table 2) likely due to the fact that the boundaries of RPE layers are obscured by noise and low resolution in the images, producing discrepancies between the two experts and also at different times within the same expert. The mean of the segmentations drawn twice by the two experts established our gold standard when evaluating our automated method. The quantitative evaluation of the automated drusen segmentations produced by our method showed high agreement with the gold standard and comparable to the results obtained from different readers (Table 3 and Table 4). While there were differences in the segmented drusen areas between our method and the hand-drawn segmentations, those differences were comparable to those observed between and within the experts. There was high overlap ratio between our method and the gold standard, and also comparable to those observed within and between experts. Our method was also evaluated for a larger patient dataset (143 drusen-present b-scans obtained from 143 different eyes) where our gold standard was obtained from the segmentations drawn by a third expert. Although the differences between automated method and gold standard were higher in this second dataset, those differences were still low and within the limits established by the measured reader agreement.
Our method also appears promising for deriving quantitative image biomarkers from the drusen segmentations that may be useful for characterizing the status of disease in AMD patients. We produced a number of quantitative values to characterize drusen, including drusen thickness, area, and volume. These metrics vary regionally in the retina, as seen by thickness and surface maps we produced (Fig. A2), which may be useful for characterizing the disease in the future. Though our preliminary evaluation was too small to make any conclusive statements about the value of our quantitative image features to characterizing disease, we have showed that we can generate quantitative temporal summaries of the amount of drusen (Figs. A6 and A7), and these summaries can show different patterns of disease progression, such as continued progression or waxing/waning. Such summaries can be helpful to ophthalmologists in following disease objectively, and with addition study, may even prove useful for characterizing disease in AMD patients. There are limitations in our study. First, there is no absolute gold standard for segmentation of retinal drusen; these lesions are circumscribed by experts, who invariably disagree on how they draw the margins of these lesions. We thus evaluated the variance in the in the assessment of the two observers in performing this task. Ideally, we would have used more experts, but this was not possible given the time-intensive nature of the task.
A second limitation is that there was substantial intra-observer and inter-observer segmentation variance, which limited the quality of the gold standard. On the other hand, this variability in the manual segmentation within and between experts emphasizes the utility of an automatic segmentation method which would produce reproducible results comparable to an average expert, from which quantitative features about drusen could be subsequently computed. Our proposed method would provide a drusen segmentation approach to evaluate drusen area, volume and number which could be very useful in assessing change in these features over time as indicators of disease progression or response. These quantitative features may also carry important information of disease that will be investigated in future work.
A third limitation is that our algorithm makes occasional segmentation errors. Estimation of the RPE is difficult at the image borders where there is no normal RPE information. In addition, very small drusen are not detected, which underestimates the total disease burden. As drusen can be extremely small and there are intrinsic limitations due to noise in SD-OCT, it would be difficult to achieve substantial improvements in sensitivity without concomitant decrease in specificity (increase in false positive drusen). For example, the drusen at the edge of the image are incompletely visualized, as shown in Figs. A3b and d, and segmentation fails. The reason is that the polynomial fitting of the normal RPE is difficult at the image borders where there is no normal RPE information; this can be seen for the drusen marked with the orange triangle in Fig. 13a. In addition, very small drusen maybe be lost, as shown in Fig. A5 and in the drusen marked with the orange triangle in Fig. 13b. Since there is noise artifact in SD-OCT images, some drusen will also be lost during the denoising process.
Fig. 13.
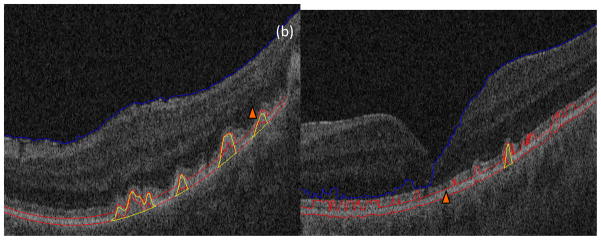
Two segmentation mistakes. (a) Drusen loss in the image border. (b) Loss of very small drusen
Recent works in SD-OCT layer segmentation have pointed out the advantages of three-dimensional retinal layer segmentation in SD-OCT cubes over a B-scan-by-B-scan segmentation algorithm. Future work includes further improvements in the segmentation technique considering a fully three-dimensional segmentation of the initial drusen. The non-uniform A-scan sampling density in the lateral and azimuthal directions (512 A-scans per 6 mm., and 128 A-scans per 6 mm., uniformly spaced in those directions) is not a major concern in the segmentation algorithm presented here, since drusen where first identified B-scan-by-B-scan (collection of A-scans at each lateral position), and further drusen refinement was set so that only drusen with an azimuthal extent of at least 46.9μm would be considered. This refinement threshold guaranteed than any larger drusen would be observed in two consecutive azimuthal scans given the A-scan sampling density; however, drusen smaller than this threshold would be lost. The consideration of A-scan sampling density in the azimuthal direction will be a major issue to address in a fully three-dimensional implementation of the algorithm.
A final limitation is that our evaluation of the import of the quantitative features of drusen with regard to clinical disease status is preliminary; further studies will be needed to validate the utility of such quantitative imaging measures.
4. Conclusions
We have developed a novel automated drusen segmentation algorithm for SD-OCT images, which incorporates the 3D spatial information in retinal structures and information in projection images of drusen. Experimental results demonstrated that the algorithm was able to effectively segment different patterns of drusen. The qualitative features we extract from drusen may be clinically useful for evaluating the progress of these lesions. The algorithm does have limitations in that drusen at the edges of the images and small drusen can be missed. Future refinement and development of this algorithm will be pursued in an attempt to improve detection and segmentation of these drusen.
Highlights.
We describe an automatic drusen segmentation method for SD-OCT retinal images.
We developed a novel method of retinal projection to generate an en face retinal image from SD-OCT images.
147 different eyes were utilized to test our method.
Experimental results demonstrate the effectivity of our method.
The qualitative and quantitative features extracted from drusen may be clinically useful for evaluating the progress of these lesions.
Acknowledgments
The authors sincerely thank Noy Cohen and Audrey K Ellerbee for their valuable input into this work, and thank Jarrett Rosenberg for the statistic analysis of drusen segmentation results. This work was supported by a grant from the Bio-X Interdisciplinary Initiatives Program of Stanford University, a grant from the National Cancer Institute, National Institutes of Health, grant No. U01-CA-142555, and grants from the National Natural Science Foundations of China under Grant No. 60805003 and Qing Lan Project. (a) (b)
Appendix 1. Threshold determination for RPE layer estimation
Let H(i), i = 0,1,···,L, be the image histogram, where L is maximum gray level (L=255 in this paper). H(i) represents the number of pixels taking the value i. be the cumulative histogram. The threshold T for the RPE layer estimation can be determined by
| (A.1) |
where the constant
| (A.2) |
where w is the width of the image (w=512 in this paper), and tr represents the approximate thickness of RPE layers (tr = 20μm in this paper). The axial resolution , where d and h denote the depth of SD-OCT cubes in the axial dimension and the height of the image, respectively. In this paper, d=2mm and h=1024. The positive constant k is used by considering the RNFL and the slant of RPE layers, which will increase the number of bright pixels. Here k=5.
Appendix 2. Pilot study of Quantitative Analysis of Drusen
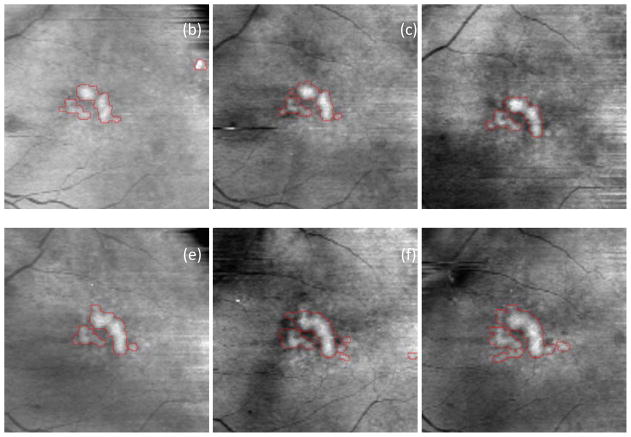
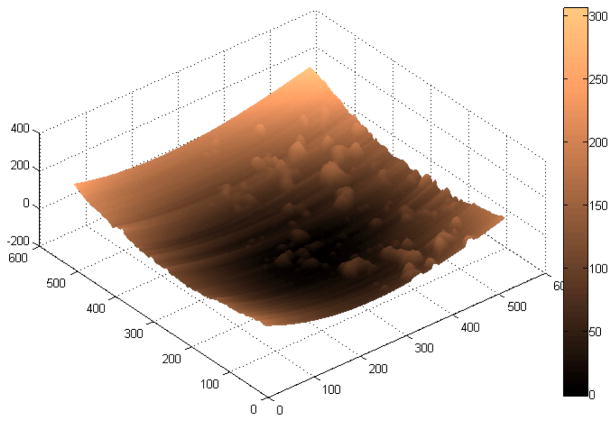
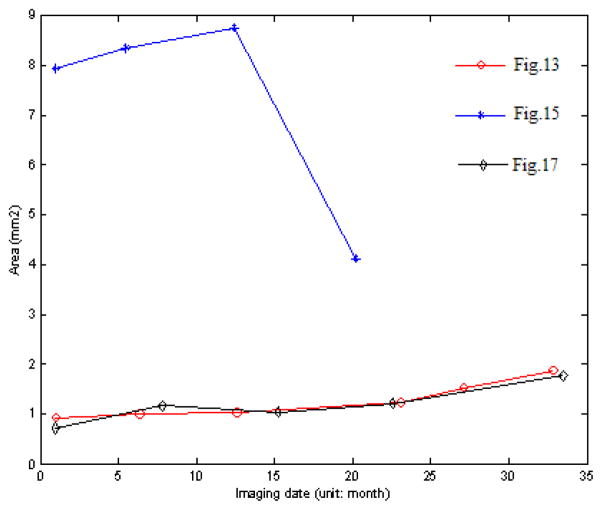
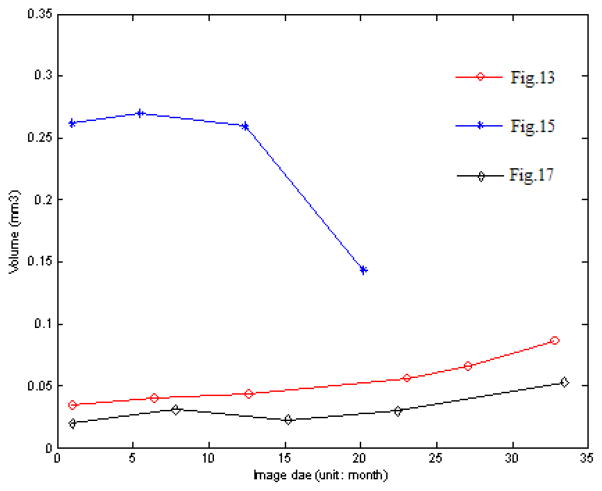
Fig. A1 shows the drusen segmentation results on six different dates and Fig. A2 shows the drusen thickness map and the drusen surface map from one of the time points (from that shown in Fig. A1d). The thickness map and the surface map demonstrate the drusen from the viewpoints of the 2D and 3D, respectively. Two quantitative imaging biomarkers, drusen area and volume, are plotted with red curves in Fig. A6 and Fig. A7, respectively, where drusen area is defined on the projection image, such as the areas marked with red lines in Fig. A1. Both the visual results (Fig. A1) and the quantitative evaluation (Figs. A6&A7) demonstrate that the drusen became larger, indicating disease progression. However, the extent of progression in the disease is more compactly and quantitatively summarized in the plots, Fig. A3. These plots show the drusen segmentation results in a patient on four different dates, respectively. The blue curves in Figs. A6&A7 are the drusen area and volume of Fig. A3, respectively. The quantitative summary readily shows that the drusen became larger, then smaller, demonstrating the dynamic nature of drusen over time in AMD patients. The change of area and volume may be a useful tool for ophthalmologists to predict and evaluate the effects of various treatments. Fig. A4 shows the upper surface rendering of the RPE layer of Fig. A3a, where the “mountains” correspond to the drusen.
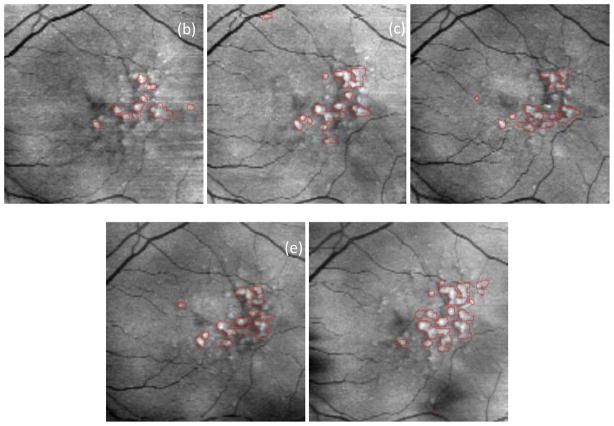
Fig. A5 shows the drusen segmentation results on projection images for the left eye of a 71-year-old male patient. The drusen area and volume in the center regions of Fig. A5 are shown in Figs. A6&A7, respectively.
Fig. A1.
Drusen segmentation results on projection images for the left eye of an 88-year-old female patient. The intervals of imaging of (a)–(f) are shown in Fig. A6.
Fig. A2.
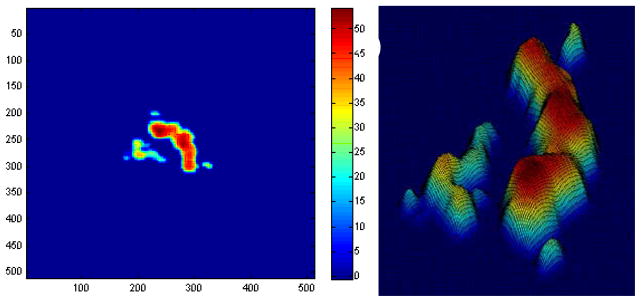
Drusen thickness map (a) and drusen surface (b) of Fig. A1d. The colors represent the drusen height.
Fig. A3.

Drusen segmentation results on projection images for the left eye of an 83-year-old female patient. The intervals of imaging of (a)–(d) are shown in Fig. A6.
Fig. A4.
Upper surface rendering of the RPE layer of Fig. A3a
Fig. A5.
Drusen segmentation results on projection images for the left eye of a 71-year-old male patient. The intervals of imaging of (a)–(e) are shown in Fig. A6.
Fig. A6.
Change of drusen area
Fig. A7.
Change of drusen volume
Footnotes
Publisher's Disclaimer: This is a PDF file of an unedited manuscript that has been accepted for publication. As a service to our customers we are providing this early version of the manuscript. The manuscript will undergo copyediting, typesetting, and review of the resulting proof before it is published in its final citable form. Please note that during the production process errors may be discovered which could affect the content, and all legal disclaimers that apply to the journal pertain.
References
- Abdelsalam A, Del Priore L, Zarbin MA. Drusen in age-related macular degeneration: pathogenesis, natural course, and laser photocoagulation-induced regression. Surv Ophthalmol Vol. 1999;44:1–29. doi: 10.1016/s0039-6257(99)00072-7. [DOI] [PubMed] [Google Scholar]
- Bower BA, Chiu SJ, Davies E, Davis AM, Zawadzki RJ, Fuller AR, Wiley DF, Izatt JA, Toth CA. Development of quantitative diagnostic observables for age-related macular degeneration using Spectral Domain OCT. Proc SPIE. 2007;6426:64260W. [Google Scholar]
- Brandon L, Hoover A. Drusen detection in a retinal image using multi-level analysis. Proc. International Conference on Medical Image Computing and Computer-Assisted Intervention; 2003. pp. 618–625. [Google Scholar]
- Buades A, Coll B, Morel JM. A non-local algorithm for image denoising. Proc IEEE Conf Computer Vision and Pattern Recognition (CVPR) 2005;2:60–65. [Google Scholar]
- Checco P, Corinto F. CNN-based algorithm for drusen identification. Proc. IEEE International Symposium on Circuits and Systems; 2006. pp. 2181–2184. [Google Scholar]
- Davis MD, Gangnon RE, Lee LY, Hubbard LD, Klein BE, Klein R, Ferris FL, Bressler SB, Milton RC Age-Related Eye Disease Study Group. The age-related eye disease study severity scale for age-related macular degeneration: AREDS Report No. 17. Arch Ophthalmol. 2005;123(11):1484–98. doi: 10.1001/archopht.123.11.1484. [DOI] [PMC free article] [PubMed] [Google Scholar]
- Drexler W, Sattmann H, Hermann B, Ko TH, Stur M, Unterhuber A, Scholda C, Findl O, Wirtitsch M, Fujimoto JG, Fercher AF. Enhanced visualization of macular pathology with the use of ultrahigh-resolution optical coherence tomography. Arch Ophthalmol. 2003;121(5):695–706. doi: 10.1001/archopht.121.5.695. [DOI] [PubMed] [Google Scholar]
- Duanggate C, Uyyanonvara B. A review of automatic drusen detection and segmentation from retinal images. The 3rd International Symposium on Biomedical Engineering; 2008. pp. 222–225. [Google Scholar]
- Fang L, Li S, Nie Q, Izatt JA, Toth CA, Farsiu S. Sparsity based denoising of spectral domain optical coherence tomography images. Biomed Opt Express. 2012;3(5):927–942. doi: 10.1364/BOE.3.000927. [DOI] [PMC free article] [PubMed] [Google Scholar]
- Farsiu S, Chiu SJ, Izatt JA, Toth CA. Fast detection and segmentation of drusen in retinal optical coherence tomography images. Ophthalmic Technologies XVIII, Proc of SPIE. 2008;6844:68440D.1–68440D.12. [Google Scholar]
- Freeman SR, Kozak I, Cheng L, Bartsch DU, Mojana F, Nigam N, Brar M, Yuson R, Freeman WR. Optical coherence tomography-raster scanning and manual segmentation in determining drusen volume in age-related macular degeneration. Retina. 2010;30(3):431–435. doi: 10.1097/IAE.0b013e3181bd2f94. [DOI] [PubMed] [Google Scholar]
- Freund DE, Bressler N, Burlina P. Automated detection of drusen in the macula. 6th IEEE International Symposium on Biomedical Imaging; 2009. pp. 61–64. [Google Scholar]
- Gargesha M, Jenkins MW, Rollins AM, Wilson DL. Denoising and 4D visualization of OCT images. Opt Express. 2008;16(16):12313–12333. doi: 10.1364/oe.16.012313. [DOI] [PMC free article] [PubMed] [Google Scholar]
- Gorczynska I, Srinivasan VJ, Vuong LN, Chen RWS, Liu JJ, Reichel E, Wojtkowski M, Schuman JS, Duker JS, Fujimoto JG. Projection OCT fundus imaging for visualizing outer retinal pathology in non-exudative age-related macular degeneration. Br J Ophthalmol. 2009;93(5):603–609. doi: 10.1136/bjo.2007.136101. [DOI] [PMC free article] [PubMed] [Google Scholar]
- Gregori G, Wang F, Rosenfeld PJ, Yehoshua Z, Gregori NZ, Lujan BJ, Puliafito CA, Feuer WJ. Spectral domain optical coherence tomography imaging of drusen in non-exudative age-related macular degeneration. Ophthalmology. 2011;118(7):1373–1379. doi: 10.1016/j.ophtha.2010.11.013. [DOI] [PMC free article] [PubMed] [Google Scholar]
- In S. TAP and VIP Report. 2. 2003. Photodynamic therapy of subfoveal choroidal neovascularizaton with verteporfin fluorescein angiographic guidelines for evaluation and treatment. [DOI] [PubMed] [Google Scholar]
- Iwama D, Hangai M, Ooto S, Sakamoto A, Nakanishi H, Fujimura T, Domalpally A, Danis RP, Yoshimura N. Automated assessment of drusen using three-dimensional spectral-domain optical coherence tomography. Investigative Ophthalmology & Visual Science. 2012;53(3):1576–1583. doi: 10.1167/iovs.11-8103. [DOI] [PubMed] [Google Scholar]
- Jager RD, Mieler WF, Miller JW. Age-related macular degeneration. N Engl J Med Vol. 2008;358:2606–2617. doi: 10.1056/NEJMra0801537. [DOI] [PubMed] [Google Scholar]
- Jain N, Farsiu S, Khanifar AA, Bearelly S, Smith RT, Izatt JA, Toth CA. Quantitative comparison of drusen segmented on SD-OCT versus drusen delineated on color fundus photographs. Investigative Ophthalmology & Visual Science. 2010;51(10):4875–4883. doi: 10.1167/iovs.09-4962. [DOI] [PMC free article] [PubMed] [Google Scholar]
- Jiao S, Knighton R, Huang X, Gregori G, Puliafito C. Simultaneous acquisition of sectional and fundus ophthalmic images with spectral-domain optical coherence tomography. Optics Express. 2005;13(2):444–452. doi: 10.1364/opex.13.000444. [DOI] [PubMed] [Google Scholar]
- Khanifar AA, Koreishi AF, Izatt JA, Toth CA. Drusen ultrastructure imaging with spectral domain optical coherence tomography in age-related macular degeneration. Ophthalmology. 2008;115(11):1883–1890. e1. doi: 10.1016/j.ophtha.2008.04.041. [DOI] [PMC free article] [PubMed] [Google Scholar]
- Klein R, Davis MD, Magli YL, Segal P, Klein BE, Hubbard L. The Wisconsin age-related maculopathy grading system. Ophthalmology. 1991;98(7):1128–1134. doi: 10.1016/s0161-6420(91)32186-9. [DOI] [PubMed] [Google Scholar]
- Klein R, Klein B, Jensen S, Meuer S. The five-year incidence and progression of age-related maculopathy: the Beaver Dam Eye Study. Ophthalmology. 1997;104(1):7–21. doi: 10.1016/s0161-6420(97)30368-6. [DOI] [PubMed] [Google Scholar]
- Lee N, Laine AF, Smith TR. Learning non-homogeneous textures and the unlearning problem with application to drusen detection in retinal images. 5th IEEE International Symposium on Biomedical Imaging; 2008. pp. 1215–1218. [Google Scholar]
- Liang Z, Wong DWK, Liu J, Chan KL, Wong TY. Towards automatic detection of age-related macular degeneration in retinal fundus images. 32nd Annual International Conference of the IEEE Engineering in Medicine and Biology Society; 2010. pp. 4100–4103. [DOI] [PubMed] [Google Scholar]
- Parvathi SS, Devi N. Automatic drusen detection from colour retinal images. International Conference on Computational Intelligence and Multimedia Applications; 2007. pp. 377–381. [Google Scholar]
- Quellec G, Russell SR, Abramoff MD. Optimal filter framework for automated, instantaneous detection of lesions in retinal images. IEEE Transactions on Medical Imaging. 2011;30(2):523–533. doi: 10.1109/TMI.2010.2089383. [DOI] [PubMed] [Google Scholar]
- Rapantzikos K, Zervakis M. Nonlinear enhancement and segmentation algorithm for the detection of age-related macular degeneration (AMD) in human eye’s retina. Proc. International Conference on Image Processing; 2001. pp. 1055–1058. [Google Scholar]
- Rapantzikos K, Zervakis M, Balas K. Detection and segmentation of drusen deposits on human retina; potential in the diagnosis of age-related macular degeneration. Medical Image Analysis. 2003;7(1):95–108. doi: 10.1016/s1361-8415(02)00093-2. [DOI] [PubMed] [Google Scholar]
- Rogowska J, Brezinski ME. Evaluation of the adaptive speckle suppression filter for coronary optical coherence tomography imaging. IEEE Trans Med Imaging. 2000;19(12):1261–1266. doi: 10.1109/42.897820. [DOI] [PubMed] [Google Scholar]
- Sbeh ZB, Cohen LD, Mimoun G, Coscas G, Soubrane G. An adaptive contrast method for segmentation of drusen. International Conference on Image Processing; 1997. pp. 255–258. [Google Scholar]
- Sbeh ZB, Cohen LD, Mimoun G, Coscas G. A new approach of geodesic reconstruction for drusen segmentation in eye fundus images. IEEE Transactions on Medical Imaging. 2001;20(12):1321–1333. doi: 10.1109/42.974927. [DOI] [PubMed] [Google Scholar]
- Shin DS, Javornik NB, Berger JW. Computer-assisted, interactive fundus image processing for macular drusen quantitation. Ophthalmology. 1999;106(6):1119–1125. doi: 10.1016/S0161-6420(99)90257-9. [DOI] [PubMed] [Google Scholar]
- Smith RT, Chan JK, Nagasaki T, Ahmad UF, Barbazetto I, Sparrow J, Figueroa M, Merriam J. Automated detection of macular drusen using geometric background leveling and threshold selection. Arch Ophthalmol. 2005a;123(2):200–206. doi: 10.1001/archopht.123.2.200. [DOI] [PMC free article] [PubMed] [Google Scholar]
- Smith RT, Chan JK, Nagasaki T, Sparrow JR, Barbazetto I. A method of drusen measurement based on reconstruction of fundus background reflectance. Br J Ophthalmol. 2005b;89(1):87–91. doi: 10.1136/bjo.2004.042937. [DOI] [PMC free article] [PubMed] [Google Scholar]
- Srinivasan VJ, Wojtkowski M, Witkin AJ, Duker JS, Ko TH, Carvalho M, Schuman JS, Kowalczyk A, Fujimoto JG. High-definition and 3-dimensional imaging of macular pathologies with high-speed ultrahigh-resolution optical coherence tomography. Ophthalmology. 2006;113(11):2054–2065. e3. doi: 10.1016/j.ophtha.2006.05.046. [DOI] [PMC free article] [PubMed] [Google Scholar]
- Stopa M, Bower BA, Davies E, Izatt JA, Toth CA. Correlation of pathologic features in spectral domain optical coherence tomography with conventional retinal studies. Retina. 2008;28(2):298–308. doi: 10.1097/IAE.0b013e3181567798. [DOI] [PubMed] [Google Scholar]
- Thaibaoui A, Raji A, Bunel P. A fuzzy logic approach to drusen detection in retinal angiographic images. 15th International Conference on Pattern Recognition; 2000. pp. 748–751. [Google Scholar]
- Tomasi C, Manduchi R. Bilateral filtering for gray and color images. Proceedings of the International Conference on Computer Vision (ICCV); 1998. pp. 839–846. [Google Scholar]
- Toth CA, Farsiu S, Chiu SJ, Khanifar AA, Izatt JA. Automatic drusen segmentation and characterization in spectral domain optical coherence tomography (SDOCT) images of AMD eyes. Association for Research in Vision and Ophthalmology (ARVO) Annual Meeting; 2008. p. E-Abstract 5394. [Google Scholar]
- Wojtkowski M, Srinivasan V, Fujimoto JG, Ko T, Schuman JS, Kowalczyk A, Duker JS. Three-dimensional retinal imaging with high-speed ultrahigh-resolution optical coherence tomography. Ophthalmology. 2005;112(10):1734–1746. doi: 10.1016/j.ophtha.2005.05.023. [DOI] [PMC free article] [PubMed] [Google Scholar]
- Yi K, Mujat M, Park BH, Sun W, Miller JW, Seddon JM, Young LH, de Boer JF, Chen TC. Spectral domain optical coherence tomography for quantitative evaluation of drusen and associated structural changes in non-neovascular age-related macular degeneration. Br J Ophthalmol. 2009;93(2):176–181. doi: 10.1136/bjo.2008.137356. [DOI] [PMC free article] [PubMed] [Google Scholar]


