

Abstract
Objective
ABCB1 encodes the multi-drug efflux pump P-glycoprotein (P-gp) and has been implicated in multi-drug resistance. We comprehensively evaluated this gene and flanking regions for an association with clinical outcome in epithelial ovarian cancer (EOC).
Methods
The best candidates from fine-mapping analysis of 21 ABCB1 SNPs tagging C1236T (rs1128503), G2677T/A (rs2032582), and C3435T (rs1045642) were analysed in 4,616 European invasive EOC patients from thirteen Ovarian Cancer Association Consortium (OCAC) studies and The Cancer Genome Atlas (TCGA). Additionally we analysed 1,562 imputed SNPs around ABCB1 in patients receiving cytoreductive surgery and either ‘standard’ first-line paclitaxel-carboplatin chemotherapy (n=1,158) or any first-line chemotherapy regimen (n=2,867). We also evaluated ABCB1 expression in primary tumours from 143 EOC patients.
Result
Fine-mapping revealed that rs1128503, rs2032582, and rs1045642 were the best candidates in optimally debulked patients. However, we observed no significant association between any SNP and either progression-free survival or overall survival in analysis of data from 14 studies. There was a marginal association between rs1128503 and overall survival in patients with nil residual disease (HR 0.88, 95% CI 0.77-1.01; p=0.07). In contrast, ABCB1 expression in the primary tumour may confer worse prognosis in patients with sub-optimally debulked tumours.
Conclusion
Our study represents the largest analysis of ABCB1 SNPs and EOC progression and survival to date, but has not identified additional signals, or validated reported associations with progression-free survival for rs1128503, rs2032582, and rs1045642. However, we cannot rule out the possibility of a subtle effect of rs1128503, or other SNPs linked to it, on overall survival.
Introduction
Over the past three decades, significant advances have been made in chemotherapy for ovarian cancer, and the combination of cytoreductive surgery followed by the doublet of a taxane (paclitaxel 135 – 175 mg/m2) and carboplatin (AUC > 5), has been the most common regimen for primary treatment of this disease [1]. However, resistance to chemotherapy remains a major challenge to treatment, and although multidrug resistance (MDR) has been widely studied in in vitro models, the translational utility of this research remains elusive. The identification and analysis of genes relevant to MDR in patients may contribute to a better understanding of this phenomenon and potentially help circumvent this obstacle.
ABCB1, the most extensively studied ATP-binding cassette (ABC) transporter, encodes the multi-drug efflux pump P-glycoprotein (P-gp) and is involved in the transport of a wide range of anti-cancer drugs including paclitaxel [2, 3]. ABCB1, located at 7q21.12, is genetically very variable, and it is likely that single nucleotide polymorphisms (SNPs) in this gene may have significant effects on the expression and function of P-gp, and hence the absorption, metabolism and clearance of P-gp substrates. Of particular interest has been the nonsynonymous variant G2677T/A (rs2032582) which results in an amino acid change at codon 893 (Ala893Ser/Thr) in exon 21 and forms part of a common haplotype that includes two synonymous SNPs, C1236T (rs1128503) in exon 12 and C3435T (rs1045642) in exon 26. Studies evaluating allelic or haplotypic effects of these three SNPs on mRNA or protein expression in a wide range of human tissues have been extensively reviewed and found to be inconclusive [4, 5]. Likewise, association studies of ABCB1 polymorphisms in EOC cases receiving taxane-based chemotherapy regimens have to date produced conflicting and inconclusive results [6-11].
We evaluated ABCB1 SNPs and EOC disease progression and survival among 4,616 women participating in thirteen studies from the Ovarian Cancer Association Consortium (OCAC) [12] and The Cancer Genome Atlas (TCGA) (http://cancergenome.nih.gov/). We first queried the SNP(s) that could account for our reported association between rs2032582 and rs1128503 and outcome in the AOCS study [10, 11] by fine-mapping the ABCB1 locus in optimally debulked AOCS patients receiving standard first-line paclitaxel-carboplatin chemotherapy. We then analysed the best SNPs in a much larger cohort of patients with more mature clinical follow-up data from the OCAC and TCGA, and evaluated an additional 1,562 SNPs on chromosome 7 flanking ABCB1
Methods
Study subjects and ethics statement
EOC patients were from thirteen OCAC studies, and TCGA. European ancestry was determined using the program LAMP [13] to assign intercontinental ancestry based on the HapMap (release no. 22) genotype frequency data for European, or assumed to be of European ancestry based on self-report or geographic location where genetic markers were unavailable. Clinical definitions and criteria for progression across studies have been previously described [14]. All studies received approval from their respective human research ethics committees, and all OCAC participants provided written informed consent. Details of TCGA can be found at http://cancergenome.nih.gov/.
DNA extraction, genotyping, and imputation
DNA extraction, genotyping methods and quality assurance for all samples have been previously described [11]. Data for TCGA patients was downloaded through the TCGA data portal and assessed for ancestral outliers to determine those of European descent. Imputation of SNPs at the chromosome 7 locus was performed using minimac [15] following pre-phasing by MACH algorithm 1.0 [16] utilizing information from 70 ABCB1 SNPs genotyped in all European ovarian cancer patients on the Illumina Infinium iSelect array designed by the Collaborative Oncological Gene-environment Study (iCOGS) [17]. Genotypes were imputed to the European subset of the phased chromosomes from the 1000 Genome project (version 3). Genotyping methods and quality assurance of OCAC samples included on the iCOGs platform have been previously reported [17]. Imputation was performed for the ABCB1 gene and flanking sequence extending out to the first recombination peaks with a recombination rate greater than 40, and spanning 85,570,519bp – 88,736,135bp of chromosome 7 (NCBI build 37). We evaluated only those with minor allele frequency (MAF) >0.05 and reasonable imputation quality (imputed r2>0.3).
SNP selection and fine mapping
We used the Tagger program within Haploview [18] to select 18 ABCB1 tagging SNPs (Hapmap Phase II release #24) within a 60 kb region encompassing rs2032582, and genotyped these and our three previously reported SNPs (rs1128503, rs2032582, and rs1045642) [10, 11] in optimally debulked AOCS patients that met our inclusion criteria (n=433). SNPs were analysed both independently and in forward and backward log-additive stepwise Cox proportional hazards (PH) models adjusted for tumor stage and level of residual disease, using a conservative p-value of 0.05 to enter or exit the model [19]. We also investigated haplotype frequencies for all patients genotyped for these 21 SNPs (n=615) using the Beagle Genetic Analysis Software package v.3.3.2 for inferring haplotype phase or sporadic missing genotype data in unrelated individuals [20]. The likelihood ratio test was used to compare regression models of the three most common ABCB1 haplotypes (alternate models) versus the rs2032582 (null model) to test the likelihood that any observed association was due to haplotype effects.
ABCB1 expression analysis
RNA was prepared from 143 AOCS serous ovarian tumors obtained at surgery prior to chemotherapy using the QIAGEN RNeasy extraction kit (QIAGEN, Australia) and reverse transcribed as previously described [21]. Quantification of expression utilising TaqMan® assays [ABCB1 (ID Hs00184500_m1), GUSB (ID 4326320E), HPRT (ID 4326321E) and PGK1 (ID 4326318E)] were conducted in duplicate using a 7900HT Fast Real-Time PCR system. Relative expression was calculated by the (delta-delta) Ct method using RQ Manager (Applied Biosystems) as the geometric mean of the expression values against three control genes [22]. Values were log transformed and ABCB1 expression was analysed as a continuous variable using Cox regression. Expression values for significant associations were dichotomised into low vs. high for Kaplan-Meier analysis. We also analysed 374 TCGA serous EOC cases using publicly available data (http://tcga-data.nci.nih.gov/) [23].
Statistical analysis
Progression-free survival (PFS) was defined as the interval between the date of histological diagnosis and the first confirmed sign of disease progression or death, as previously described [14]. Overall survival (OS) was the interval between the date of histological diagnosis and death from any cause. To control for ascertainment bias, prevalent cases, defined as having an interval >12 months between the date of histological diagnosis and DNA collection, were excluded from the analysis.
Analysis of PFS and OS was restricted to European/non-Hispanic white invasive EOC patients of all histologies classified as ‘standard’ if they had ≥4 cycles of paclitaxel and carboplatin intravenously (IV) at 3-weekly intervals, or ‘all chemo’ if they had any chemotherapy regimen following cytoreductive surgery; the majority of women in the ‘standard’ cohort were known to have had paclitaxel at 175 or 135 mg/m2 and carboplatin AUC 5 or 6. Patients included in our previous report [11] were not excluded from the current analysis because patient outcome and treatment data has since been updated. To maximize the statistical power for analysis of the best fine-mapping SNPs in OCAC and TCGA studies, we combined cases with actual and well-imputed (r2 >0.9) genotypes where available.
Cox PH models were used to estimate the hazard ratios (HRs) and 95% confidence intervals (CIs) for PFS and OS associated with ABCB1 SNPs in EOC patients classified as ‘standard ’ and ‘all chemo’ for first-line chemotherapy. We evaluated potential confounders of PFS and observed a highly significant association between PFS and residual disease, tumor stage, histology and grade (log-rank p <0.0001; data not shown) and therefore included these covariates in all regression models. Additionally, OS analysis was adjusted for age at diagnosis. SNPs were modelled assuming log-additive effects by fitting the number or dosage score (imputed data) of rare alleles carried as a continuous covariate, and stratified by study. We observed a statistically significant interaction between the rs2032582 genotype and residual disease (p=0.001) and analysed SNPs for nil residual disease separately, as well as optimally (≤1 cm residual disease) and sub-optimally debulked (>1cm residual disease) patients. Between-study heterogeneity was assessed using the likelihood ratio test to compare regression models with and without a genotype-by-study interaction term. The median follow-up of the analysis cohort was estimated using the reverse Kaplan-Meier method [24]. All tests for association were two-tailed. The significance threshold for the fine-mapping study was p<0.05. However, a threshold of p<10-3 was used for the best fine-mapping candidate SNPs evaluated in the larger EOC cohort because we explored sixteen independent hypotheses according to chemotherapy regimen and debulking status. For the 1,562 imputed SNPs we used a modified Bonferroni adjustment that takes into account linkage disequilibrium (LD) between SNPs [25, 26], yielding a significance threshold of 4.6×10⁻⁴ required to keep the Type I error rate at 5%. All analyses were performed in STATA SE v. 11 (Stata Corp., USA), SPSS, and the R project for Statistical Computing v2.14 (http://www.r-project.org/).
Results
Details of study design, case ascertainment, and clinical characteristics of all women from participating OCAC studies have been described elsewhere [27, 28] and are summarized in Tables S1 and S2. A total of 4,942 European/non-Hispanic White women with invasive EOC and detailed clinical and treatment data were eligible for inclusion in the analysis. The median follow-up of the analysis cohort was 5.9 (95% CI 5.7 – 6.0) years. All genotype data included in this analysis conformed to quality assurance criteria for inclusion.
Progression-free survival (PFS) estimates from 18 ABCB1 tagging SNPs selected for preliminary fine-mapping, and the three coding SNPs (rs1128503, rs2032582, and rs1045642) analysed in a subset of patients with optimal debulking from the AOCS (residual disease ≤ 1 cm, n=433) are shown in Table 1. Nine SNPs that were significantly associated with PFS (p<0.05) in adjusted single-SNP analyses were then analysed by stepwise regression. Only rs2032582 remained significantly associated with PFS in forward stepwise modeling (p=0.03). Likewise, in the backward stepwise procedure, the sequential removal of each of the other eight SNPs successively improved the significance level of rs2032582 to that of the single SNP. The most informative model included one other SNP, rs4148738 (p=0.086) which is perfectly correlated with rs2032582 in the1000 Genomes reference population. We therefore concluded that rs2032582 best explains the observed association with PFS in this sample.
Table 1.
Independent SNP effects on progression-free survival in ABCB1 tagging SNPs selected for fine-mapping in optimally debulked AOCS cases (n=433)
| SNP | Gene Location | LD Block | bChr position | Unadjusted | aAdjusted | ||||
|---|---|---|---|---|---|---|---|---|---|
|
| |||||||||
| HR | 95% CI | P | HR | 95% CI | P | ||||
| rs7793196 | Intergenic | 1 | 86767498 | 1.06 | (0.84 -1.34) | 0.619 | 1.09 | (0.86 -1.37) | 0.47 |
| rs6946119 | 3’ Flank | 1 | 86773516 | 1.22 | (0.99 -1.51) | 0.064 | 1.15 | (0.94 -1.42) | 0.175 |
| rs6979885 | Intronic | 2 | 86782112 | 1.35 | (1.09 -1.68) | 0.007 | 1.26 | (1.02 -1.56) | 0.033 |
| rs2235048 | Intronic | 2 | 86783162 | 1.32 | (1.09 -1.61) | 0.004 | 1.26 | (1.05 -1.52) | 0.015 |
| rs1045642 | Exonic (sSNP) | 86783296 | 1.34 | (1.10 -1.62) | 0.003 | 1.25 | (1.03 -1.51) | 0.022 | |
| rs2032582 | Exonic (nsSNP) | 3 | 86805269 | 0.74 | (0.61 -0.88) | 0.001 | 0.74 | (0.62 -0.89) | 0.001 |
| rs4148738 | Intronic | 3 | 86807700 | 0.76 | (0.63 -0.92) | 0.006 | 0.79 | (0.65 -0.96) | 0.015 |
| rs10276603 | Intronic | 3 | 86816178 | 1.01 | (0.77 -1.34) | 0.919 | 1.07 | (0.81 -1.41) | 0.642 |
| rs2091766 | Intronic | 3 | 86819155 | 1.23 | (1.00 -1.50) | 0.045 | 1.12 | (0.91 -1.38) | 0.272 |
| rs1128503 | Exonic (sSNP) | 86824252 | 0.8 | (0.66 -0.97) | 0.022 | 0.85 | (0.70 -1.04) | 0.119 | |
| rs12704364 | Intronic | 3 | 86825826 | 1.24 | (1.01 -1.51) | 0.035 | 1.17 | (0.96 -1.42) | 0.13 |
| rs956825 | Intronic | 3 | 86836926 | 1.11 | (0.91 -1.36) | 0.292 | 1.04 | (0.85 -1.28) | 0.686 |
| rs10260862 | Intronic | 4 | 86846133 | 1.14 | (0.90 -1.45) | 0.271 | 1.15 | (0.91 -1.46) | 0.23 |
| rs10264990 | Intronic | singleton | 86847266 | 1.4 | (1.13 -1.74) | 0.002 | 1.33 | (1.07 -1.65) | 0.01 |
| rs1202174 | Intronic | 5 | 86854023 | 1.17 | (0.96 -1.43) | 0.12 | 1.19 | (0.97 -1.45) | 0.096 |
| rs17327442 | Intronic | 5 | 86857641 | 1.22 | (0.91 -1.62) | 0.186 | 1.15 | (0.86 -1.55) | 0.345 |
| rs1202184 | Intronic | 5 | 86858552 | 1.25 | (1.03 -1.52) | 0.025 | 1.24 | (1.02 -1.51) | 0.03 |
| rs1211152 | Intronic | 5 | 86859765 | 1.31 | (0.87 -1.97) | 0.195 | 1.3 | (0.86 -1.96) | 0.21 |
| rs17327624 | Intronic | singleton | 86861468 | 1.01 | (0.79 -1.30) | 0.925 | 0.98 | (0.76 -1.26) | 0.871 |
| rs2188526 | Intronic | 6 | 86865213 | 0.8 | (0.65 -0.97) | 0.022 | 0.77 | (0.63 -0.94) | 0.009 |
| rs13233308 | Intronic | singleton | 86889611 | 0.81 | (0.67 -0.98) | 0.028 | 0.78 | (0.64 -0.94) | 0.01 |
Adjusted estimates adjusted for stage and level of residual disease
Chromosomal position and order for haplotype analysis (from HapMap Phase II (release #24)
Haplotypes estimated for 1230 chromosomes in the 615 women with genotype data for the 21 SNPs revealed that the most common haplotypes contained the minor alleles of rs1128503, rs2032582, and rs1045642 (Table S3). Likelihood ratio tests comparing regression models in optimally debulked carriers of the three most common haplotypes vs. carriers of the minor allele of rs2032582 only, showed no significant improvement in PFS estimates attributable to haplotypes (likelihood ratio p=0.8). We further expanded analysis of the rs1128503- rs2032582-rs1045642 haplotype to 3,437 invasive EOC cases from OCAC with genotype data and observed a similar distribution of haplotypes as seen in the preliminary fine mapping exercise of AOCS cases only. No significant haplotype effects were observed in any subset of cases in analysis of PFS (Table S4).
Based on our fine-mapping and haplotype analysis, as well as a recent report that rs1045642 and rs1128503 may indeed be functionally relevant though silent [29], we evaluated the rs1128503, rs2032582, and rs1045642 SNPs in the largest available dataset of 4,461 European invasive EOC patients with actual (≥80%) and well-imputed genotypes (imputation r2>0.9) for these three SNPs. We observed only a marginal inverse association between the rare allele of rs1128503 and OS in patients with nil residual disease treated with any chemotherapy (HR 0.88, 95% CI 0.77-1.01; p=0.07) (Table 2 & Figure 1). A similar effect was observed for rs2032582 (p=0.08; r2 =0.9 with rs1128503). We observed no significant association between any of the three SNPs and either PFS or OS in invasive EOC or any other subset for residual disease or treatment groups (Table 2). Additionally, we explored the dominant model and found no evidence to support dominant effects for these SNPs (data not shown). There was no evidence of between-study heterogeneity for any of these three SNPs (p≥0.2).
Table 2.
Estimates for three ABCB1 coding SNPs in invasive ovarian cancer cases according to treatment group and debulking status.
| SNP | aAnalysis subset | bN | % Relapsed | % Died | cProgression-free survival | c,dOverall Survival | ||||
|---|---|---|---|---|---|---|---|---|---|---|
|
| ||||||||||
| HR | 95% CI | P | HR | 95% CI | P | |||||
| G2677TA (rs2032582) | All Cases | |||||||||
| Standard | 1,882 | 70.14 | 51.91 | 0.99 | (0.91 -1.08) | 0.83 | 1.00 | (0.90 -1.10) | 0.92 | |
| All chemo | 4,450 | 67.30 | 52.09 | 1.02 | (0.96 -1.07) | 0.55 | 1.00 | (0.94 -1.07) | 0.93 | |
| Nil Residual Disease | ||||||||||
| Standard | 687 | 48.18 | 31.15 | 1.03 | (0.87 -1.22) | 0.75 | 1.00 | (0.81 -1.23) | 0.99 | |
| All chemo | 1,665 | 43.96 | 30.27 | 0.95 | (0.85 -1.06) | 0.37 | 0.89 | (0.77 -1.01) | 0.08 | |
| Optimally debulked (≤1cm) | ||||||||||
| Standard | 1,118 | 61.72 | 46.15 | 1.00 | (0.90 -1.12) | 0.97 | 0.97 | (0.85 -1.10) | 0.61 | |
| All chemo | 2,600 | 56.96 | 43.88 | 0.98 | (0.91 -1.06) | 0.68 | 0.95 | (0.87 -1.03) | 0.21 | |
| Sub-optimally debulked (>1cm) | ||||||||||
| Standard | 672 | 84.52 | 60.86 | 1.01 | (0.89 -1.15) | 0.84 | 1.05 | (0.91 -1.22) | 0.49 | |
| All chemo | 1,654 | 83.68 | 64.81 | 1.05 | (0.97 -1.14) | 0.22 | 1.05 | (0.96 -1.15) | 0.24 | |
| C1236T (rs1128503) | All Cases | |||||||||
| Standard | 1,873 | 70.10 | 51.79 | 1.02 | (0.94 -1.11) | 0.57 | 0.98 | (0.89 -1.08) | 0.75 | |
| All chemo | 4,436 | 67.22 | 51.98 | 1.04 | (0.98 -1.10) | 0.19 | 1.00 | (0.94 -1.07) | 0.97 | |
| Nil Residual Disease | ||||||||||
| Standard | 681 | 48.02 | 30.84 | 1.07 | (0.90 -1.26) | 0.46 | 0.95 | (0.77 -1.17) | 0.63 | |
| All chemo | 1,659 | 43.88 | 30.14 | 1.00 | (0.89 -1.11) | 0.96 | 0.88 | (0.77 -1.01) | 0.07 | |
| Optimally debulked (≤1cm) | ||||||||||
| Standard | 1,110 | 61.62 | 46.04 | 1.04 | (0.93 -1.16) | 0.50 | 0.94 | (0.83 -1.07) | 0.35 | |
| All chemo | 2,592 | 56.87 | 43.79 | 1.01 | (0.94 -1.09) | 0.76 | 0.95 | (0.87 -1.03) | 0.20 | |
| Sub-optimally debulked (>1cm) | ||||||||||
| Standard | 671 | 84.50 | 60.66 | 1.05 | (0.92 -1.19) | 0.49 | 1.08 | (0.93 -1.26) | 0.29 | |
| All chemo | 1,648 | 83.62 | 64.68 | 1.07 | (0.98 -1.15) | 0.12 | 1.06 | (0.97 -1.16) | 0.23 | |
| C3435T (rs1045642) | All Cases | |||||||||
| Standard | 1,873 | 70.10 | 51.79 | 0.99 | (0.91 -1.07) | 0.81 | 0.97 | (0.88 -1.06) | 0.51 | |
| All chemo | 4,435 | 67.24 | 51.97 | 0.99 | (0.94 -1.04) | 0.64 | 1.00 | (0.94 -1.06) | 0.99 | |
| Nil Residual Disease | ||||||||||
| Standard | 681 | 48.02 | 30.84 | 0.94 | (0.80 -1.11) | 0.49 | 0.92 | (0.74 -1.14) | 0.44 | |
| All chemo | 1,658 | 43.91 | 30.10 | 1.00 | (0.89 -1.11) | 0.98 | 1.06 | (0.93 -1.22) | 0.37 | |
| Optimally debulked (≤1cm) | ||||||||||
| Standard | 1,110 | 61.62 | 46.04 | 0.98 | (0.88 -1.09) | 0.68 | 0.98 | (0.87 -1.11) | 0.77 | |
| All chemo | 2,591 | 56.89 | 43.77 | 0.98 | (0.91 -1.05) | 0.51 | 1.01 | (0.93 -1.10) | 0.77 | |
| Sub-optimally debulked (>1cm) | ||||||||||
| Standard | 671 | 84.50 | 60.66 | 0.98 | (0.87 -1.11) | 0.77 | 0.93 | (0.80 -1.08) | 0.33 | |
| All chemo | 1,648 | 83.62 | 64.68 | 1.00 | (0.93 -1.08) | 0.99 | 1.00 | (0.91 -1.09) | 0.95 | |
‘Standard’ refers to cases receiving cytoreductive surgery and ≥4 cycles of paclitaxel and carboplatin; ‘All chemo’ refers to cases receiving cytoreductive surgery and any chemotherapy regimen
N includes BAV cases which were included in OS analysis only
All estimates are stratified by study and adjusted for histology (serous, mucinous, endometrioid, clear cell and other epithelial), tumor stage (I to IV), residual disease (nil vs. any), and grade (low vs. high for all except MAY & MAC studies which was analysed as a 4-levels variable)
OS estimates are additionally adjusted for age at diagnosis
Figure 1.
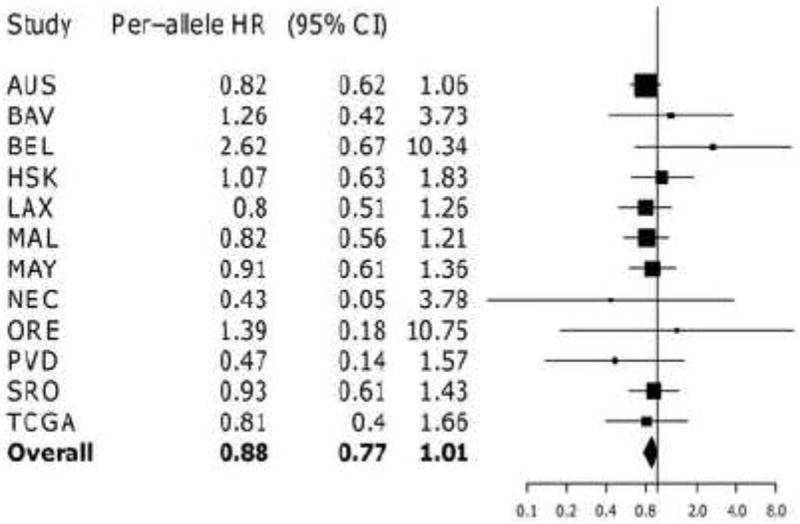
Forest plot of study-specific estimates for rs1128503 and overall survival for patients with nil residual disease receiving any chemotherapy regimen Estimates for HAW and NCO missing due to insufficient data for this subgroup
Finally, 1,562 of the 2,745 imputed chromosome 7 SNPs with MAF >0.05 and imputation r2>0.3 were analysed in ~3,000 European invasive EOC patients but no evidence of an association with PFS or OS at the pre-specified threshold of p<4.6 × 10⁻⁴ was observed in any of the chemotherapy subsets (Tables S5 – S8).
ABCB1 mRNA expression levels in 143 AOCS serous tumors indicated that high-level ABCB1 expression was associated with shorter PFS both overall (p=0.003) and in sub-optimally debulked patients (p=0.02; Figure 2), although the effect diminished upon adjustment for residual disease status and tumor stage (Table 3). The mean expression of ABCB1 was higher in sub-optimally debulked patients compared to optimally debulked (1.48 ±0.1 vs 2.74 ±0.79, p=0.04) suggesting a possible link between ABCB1 and disease progression in patients unable to be optimally debulked. In the TCGA dataset, a trend for shorter OS was observed in sub-optimally debulked patients, which was substantially strengthened if patients were uniformly treated with regard to paclitaxel (Table 3).
Figure 2.
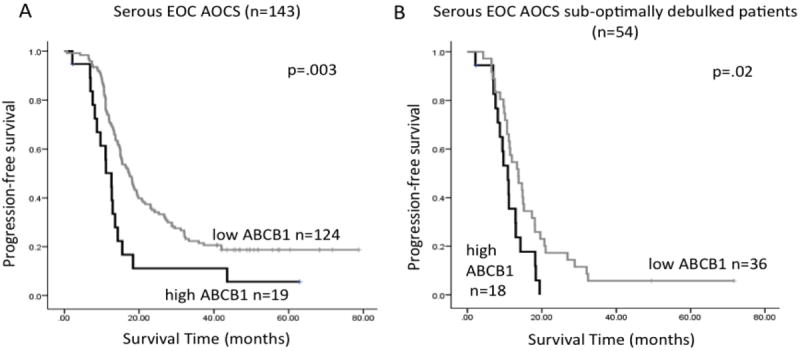
Kaplan-Meier survival analysis of ABCB1 gene expression in serous ovarian cancer. In the AOCS cohort, high expression of ABCB1 is associated with shorter PFS, either (A) in the overall cohort, or (B) in the subgroup of patients with sub-optimally debulked tumors. Kaplan-Meier curves were generated following dichotomisation of gene expression to high or low expression with respect to the optimal cut-point, determined as the 15th percentile in the whole cohort, or the 30th percentile in the sub-optimally debulked subgroup. P-values were calculated according to the log-rank test.
Table 3.
Analysis of ABCB1 expression in serous EOC tumors
| Cohort | N | % Relapsed | % Died | Progression-free survival | Overall Survival | ||||
|---|---|---|---|---|---|---|---|---|---|
|
| |||||||||
| HR | 95% CI | P | HR | 95% CI | P | ||||
| AOCS | |||||||||
| Univariate | |||||||||
| ABCB1 expressiona | 143 | 81.1 | 56.6 | 1.32 | (1.03 -1.70) | 0.028 | 1.20 | (0.92 -1.55) | 0.173 |
| Multivariate model | |||||||||
| ABCB1 expressiona | 143 | 81.1 | 56.6 | 1.26 | (0.99 -1.62) | 0.062 | 1.09 | (0.85 -1.4) | 0.50 |
| Residual disease >1cm | 2.00 | (1.36 -2.95) | <0.001 | 1.95 | (1.24 -3.07) | 0.004 | |||
| FIGO Stageb | 4.61 | (1.84 -11.49) | 0.001 | 10.53 | (1.45 -76.9) | 0.02 | |||
| TCGA Sub-optimally debulked patients (>1cm) | |||||||||
| All chemo | 91 | 69.2 | 58.2 | 1.24 | (0.78 -1.97) | 0.36 | 1.58 | (0.98 -2.57) | 0.06 |
| Standard | 41 | 95.1 | 61 | 1.83 | (0.96 -3.49) | 0.066 | 3.39 | (1.51 -7.62) | 0.003 |
Normalised expression was analysed as a continuous variable;
FIGO stage was categorised as Favorable (figo stages I & II) or Unfavorable (figo stages III & IV).
Discussion
We have comprehensively analysed the largest study to date of ABCB1 SNPs and clinical outcome among women with invasive EOC treated with paclitaxel-based chemotherapy. Fine-mapping analysis suggested that rs2032582 and the two silent SNPs (rs1128503 and rs1045642) were indeed the best candidates [29, 30]. However analysis of these SNPs in 4,616 European/non-Hispanic White invasive EOC patients from the OCAC studies and TCGA showed only a marginal association between rs1128503 (pair-wise r2 with rs2032582 = 0.9) and overall survival in patients with nil residual disease treated with any first-line chemotherapy regimen (Table 2 & Figure 1). Although this association did not meet the threshold for multiple testing, we cannot rule out a small effect of this SNP or another linked to it on overall survival. It is likely that either SNP is modifying the effect of residual disease, a significant predictor of outcome, on overall survival independently of chemotherapy regimen, and warrants further investigation. There was no convincing evidence of an association between PFS or OS and any of the 1,562 SNPs analysed in either the ‘standard’ or ‘all chemo’ subsets (Tables S5 – S8).
A recent systematic literature review of predictive and prognostic studies of ovarian cancer genetic markers including ABCB1 highlighted the non-uniformity of outcome definitions and treatment approaches that limit interpretation and clinical utility, and the need for adequately powered, well-designed observational studies that might help to resolve the present heterogeneity of findings among pharmacogenetic studies [31]. Our patient data was subjected to stringent quality assurance measures with regard to chemotherapy data in an effort to avoid disparities in treatment exposure. Chemotherapy data for each study was obtained from patient charts according to standardized definitions, by data extractors who were blinded to our study hypothesis. Cases were included in the ‘standard’ chemotherapy subset if sufficient details of first-line chemotherapy confirmed that they had in fact received carboplatin and paclitaxel. Approximately 71% of women in this subset received a minimum of four cycles of paclitaxel at 175 or 135 mg/m2 and carboplatin AUC 5 or 6. The other 29% in this subgroup were presumed to have received ≥ 4 cycles of paclitaxel and carboplatin at these doses based on patient data that suggested that this was the planned treatment approach, with due consideration to toxicity data and other variables that might indicate that the doses or cycles of chemotherapy actually received were not as planned. Cases known to have received < 4 cycles of paclitaxel and carboplatin due to dose reduction or toxicity were included only in the ‘all chemo’ analyses. Analysis of the ‘all chemo’ dataset was designed to test whether any observed SNP associations from the ‘standard’ subsets would be diminished if indeed such associations were directly linked to exposure to a P-gp substrate.
To circumvent methodological flaws we restricted the analysis to European invasive EOC cases participating in the OCAC with standardized definitions of clinical and pathological characteristics. All analyses were stratified by study to account for unknown sources of variation, although baseline PFS by OCAC study has previously been shown to be comparable [14]. The median follow-up of the entire cohort of 4,942 eligible cases was 5.9 (95% CI 5.7 – 6.0) years. Given the prognosis of invasive ovarian cancer, it is highly likely that deaths in this cohort were due to ovarian cancer, and therefore represents a reasonable estimate of the association between SNPs and disease-specific survival.
Despite our rigorous approach to data quality and our null findings, we cannot rule out the possibility that some polymorphisms around the ABCB1 locus may have a very subtle effect on outcomes. Expression studies suggest that variation in P-gp function is a putative mechanism for MDR in a wide range of disease [4] and may at least in part contribute to paclitaxel-based chemotherapy outcomes. It is possible that there are long range eQTLs that influence the expression of P-gp that were not genotyped in our fine mapping study of ABCB1. In terms of tumor-intrinsic ABCB1 function, whilst high levels of ABCB1 can clearly confer taxane resistance to cancer cells in vitro, the outcomes of numerous studies examining a potential clinical role are diverse and inconclusive. The current study suggests that ABCB1 expression in primary tumors may influence the time to relapse, particularly in the subgroup of patients with significant residual tumor post-surgery. The relationship between ABCB1 SNPs and expression has been intensively studied and sometimes weak associations observed between the T allele of rs1045642 and expression in cancer cells [4]. In the relatively large dataset of combined TCGA and AOCS patients (n=536), we found no association between the three coding SNPs, rs1045642, rs1128503 and rs2032582 and ABCB1 expression levels (Table S9).
There remains a great need to implement high-quality pharmacogenomic studies in EOC because the causes of differential treatment outcomes remain unknown. Promising new biological entities are being tested for concurrent administration with paclitaxel-based treatment regimens [32] which require prolonged administration, and the identification of genetic markers may enhance the clinical approaches and cost-effectiveness of these treatment approaches. However, large clinical trials or well-designed prospective cohort studies that take into account differential responses according to EOC tumor types are required to succeed in defining the role of genetics in treatment response.
Supplementary Material
Highlights.
ABCB1 C1236T (rs1128503) was marginally associated with improved overall survival in 4,616 invasive ovarian cancer patients regardless of chemotherapy
Analysis of an additional 1,562 SNPs flanking ABCB1 in ~3000 invasive ovarian cancer patients yielded no new signals
Analysis of ABCB1 expression in 143 ovarian tumors showed that ABCB1 expression may worsen prognosis in sub-optimally debulked patients
Acknowledgments
This study would not have been possible without the contributions of the following: Per Hall (COGS); Douglas F. Easton (BCAC), Andrew Berchuck (OCAC), Rosalind A. Eeles, Douglas F. Easton, Ali Amin Al Olama, Zsofia Kote-Jarai (PRACTICAL), Georgia Chenevix-Trench, Antonis Antoniou, Fergus Couch and Ken Offit (CIMBA), Joe Dennis, Alison M. Dunning, Andrew Lee, and Ed Dicks (Cambridge), Javier Benitez, Anna Gonzalez-Neira and the staff of the CNIO genotyping unit, Jacques Simard and Daniel C. Tessier, Francois Bacot, Daniel Vincent, Sylvie LaBoissière and Frederic Robidoux and the staff of the McGill University and Génome Québec Innovation Centre, Stig E. Bojesen, Sune F. Nielsen, Borge G. Nordestgaard, and the staff of the Copenhagen DNA laboratory, and Julie M. Cunningham, Sharon A. Windebank, Christopher A. Hilker, Jeffrey Meyer and the staff of Mayo Clinic Genotyping Core Facility
The authors also acknowledge the cooperation of all participating institutions and the contributions of the women who participated in this study. The full AOCS Study Group is available at http://www.aocstudy.org/
The results published here are in part based upon data generated by The Cancer Genome Atlas Pilot Project established by the National Cancer Institute and National Human Genome Research Institute. Information about TCGA can be found at http://cancergenome.nih.gov/.
Children’s Cancer Institute Australia is affiliated with the University of New South Wales and Sydney Children’s Hospital.
Grant Support
Funding for the iCOGS infrastructure came from: the European Community’s Seventh Framework Programme under grant agreement n° 223175 (HEALTH-F2-2009-223175) (COGS), Cancer Research UK (C1287/A10118, C1287/A 10710, C12292/A11174, C5047/A8384, C5047/A15007, C5047/A10692), the National Institutes of Health (CA128978) and Post-Cancer GWAS initiative (No. 1 U19 CA 148537 - the GAME-ON initiative), the Department of Defence (W81XWH-10-1-0341), the Canadian Institutes of Health Research (CIHR) for the CIHR Team in Familial Risks of Breast Cancer, Komen Foundation for the Cure, the Breast Cancer Research Foundation, and the Ovarian Cancer Research Fund.
The AOCS was supported by the U.S. Army Medical Research and Materiel Command under DAMD17-01-1-0729, the National Health and Medical Research Council (NHMRC) of Australia (400413, 400281), Cancer Council Victoria, Cancer Council Queensland, Cancer Council New South Wales, Cancer Council South Australia, The Cancer Foundation of Western Australia, and Cancer Council Tasmania. G. Chenevix-Trench is a Senior Principal Research fellow of the NHMRC, and this work was supported by NHMRC and Cancer Australia funding. Y. Li is funded by NHMRC grant 496675, and S. MacGregor is supported by an NHMRC career development award, B Gao was supported by an NHMRC Scholarship and a Cancer Institute NSW Research Scholar Award.
The Mayo Clinic study (MAY) was supported by R01 CA122443, P50 CA136393.
SCOTROC biological studies were supported by Cancer Research UK (grant C536/A6689).
The LAX study (Women’s Cancer Program) was supported by the American Cancer Society Early Detection Professorship (120950-SIOP-06-258-06-COUN) and Entertainment Industry Foundation.
The HAW study was supported by grant R01-CA58598 from the US National Institutes of Health.
The NEC study was supported by grant R01-CA54419 from the US national Institutes of Health and W81XWH-10-0280 from the Department of Defense.
The Danish Malignant Ovarian Tumor Study (MAL) was supported by a Danish Cancer Society research grant (94 222 52) and by the Mermaid I project
Footnotes
Conflict of Interest Statement
The authors wish to report that they have no conflicts of interest.
Publisher's Disclaimer: This is a PDF file of an unedited manuscript that has been accepted for publication. As a service to our customers we are providing this early version of the manuscript. The manuscript will undergo copyediting, typesetting, and review of the resulting proof before it is published in its final citable form. Please note that during the production process errors may be discovered which could affect the content, and all legal disclaimers that apply to the journal pertain.
References
- 1.Marchetti C, Pisano C, Facchini G, Bruni GS, Magazzino FP, Losito S, et al. First-line treatment of advanced ovarian cancer: current research and perspectives. Expert Rev Anticancer Ther. 2010;10:47–60. doi: 10.1586/era.09.167. [DOI] [PubMed] [Google Scholar]
- 2.Juliano RL, Ling V. A surface glycoprotein modulating drug permeability in Chinese hamster ovary cell mutants. Biochim Biophys Acta. 1976;455:152–62. doi: 10.1016/0005-2736(76)90160-7. [DOI] [PubMed] [Google Scholar]
- 3.Orina JN, Calcagno AM, Wu CP, Varma S, Shih J, Lin M, et al. Evaluation of current methods used to analyze the expression profiles of ATP-binding cassette transporters yields an improved drug-discovery database. Mol Cancer Ther. 2009;8:2057–66. doi: 10.1158/1535-7163.MCT-09-0256. [DOI] [PMC free article] [PubMed] [Google Scholar]
- 4.Leschziner GD, Andrew T, Pirmohamed M, Johnson MR. ABCB1 genotype and PGP expression, function and therapeutic drug response: a critical review and recommendations for future research. Pharmacogenomics J. 2007;7:154–79. doi: 10.1038/sj.tpj.6500413. [DOI] [PubMed] [Google Scholar]
- 5.Sissung TM, Baum CE, Kirkland CT, Gao R, Gardner ER, Figg WD. Pharmacogenetics of membrane transporters: an update on current approaches. Mol Biotechnol. 2010;44:152–67. doi: 10.1007/s12033-009-9220-6. [DOI] [PMC free article] [PubMed] [Google Scholar]
- 6.Green H, Soderkvist P, Rosenberg P, Horvath G, Peterson C. mdr-1 single nucleotide polymorphisms in ovarian cancer tissue: G2677T/A correlates with response to paclitaxel chemotherapy. Clin Cancer Res. 2006;12:854–9. doi: 10.1158/1078-0432.CCR-05-0950. [DOI] [PubMed] [Google Scholar]
- 7.Marsh S, Paul J, King CR, Gifford G, McLeod HL, Brown R. Pharmacogenetic assessment of toxicity and outcome after platinum plus taxane chemotherapy in ovarian cancer: the Scottish Randomised Trial in Ovarian Cancer. J Clin Oncol. 2007;25:4528–35. doi: 10.1200/JCO.2006.10.4752. [DOI] [PubMed] [Google Scholar]
- 8.Peethambaram P, Fridley BL, Vierkant RA, Larson MC, Kalli KR, Elliott EA, et al. Polymorphisms in ABCB1 and ERCC2 associated with ovarian cancer outcome. Int J Mol Epidemiol Genet. 2011;2:185–95. [PMC free article] [PubMed] [Google Scholar]
- 9.Tian C, Ambrosone CB, Darcy KM, Krivak TC, Armstrong DK, Bookman MA, et al. Common variants in ABCB1, ABCC2 and ABCG2 genes and clinical outcomes among women with advanced stage ovarian cancer treated with platinum and taxane-based chemotherapy: A Gynecologic Oncology Group study. Gynecol Oncol. 2011 doi: 10.1016/j.ygyno.2011.11.022. [DOI] [PMC free article] [PubMed] [Google Scholar]
- 10.Johnatty SE, Beesley J, Paul J, Fereday S, Spurdle AB, Webb PM, et al. Correction: ABCB1 (MDR1) Polymorphisms and Progression-Free Survival among Women with Ovarian Cancer following Paclitaxel/Carboplatin Chemotherapy. Clin Cancer Res. 2012;18(1):319–20. doi: 10.1158/1078-0432.CCR-08-0606. [DOI] [PubMed] [Google Scholar]
- 11.Johnatty SE, Beesley J, Paul J, Fereday S, Spurdle AB, Webb PM, et al. ABCB1 (MDR 1) polymorphisms and progression-free survival among women with ovarian cancer following paclitaxel/carboplatin chemotherapy. Clin Cancer Res. 2008;14:5594–601. doi: 10.1158/1078-0432.CCR-08-0606. [DOI] [PubMed] [Google Scholar]
- 12.Gayther SA, Song H, Ramus SJ, Kjaer SK, Whittemore AS, Quaye L, et al. Tagging single nucleotide polymorphisms in cell cycle control genes and susceptibility to invasive epithelial ovarian cancer. Cancer Res. 2007;67:3027–35. doi: 10.1158/0008-5472.CAN-06-3261. [DOI] [PubMed] [Google Scholar]
- 13.Sankararaman S, Sridhar S, Kimmel G, Halperin E. Estimating local ancestry in admixed populations. Am J Hum Genet. 2008;82:290–303. doi: 10.1016/j.ajhg.2007.09.022. [DOI] [PMC free article] [PubMed] [Google Scholar]
- 14.Huang RS, Johnatty SE, Gamazon ER, Im HK, Ziliak D, Duan S, et al. Platinum sensitivity-related germline polymorphism discovered via a cell-based approach and analysis of its association with outcome in ovarian cancer patients. Clin Cancer Res. 2011;17:5490–500. doi: 10.1158/1078-0432.CCR-11-0724. [DOI] [PMC free article] [PubMed] [Google Scholar]
- 15.Howie B, Fuchsberger C, Stephens M, Marchini J, Abecasis GR. Fast and accurate genotype imputation in genome-wide association studies through pre-phasing. Nat Genet. 2012;44:955–9. doi: 10.1038/ng.2354. [DOI] [PMC free article] [PubMed] [Google Scholar]
- 16.Li Y, Willer C, Ding J, Scheet P, Abecasis G. MaCH: using sequence and genotype data to estimate haplotypes and unobserved genotypes. Genet Epidemiol. 2010;34:816–34. doi: 10.1002/gepi.20533. [DOI] [PMC free article] [PubMed] [Google Scholar]
- 17.Pharoah PD, Tsai YY, Ramus SJ, Phelan CM, Goode EL, Lawrenson K, et al. GWAS meta-analysis and replication identifies three new susceptibility loci for ovarian cancer. Nat Genet. 2013;45:362–70. doi: 10.1038/ng.2564. [DOI] [PMC free article] [PubMed] [Google Scholar]
- 18.de Bakker PI, Yelensky R, Pe’er I, Gabriel SB, Daly MJ, Altshuler D. Efficiency and power in genetic association studies. Nat Genet. 2005;37:1217–23. doi: 10.1038/ng1669. [DOI] [PubMed] [Google Scholar]
- 19.Cordell HJ, Clayton DG. A unified stepwise regression procedure for evaluating the relative effects of polymorphisms within a gene using case/control or family data: application to HLA in type 1 diabetes. Am J Hum Genet. 2002;70:124–41. doi: 10.1086/338007. [DOI] [PMC free article] [PubMed] [Google Scholar]
- 20.Browning SR, Browning BL. Rapid and accurate haplotype phasing and missing-data inference for whole-genome association studies by use of localized haplotype clustering. Am J Hum Genet. 2007;81:1084–97. doi: 10.1086/521987. [DOI] [PMC free article] [PubMed] [Google Scholar]
- 21.Haber M, Smith J, Bordow SB, Flemming C, Cohn SL, London WB, et al. Association of high-level MRP1 expression with poor clinical outcome in a large prospective study of primary neuroblastoma. J Clin Oncol. 2006;24:1546–53. doi: 10.1200/JCO.2005.01.6196. [DOI] [PubMed] [Google Scholar]
- 22.Vandesompele J, De Preter K, Pattyn F, Poppe B, Van Roy N, De Paepe A, et al. Accurate normalization of real-time quantitative RT-PCR data by geometric averaging of multiple internal control genes. Genome Biol. 2002;3:RESEARCH0034. doi: 10.1186/gb-2002-3-7-research0034. [DOI] [PMC free article] [PubMed] [Google Scholar]
- 23.Integrated genomic analyses of ovarian carcinoma. Nature. 2011;474:609–15. doi: 10.1038/nature10166. [DOI] [PMC free article] [PubMed] [Google Scholar]
- 24.Clark TG, Altman DG, De Stavola BL. Quantification of the completeness of follow-up. Lancet. 2002;359:1309–10. doi: 10.1016/s0140-6736(02)08272-7. [DOI] [PubMed] [Google Scholar]
- 25.Li J, Ji L. Adjusting multiple testing in multilocus analyses using the eigenvalues of a correlation matrix. Heredity (Edinb) 2005;95:221–7. doi: 10.1038/sj.hdy.6800717. [DOI] [PubMed] [Google Scholar]
- 26.Nyholt DR. A simple correction for multiple testing for single-nucleotide polymorphisms in linkage disequilibrium with each other. Am J Hum Genet. 2004;74:765–9. doi: 10.1086/383251. [DOI] [PMC free article] [PubMed] [Google Scholar]
- 27.Bolton KL, Tyrer J, Song H, Ramus SJ, Notaridou M, Jones C, et al. Common variants at 19p13 are associated with susceptibility to ovarian cancer. Nat Genet. 2010;42:880–4. doi: 10.1038/ng.666. [DOI] [PMC free article] [PubMed] [Google Scholar]
- 28.Song H, Ramus SJ, Kjaer SK, DiCioccio RA, Chenevix-Trench G, Pearce CL, et al. Association between invasive ovarian cancer susceptibility and 11 best candidate SNPs from breast cancer genome-wide association study. Hum Mol Genet. 2009;18:2297–304. doi: 10.1093/hmg/ddp138. [DOI] [PMC free article] [PubMed] [Google Scholar]
- 29.Kimchi-Sarfaty C, Oh JM, Kim IW, Sauna ZE, Calcagno AM, Ambudkar SV, et al. A “silent” polymorphism in the MDR1 gene changes substrate specificity. Science. 2007;315:525–8. doi: 10.1126/science.1135308. [DOI] [PubMed] [Google Scholar]
- 30.Sauna ZE, Kimchi-Sarfaty C, Ambudkar SV, Gottesman MM. Silent polymorphisms speak: how they affect pharmacogenomics and the treatment of cancer. Cancer Res. 2007;67:9609–12. doi: 10.1158/0008-5472.CAN-07-2377. [DOI] [PubMed] [Google Scholar]
- 31.Diaz-Padilla I, Amir E, Marsh S, Liu G, Mackay H. Genetic polymorphisms as predictive and prognostic biomarkers in gynecological cancers: A systematic review. Gynecol Oncol. 2011 doi: 10.1016/j.ygyno.2011.10.034. [DOI] [PubMed] [Google Scholar]
- 32.Burger RA, Brady MF, Bookman MA, Walker JL, Homesley HD, Fowler J, et al. Phase III trial of bevacizumab (BEV) in the primary treatment of advanced epithelial ovarian cancer (EOC), primary peritoneal cancer (PPC), or fallopian tube cancer (FTC): A Gynecologic Oncology Group study. ASCO Meeting Abstracts; 2010. LBA1. [Google Scholar]
Associated Data
This section collects any data citations, data availability statements, or supplementary materials included in this article.