

Abstract
The low sensitivity of Mobile Health (mHealth) optical detectors, such as those found on mobile phones, is a limiting factor for many mHealth clinical applications. To improve sensitivity, we have combined two approaches for optical signal amplification: (1) a computational approach based on an image stacking algorithm to decrease the image noise and enhance weak signals, and (2) an optical signal amplifier utilizing a capillary tube array. These approaches were used in a detection system which includes a multi-wavelength LEDs capable of exciting many fluorophores in multiple wavelengths, a mobile phone or a webcam as a detector, and capillary tube array configured with 36 capillary tubes for signal enhancement.
The capillary array enables a ~100X increase in signal sensitivity for fluorescein, reducing the limit of detection (LOD) for mobile phones and webcams from 1000 nM to 10 nM. Computational image stacking enables another ~10X increase in signal sensitivity, further reducing the LOD for webcam from 10 nM to 1 nM.
To demonstrate the feasibility of the device for the detection of disease-related biomarkers, Adenovirus DNA labeled with SYBR Green or fluorescein was analyzed by both our capillary array and a commercial plate reader. The LOD for the capillary array was 5ug/mL, and that of the plate reader was 1 ug/mL. Similar results were obtained using DNA stained with fluorescein.
The combination of the two signal amplification approaches enables a ~1000X increase in LOD for the webcam platform. This brings it into the range of a conventional plate reader while using a smaller sample volume (10ul) than the plate reader requires (100 ul). This suggests that such a device could be suitable for biosensing applications where up to 10 fold smaller sample sizes are needed.
The simple optical configuration for mHealth described in this paper employing the combined capillary and image processing signal amplification is capable of measuring weak fluorescent signals without the need of dedicated laboratories. It has the potential to be used to increase sensitivity of other optically based mHealth technologies, and may increase mHealth’s clinical utility, especially for telemedicine and for resource-poor settings and global health applications.
Keywords: Lab-on-a-chip, mHealth, capillary, fluorescence, image stacking, mobile phone
1. Introduction
Mobile computing, medical sensors, and communications technologies for healthcare (mHealth) (Istepanian et al. 2004) have the potential to address the needs of medical diagnostics and provide clinical utility, especially for applications in telemedicine, in resource poor areas, and in global health settings. It is envisioned that Point-of-care diagnostics will improve the practice of medicine and public health by providing better medical access to meet the needs of underserved populations in remote locations where current techniques designed for conventional medical settings are not viable, affordable, or compatible with the conditions of underserved populations (Hay Burgess et al. 2006; Urdea et al. 2006; Yager et al. 2008).
Recently, optical detection technologies based on mobile devices have been developed for mHealth, including a reader for lateral flow immuno-chromatographic assays (Mudanyali et al. 2012), wide-field fluorescent microscopy (Zhu et al. 2011b), capillary array for immunodetection for Escherichia coli (Zhu et al. 2012), lensfree microscopy (Tseng et al. 2010), fluorescent imaging cytometry (Zhu et al. 2011a), microchip ELISA-based detection of ovarian cancer HE4 biomarker in urine (Wang et al. 2011), detection systems for melanoma or skin lesion (Boyce et al. 2011; Rosado et al. 2012; Wadhawan et al. 2011), loop-mediated isothermal amplification (LAMP) genetic testing device (Stedtfeld et al. 2012), acoustic wave enhanced immunoassay (Bourquin et al. 2011), a colorimetric reader (Lee et al. 2011b), phone-assisted microarray reader for mutation detection (Zhang et al. 2011), and mobile phone cameras for DNA detection (Lee et al. 2011a). Many of these technologies rely on the inherent sensitivity of the CMOS camera native to the mobile devices. However, the sensitivity of these CMOS-based cameras is too low to be useful for many optical modalities, such as low fluorescent signal detection, and none of the aforementioned technologies enhances the sensitivity of the mobile phone camera, which is the limiting factor for optical detection in mHealth applications.
To utilize low cost detectors with high noise levels (e.g., $10 webcams) for mHealth applications, a computational approach known as “image stacking” has been employed recently to improve sensitivity for fluorescent detection (Balsam et al. 2012a). In webcam images, it is difficult to distinguish between the signal and the noise due to the poor signal-to-noise ratio (SNR). However, using the webcam in video mode makes it possible to capture many individual frames and combine them with an image stacking algorithm to average the values of each pixel, so the random noise which is present can be significantly reduced. The resulting stacked image has a significantly higher SNR (and consequently an improved LOD), and consists largely of the underlying signal, which enables the detection of weak signals that would normally be masked by the noise without image stacking.
In addition to computational image enhancement through image stacking, optical amplification of signals can also increase sensitivity. Previously, capillary tubes have been used in medical diagnostic for both assay fluid handling and waveguide illumination (Weigl et al. 1994). Several types of capillaries, optical path geometries, and configurations have been investigated including: (1) vertical excitation (to the long axis) at 90° angle and detection of emitted light (Cosford and Kuhr 1996), (2) vertical excitation detected at one end (Misiakos and Kakabakos 1998), (Ligler et al. 2002), and (3) horizontal (or angular) excitation through the end of the capillary (Flanagan and Sloper 1992). In the latter configuration, excitation light propagates through the capillary (or planar) walls to enable evanescent excitation as well as propagation of the emitted light along the capillary with a grating to couple the light out of the waveguide to a detector, and has also been used also for evanescent fiber optic biosensors (Anderson et al. 2000). Horizontal excitation generates evanescent wave illumination, which combined with vertical detection has been used mainly for planar (not capillary) detection (Wadkins et al. 1998) (Plowman et al. 1999; Rowe et al. 1999) (Silzel et al. 1998).
These previously investigated capillary configurations are not suitable for mHealth because they utilize costly components, such as laser illumination, photomultiplier tubes (PMTs), or actively-cooled CCD detectors to improve sensitivity. All of these devices also utilize complex optics configuration, and most have limited portability. This renders them less effective for mHealth applications where the need is for simple, low cost and portable devices. In previous work, a capillary array has been used to performing immunoassay for detection with a mobile phone (Zhu et al. 2012). However, the capillary array was not used for optical signal amplification of the assay, and a high level of detection sensitivity (5 to 10 cfu mL(−1) for E. coli) was obtained through the use of quantum dots.
In an alternative capillary waveguide design we have developed, the capillaries can be illuminated by a multi-wave length LED light source with light propagating parallel to the capillary axis. The light-wave energy that couples with the capillary propagates through its walls and interacts directly with fluorescent molecules to excite them via evanescent waves, and fluorescent emission can be detected at the end of the capillary by a mobile phone or CCD camera. To increase the sensitivity of mHealth technologies, we combine this capillary design with the computational enhancement via image stacking to increase sensitivity for fluorescence detection. This combined approach has the potential to form the basis to use mHealth technologies for optical detection in assays requiring high sensitivity using low cost medical diagnostic techniques with clinical utility in resource-poor settings for global health.
2. Materials and methods
2.1 Materials and reagents
The 36-channel capillary arrays used for analysis were fabricated using heparinized glass capillaries (Drummond Scientific, Broomall, PA) held in a square array by black poly(methyl-methacrylate) (PMMA), also known as acrylic (Piedmont Plastic, Inc. Beltsville, MD). 36-well plates were fabricated using black acrylic sheet to define the well volume and clear polycarbonate sheet to define the well bottom. For bonding the black acrylic with the polycarbonate, 3M 9770 adhesive transfer double sided tape was used (Piedmond Plastics Inc., Beltsville, MD). To block the waveguiding properties of the glass capillaries some were coated with high purity silver using a sputter deposition chamber (Denton Desk IV, Denton Vacuum, LLC). The fluorescence measurements were made using fluorescein (Sigma-Aldrich Co. LLC) diluted in water as a standard.
2.2 mHealth fluorescence detector
The main components of mHealth fluorescence detector are: (1) an LED excitation source described in previous work (Sun et al. 2010a) capable of producing light from 450–650nm (red 610–650 nm, green 510–550 nm, and blue 450–500 nm). (2) Excitation and emission filters, which for fluorescein is a 20nm bandpass filter with a 486nm center wavelength (D486/20X) for excitation and a 50nm bandpass filter with a center wavelength of 535nm (HQ535/50M filters, both from Chroma Technology Corp., Rockingham, VT) for emission. (3) An optical detector, 7 which for this work two different types were investigated: (a) generic webcam color video camera (AVEO Corp) with an 8 bit 640 × 480 pixel CMOS sensor enabling 256 levels of gray scale (typical Ebay vendor) used in previous work (Balsam et al. 2012b; Balsam et al. 2011), and (b) Samsung Galaxy SII smart phone (Samsung Electronics Co.) with a built-in lens with a focal ratio of f/2.65 and a 4mm focal length. The phone was used with an aftermarket application which allows control of the exposure time and gain of the camera (Camera FV-5, Flavio González Vázquez).
2.3 Fabrication of 36-channel fluidics
Capillary array fluidics
A 6×6 array of heparinized glass capillaries was fabricated. To orient all 36 capillary channels towards the camera image sensor simultaneously, two laser machined six-by-six arrays of holes in two 3.2 mm thick plates of black acrylic which hold the capillaries in parallel configuration were fabricated.
Plate array fluidics
The 36-well type plate array was fabricated as described in our previous work (Sapsford et al. 2009; Sun et al. 2009; Sun et al. 2010b). Black acrylic plates with one side coated by 3M 9770 black adhesive transfer tape were laser machined to have a six-by-six array of wells. A layer of thin polycarbonate sheet was attached to the adhesive transfer tape to form the bottom of the sample wells.
2.4 Adenovirus DNA amplification
The Adenovirus DNA (5×10⁸ copies) was amplified with PCR using an Adeno-X qPCR Titration Kit (Clontech). The PCR conditions used were: 95°C for 3 min, 40 cycles of 95°C for 30 sec, 60°C for 30 sec, 72°C for 1 min, followed by heating at 95°C for 15 sec, 55°C for 15 sec, then increased at 2°C/min to 95°C for 15 sec. PCR was performed using an Eppendorf Mastercycler Realplex. The DNA was labeled with SYBR Green (Stratagene, Cat #600548) or fluorescein (Mirus, Cat #MIR 3225).
2.5 Image processing
Images from the webcam were captured using two modes: (a) single frame and (b) video. In both capture modes, the exposure time is governed by an onboard controller and has a lower limit of approximately 1/30s (dictated by frame rate). In video mode, a stream of frames is captured for ten to fifteen seconds and saved as a compressed AVI file. At thirty frames per second, this amounts to several hundred frames. To reduce noise, this file is then split into its constituent frames and averaged together through image stacking via ImageJ software developed and distributed freely by NIH (http://rsb.info.nih.gov/ij/download.html). Thus, averaging serves to reduce the effects of random variation in the signal due to noise.
Images captured by this platform were in 8-bit color format. Each color image was essentially three separate monochrome images, each one representing one color channel (red, green and blue) and each pixel of each image having a value between 0 and 255. Because the signal of interest for fluorescein was in the green spectrum, only the green channel was analyzed in order to reduce noise.
To further reduce background noise in the final image and improve the signal-to-noise ratio (SNR), a median dark frame was subtracted from each image to be analyzed. A dark frame is an image with identical exposure time and gain settings as the original image, but taken with no light reaching the camera sensor (i.e. with a lens cap in place). When several of these dark frames are averaged together, the resulting image represents the average background noise generated by the camera sensor. This averaging was done in ImageJ using many (>100) dark frames with the median value for each pixel calculated and combined to form the final dark frame. The green channel was extracted from these median dark frame images and subtracted from the green channel of the corresponding original image containing the signal of interest. This process has been described in greater depth in previous work (Balsam et al. 2012a; Balsam et al. 2012b).
3. Results and Discussion
3.1 mHealth optical detector configuration
The basic configuration of the mHealth optical detector is shown schematically in Figure 1. The main element of the system includes the waveguide capillary array used for fluorescence amplification shown schematically in Figure 1-A. The 6X6 array of capillaries is held together on the top and the bottom by two acrylic holders with holes which the capillaries are inserted through. A photo of the capillary array is shown in Figure 1-B. The capillaries are illuminated 9 by the multi-wavelength LED light emitted parallel (at 486 nm) to the capillary axis (Figure 1-C).
Figure 1. mHealth optical detector configuration.
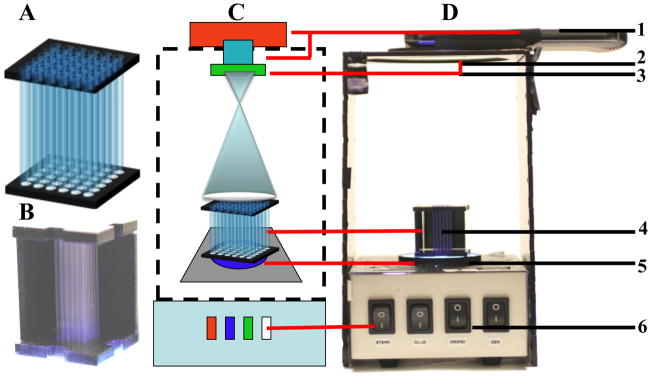
(A) a schematic configuration of the waveguide capillary array, (B) a photo of the capillary array, (C) a schematic configuration of the mHealth waveguide capillary array fluorescence detectors with the main system components (highlighted in the schematic are [1] a portable phone or webcam mounted in a homemade acrylic box, [2] lens, [3] emission filter mounted on the end of the lens, [4] capillary array, [5] Excitation filter, and [6] multi-wavelength LED), and (D) a photo of a portable phone-based fluorescence detector.
To demonstrate the capability of this new technique, fluorescein (a common dye used in many biological assays) was used as a model fluorescence media. The light-wave energy propagating through the capillary walls can interact directly and excite the fluorescein molecules (via evanescent waves) which emit light at 521 nm. The emitted photons were then detected at the end of the capillary by an imaging detector (webcam, CCD camera, portable phone etc). The schematics of the mHealth optical detector is shown in Figure 1-C with the main components highlighted in the schematic: [1] a portable phone or webcam mounted in a custom acrylic box, [2] lens, [3] emission filter mounted on the end of the lens, [4] capillary array, [5] excitation filter and [5] multi-wavelength LED. Figure 1-D is a photo of a portable phone-based fluorescence detector. The system also includes a computer to acquire and analyze images. In this optical configuration (Figure 2-C), the excitation source is directly in line with the image sensor. So, good quality excitation and emission filters are essential for blocking any excitation light reaching the detector, while still allowing the fluorescence emission to be transmitted. The LED illumination module (Sun et al. 2010a) was used for fluorophore excitation and it is capable of exciting multiple fluorophores over wide excitation spectrum of 450–650 nm (red 610–650 nm, green 510–550 nm, and blue 450–500 nm). The fluorescein example has a peak excitation wavelength of 494 nm and an emission maximum of 521 nm.
Figure 2. Computational image enhancement of images captured from Webcam video.
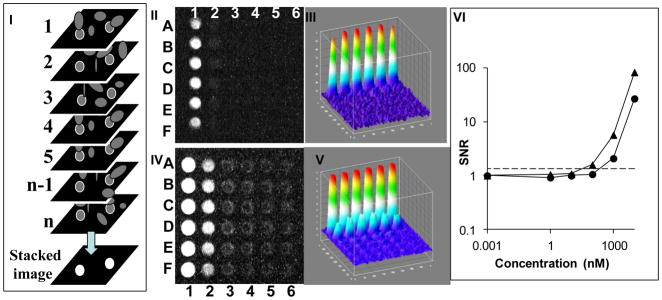
A schematic of image stacking for enhanced imaging is shown in (I). In video mode, the webcam captures n individual frames each with underlying signal of interest (marked with white circles), and interfering noise. In image stacking, the pixels of the n individual frames are averaged together, which reduces the standard deviation of this background noise and its mean value can be subtracted from each pixel, resulting in an enhanced signal to noise ratio. A thirty six well plate was loaded with six concentrations of fluorescein (column 1–6) each in six replicas (rows A–F). The plate was illuminated by a blue LED equipped with a blue excitation filter, and the plate was measured with a green emission filter. The signals of the wells were detected by the CMOS Webcam operating in a still single frame mode (II). The corresponding ImageJ 3D image is shown in (III). The same plate analyzed in video mode and image enhanced by image stacking is shown in (IV) with the corresponding ImageJ 3D image in (V). The signal-to-noise ratios (SNR) for both modes were plotted against the various fluorescein concentrations (VI). Triangles are data points for video captured stacked images and circles are single image mode with no stacking. The LOD (the mean plus three times standard deviation of a control (water) is marked as a dashed line. The fluorescein concentrations used were (column #1–6): 10,000 nM, 1000 nM, 100 nM, 10 nM, 1nM and control (water).
3.2 Computational image enhancement to improve detection sensitivity
A computational image enhancement of images captured from webcam video (Balsam et al. 2012a) was also used to increase the sensitivity of mHealth detection. The schematic of image stacking for enhanced imaging is shown in Figure 2-I. In video mode, the webcam captures n individual frames each with underlying signal of interest (marked with white circles) and noise. In image stacking, the pixels of the n individual frames are averaged together (stacked image), which reduces the standard deviation of this background noise, and its mean value can be subtracted from each pixel, resulting in an enhanced signal to noise ratio.
A thirty-six well plate array (see Materials and Methods) was loaded with serial dilutions of fluorescein in the range of 0–3320 ng/ml (0–10,000 nM) in columns 1–6 (Figure 2-II), each in six replicas (Figure 2-II, rows A–F). The plate was illuminated by a blue LED equipped with a blue excitation filter, and the plate was measured with a green emission filter. The signals of the wells were detected by the CMOS Webcam operating in a still single frame mode (Figure 2-II). The corresponding ImageJ 3D image is shown in Figure 2-III. The same plate was analyzed in video mode image enhanced by image stacking is shown in (Figure 2-IV) with the corresponding ImageJ 3D image in (Figure 2-V) demonstrating a higher level of detection of the stacked image (Figure 2-V compared to Figure 2-III).
The signal-to-noise ratio (SNR) for both single-image mode and video mode was plotted against various fluorescein concentrations (Figure 2-VI). The LOD of the webcam was calculated as the mean pixel value in the six water samples plus three times the standard deviation of these samples. The LOD is indicated as a horizontal dashed line in Figure 2-VI. When concentrations of fluorescein which yielded a mean signal out of six replicates above this limit, they were considered to be detected. The LOD for the plate array, with no stacking (Figure 2-II) was 1000nM for fluorescein and with image stacking (Figure 2-IV) it was 100nM, an order of magnitude more sensitive than without stacking.
The same approach was used for portable phone analysis with an exposure time of 1/15s and the gain set to maximum (800 ISO). Without stacking the LOD was 1000nM for fluorescein, similar to the webcam results (data not shown).
3.3 Optical amplification of fluorescence signal to improve detection sensitivity
To increase detection sensitivity, a capillary array (Figure 1-A) was used to amplify the optical signal. The capillaries are illuminated by the multi-wave length LED emitting parallel to the capillary axis (Figure 1-C). The light-wave energy propagating through the capillary walls excites the fluorescein molecules (via evanescent waves), which emit light at a peak of 521 nm. This light is detected at the end of the capillary by portable phone camera, webcam or any other imager.
Serial dilutions of fluorescein were analyzed using a ten-fold serial dilution (0 nM, 0.01 nM, 0.1 nM, 1 nM, 10 nM, 100 nM). As before, exposure time for the cell phone camera was set to 1/15s and the gain set to maximum (800 ISO). Figure 3-III is a plot of the mean signal from each concentration of fluorescein in the capillary array as detected by the cell phone camera with a LOD of 10 nM (Figure 3-III) compared to a LOD 1000 nM without the capillary. This suggests that the optical signals in the capillaries are ~100X higher than the plate signal for the same volume of fluorescein.
Figure 3. Waveguide capillary array fluorescence amplification images captured with mobile phone.

A thirty six capillary array was loaded with six concentrations of fluorescein (column 1–6) each in six replicas (rows A–F). The capillary array was analyzed by a mobile phone operating in a still, single frame mode (I). The corresponding ImageJ 3D image is shown in (II). The signal-to-noise ratio (SNR) was plotted against the various fluorescein concentrations (III). The fluorescein concentrations used were (columns #1–6): 100 nM, 10 nM, 1 nM, 0.1 nM, 0.01 nM and control (water). The LOD is marked as a dashed line.
3.4 Combine detection modes utilizing computational image enhancement and optical amplification to improve detection sensitivity
The computational image enhancement of images captured from a webcam video enables a 10X decrease (i.e. improvement) in LOD (Figure 2-V), and the optical amplification using capillary tubes enables a 100X decrease in LOD (Figure 3-III). Therefore, we combined both detection approaches using the webcam camera in video mode to image the capillary array, and then processed the images by image stacking.
In this experiment, ten-fold serial dilution (0 nM, 0.01 nM, 0.1 nM, 1 nM, 10 nM, 100 nM) of fluorescein in the capillary array was analyzed by the webcam using single frames without stacking (Figure 4-I) or in video mode followed by image stacking (Figure 4-III). Figure 4-V is a plot of the mean signal from each concentration of fluorescein in the capillary array as detected by the webcam camera. In single frame mode an LOD of 10 nM was calculated, compared to the LOD of 1000 nM without the capillaries (Figure 2-II). This 100X decrease in LOD is similar to the 100X decrease in LOD shown for the mobile phone detection (Figure 3-III). The use of the video mode followed by image stacking decreased the LOD by another 10X to a LOD of 1 nM (Figure 4-III). This combination enabled a 1000X decrease in LOD from 1000 nM (Figure 2-V) to 1 nM (Figure 4-V).
Figure 4. Waveguide capillary array fluorescence amplification combined with computational image enhancement.
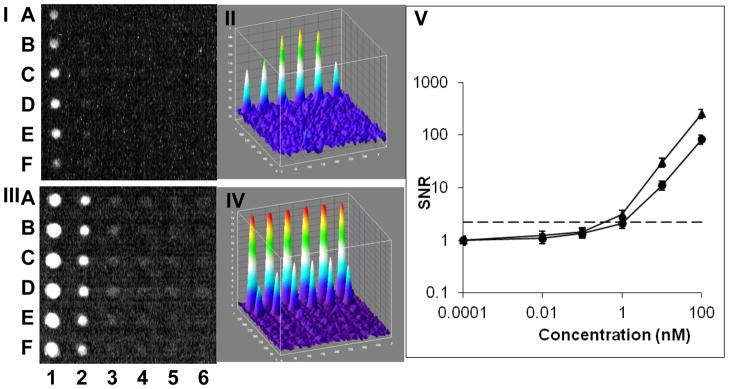
A thirty six capillary array was loaded with six concentrations of fluorescein (column 1–6) each in six replicas (rows A–F). The capillary array was analyzed by a webcam operating in a still single frame mode (I). The corresponding ImageJ 3D image is shown in (II). The same capillary array was analyzed in video mode and the image was enhanced by image stacking, shown in (III) with the corresponding ImageJ 3D image in (IV). The signal-to-noise ratio (SNR) was plotted against the various fluorescein concentrations (V). Triangles are data points for video captured stacked images and circles are single image mode with no stacking. The LOD (the mean plus three times standard deviation of a control (water)) is marked as a dashed line. The fluorescein concentrations used were (columns #1–6): 100 nM, 10 nM, 1 nM, 0.1 nM, 0.01nM and control (water).
3.5 Adenoviruses detection by gel electrophoresis and fluorimetry
Adenoviruses, linear dsDNA viruses, are the most common cause of respiratory illness. In addition, adenovirus is a cause of gastroenteritis, cystitis, conjunctivitis and rashes. We amplified Adenovirus DNA with PCR and labeled it with SYBR Green or fluorescein. The 167-bp amplicon was analyzed in several different ways, using either gel electrophoresis or fluorimetry with a plate reader, or fluorimetry with our capillary florescent detector. As shown in Figure 5A, Adenovirus DNA stained with SYBR Green was detected using gel electrophoresis at a concentration of 5 ug/mL and fluorescein-stained DNA was detected at a concentration of 1 ug/ml. The DNA stained with SYBR Green or fluorescein was also analyzed by a plate reader and the capillary array. Figure 5B shows these results for SYBR Green. The LOD for the capillary array and plate reader were 5 ug/mL and 1 ug/mL, respectively. Similar results were obtained using DNA stained with fluorescein (Figure 5C): the LOD of the capillary array was calculated to be 0.4 ug/mL and that of the plate reader calculated at 0.08 ug/mL. With both dyes, the plate reader had a limit of detection approximately five times lower than that of the capillary array. Although the mean SNR for each concentration from both devices was similar, the variance of the measurements from the capillary array was higher than that of the plate reader. This resulted in a higher calculated LOD.
Figure 5. Adenoviruses detection by gel electrophoresis and fluorimetry.

Adenovirus DNA was amplified with PCR. The 167-bp amplicon was labeled with SYBR Green or fluorescein and was analyzed by gel electrophoresis (A). In addition, the labeled DNA was measured by fluorimetry with a plate reader or with our capillary array using either SYBR Green (B) or fluorescein (C).
Panel A shows gel separation of a 10X serial dilution of Adenovirus DNA stained with SYBR Green (lanes 1–4): lane 1 - undiluted DNA at 600 ug/mL; lane 2 – 60 ug/mL; lane 3 – 6 ug/mL; lane 4 – 600 ng/mL. The DNA samples were also stained with fluorescein (lanes 5–7): lane 5 – 10 ug/mL; lane 6 - 1 ug/mL; lane 7 – 100 ng/mL. Lane 8 shows a 100 bp DNA ladder.
Panel B shows the SYBR green stained 5X serial dilution (125, 25, 5, 1, and 0.2 ug/mL) analyzed by fluorimetry. The signal-to-noise ratio (SNR) was plotted against the various DNA concentrations. Triangles are data points for plate reader measurements, and rectangles are capillary array measurements
4. Conclusions
In recent years mHealth technologies were developed for many diverse biomedical applications (Mudanyali et al. 2012), (Zhu et al. 2012), (Zhu et al. 2011b), (Zhu et al. 2011a), (Tseng et al. 2010), (Boyce et al. 2011; Rosado et al. 2012; Wadhawan et al. 2011), (Stedtfeld et al. 2012), (Wang et al. 2011), (Bourquin et al. 2011), (Lee et al. 2011b), (Zhang et al. 2011), (Lee et al. 2011a). The limiting factor for the clinical utility of such technologies is the low sensitivity of the mobile device. In this work, we demonstrated that such a limitation can be overcome by increasing the sensitivity of optical detection 1000X through a combination of capillary waveguides and image stacking using LED optical excitation in a simple optical configuration (inline horizontal excitation and horizontal detection).
To demonstrate the capability of this new technique, we analyzed Adenovirus DNA stained with SYBR green or fluorescein and compared our results to measurements with a plate reader using a 5X serial dilution. Although the mean SNR for each concentration from both devices was similar, the plate reader had a LOD approximately five times lower than that of the capillary array. This was due mainly to the variance of the measurements from the capillary array being higher than that of the plate reader suggesting that for low LOD better uniformity of capillaries is needed.
For mHealth fluorescent detection applications, the high sensitivity of the capillary array may enable the performance of sensitive florescent based assays using portable devices with detection level similar or better than conventional plate readers while reducing the size of the sample needed by a factor of 10. The approach described in this work is generally applicable, and can be utilized to increase sensitivity of many other optical detectors for mHealth that are easily deployed as medical diagnostic techniques in resource-poor settings for global health. The relative low cost of the reusable capillary array (~5 cents per capillary with the cost of a 36 capillary array of ~$1.80), as well as the availability of low cost components (LEDs, mobile phones etc) makes this technology suitable for use in low income countries
While decreasing the LOD is critical for clinical utility, sustainability is another critical element for utilizing mHealth technologies for low income countries. Sustainable technologies are technologies which are based on low cost components available in those countries (e.g. consumer electronic components, plastics etc), and the devices must be simple to operate and maintain so they can be supported locally by minimally trained technicians. In addition to sustainability, effective mHealth analytical devices for underserved populations especially in remote locations should be portable. The device described in this work addresses these constraints by utilizing consumer-grade electronic components readily available in low-resource settings. LEDs, webcams or mobile phones with cameras are ubiquitous throughout the world. Mobile phones and webcams connected to the internet also have the added advantage of connectivity, so they can be used for telemedicine. The remaining components (except the optical filters) are low cost, readily available, and the optical configuration demonstrated here is simple to fabricate, which suggests that the approach described here has the potential for facilitating the development of a variety of highly sensitive, low cost mHealth optical diagnostic platforms for resource-poor and global health settings.
Highlights.
The combination of the two signal amplification approaches, (a) the computational image stacking algorithm and (b) the capillary array optical signal amplification, enables a ~1000X increase in fluorescence signal sensitivity that has the potential to improve the sensitivity of many mHealth detectors and their clinical utility for many diagnostics applications.
Acknowledgments
This work was supported by the FDA’s Center for Devices and Radiological Health, Division of Biology and the National Cancer Institute. The views expressed are those of the authors and do not represent those of the U.S. Government.
Footnotes
Publisher's Disclaimer: This is a PDF file of an unedited manuscript that has been accepted for publication. As a service to our customers we are providing this early version of the manuscript. The manuscript will undergo copyediting, typesetting, and review of the resulting proof before it is published in its final citable form. Please note that during the production process errors may be discovered which could affect the content, and all legal disclaimers that apply to the journal pertain.
References
- Anderson GP, King KD, Gaffney KL, Johnson LH. Multi-analyte interrogation using the fiber optic biosensor. Biosens Bioelectron. 2000;14(10–11):771–777. doi: 10.1016/s0956-5663(99)00053-6. [DOI] [PubMed] [Google Scholar]
- Balsam J, Bruck HA, Kostov Y, Rasooly A. Image stacking approach to increase sensitivity of fluorescence detection using a low cost complementary metal-oxide-semiconductor (CMOS) webcam. Sensors and Actuators B: Chemical. 2012a;171–172:141–147. doi: 10.1016/j.snb.2012.02.003. [DOI] [PMC free article] [PubMed] [Google Scholar]
- Balsam J, Ossandon M, Bruck HA, Rasooly A. Modeling and design of micromachined optical Soller collimators for lensless CCD-based fluorometry. Analyst. 2012b;137(21):5011–5017. doi: 10.1039/c2an35729a. [DOI] [PubMed] [Google Scholar]
- Balsam J, Ossandon M, Kostov Y, Bruck HA, Rasooly A. Lensless CCD-based fluorometer using a micromachined optical Soller collimator. Lab on a chip. 2011;11(5):941–949. doi: 10.1039/c0lc00431f. [DOI] [PubMed] [Google Scholar]
- Bourquin Y, Reboud J, Wilson R, Zhang Y, Cooper JM. Integrated immunoassay using tuneable surface acoustic waves and lensfree detection. Lab on a chip. 2011;11(16):2725–2730. doi: 10.1039/c1lc20320g. [DOI] [PubMed] [Google Scholar]
- Boyce Z, Gilmore S, Xu C, Soyer HP. The remote assessment of melanocytic skin lesions: a viable alternative to face-to-face consultation. Dermatology. 2011;223(3):244–250. doi: 10.1159/000333363. [DOI] [PubMed] [Google Scholar]
- Cosford RJ, Kuhr WG. Capillary biosensor for glutamate. Anal Chem. 1996;68(13):2164–2169. doi: 10.1021/ac9510705. [DOI] [PubMed] [Google Scholar]
- Flanagan MT, Sloper AN. USPTO, editor. Waveguide sensor with inpout and reflectinh granting and its use in immunoassay. USPTO; U.S: 1992. [Google Scholar]
- Hay Burgess DC, Wasserman J, Dahl CA. Global health diagnostics. Nature. 2006;444(Suppl 1):1–2. doi: 10.1038/nature05440. [DOI] [PubMed] [Google Scholar]
- Istepanian R, Jovanov E, Zhang YT. Introduction to the special section on M-Health: beyond seamless mobility and global wireless health-care connectivity. IEEE transactions on information technology in biomedicine: a publication of the IEEE Engineering in Medicine and Biology Society. 2004;8(4):405–414. doi: 10.1109/titb.2004.840019. [DOI] [PubMed] [Google Scholar]
- Lee D, Chou WP, Yeh SH, Chen PJ, Chen PH. DNA detection using commercial mobile phones. Biosens Bioelectron. 2011a;26(11):4349–4354. doi: 10.1016/j.bios.2011.04.036. [DOI] [PubMed] [Google Scholar]
- Lee DS, Jeon BG, Ihm C, Park JK, Jung MY. A simple and smart telemedicine device for developing regions: a pocket-sized colorimetric reader. Lab on a chip. 2011b;11(1):120–126. doi: 10.1039/c0lc00209g. [DOI] [PubMed] [Google Scholar]
- Ligler FS, Breimer M, Golden JP, Nivens DA, Dodson JP, Green TM, Haders DP, Sadik OA. Integrating waveguide biosensor. Anal Chem. 2002;74(3):713–719. doi: 10.1021/ac015607s. [DOI] [PubMed] [Google Scholar]
- Misiakos K, Kakabakos SE. A multi-band capillary immunosensor. Biosens Bioelectron. 1998;13(7–8):825–830. doi: 10.1016/s0956-5663(98)00048-7. [DOI] [PubMed] [Google Scholar]
- Mudanyali O, Dimitrov S, Sikora U, Padmanabhan S, Navruz I, Ozcan A. Integrated rapid-diagnostic-test reader platform on a cellphone. Lab on a chip. 2012;12(15):2678–2686. doi: 10.1039/c2lc40235a. [DOI] [PMC free article] [PubMed] [Google Scholar]
- Plowman TE, Durstchi JD, Wang HK, Christensen DA, Herron JN, Reichert WM. Multiple-analyte fluoroimmunoassay using an integrated optical waveguide sensor. Anal Chem. 1999;71(19):4344–4352. doi: 10.1021/ac990183b. [DOI] [PubMed] [Google Scholar]
- Rosado L, Castro R, Ferreira L, Ferreira M. Extraction of ABCD rule features from skin lesions images with smartphone. Studies in health technology and informatics. 2012;177:242–247. [PubMed] [Google Scholar]
- Rowe CA, Tender LM, Feldstein MJ, Golden JP, Scruggs SB, MacCraith BD, Cras JJ, Ligler FS. Array biosensor for simultaneous identification of bacterial, viral, and protein analytes. Anal Chem. 1999;71(17):3846–3852. doi: 10.1021/ac981425v. [DOI] [PubMed] [Google Scholar]
- Sapsford KE, Francis J, Sun S, Kostov Y, Rasooly A. Miniaturized 96-well ELISA chips for staphylococcal enterotoxin B detection using portable colorimetric detector. Anal Bioanal Chem. 2009;394(2):499–505. doi: 10.1007/s00216-009-2730-z. [DOI] [PubMed] [Google Scholar]
- Silzel JW, Cercek B, Dodson C, Tsay T, Obremski RJ. Mass-sensing, multianalyte microarray immunoassay with imaging detection. Clin Chem. 1998;44(9):2036–2043. [PubMed] [Google Scholar]
- Stedtfeld RD, Tourlousse DM, Seyrig G, Stedtfeld TM, Kronlein M, Price S, Ahmad F, Gulari E, Tiedje JM, Hashsham SA. Gene-Z: a device for point of care genetic testing using a smartphone. Lab on a chip. 2012;12(8):1454–1462. doi: 10.1039/c2lc21226a. [DOI] [PubMed] [Google Scholar]
- Sun S, Francis J, Sapsford KE, Kostov Y, Rasooly A. Multi-wavelength Spatial LED illumination based detector for in vitro detection of Botulinum Neurotoxin A Activity. Sensors and actuators B, Chemical. 2010a;146(1–8):297–306. doi: 10.1016/j.snb.2010.02.009. [DOI] [PMC free article] [PubMed] [Google Scholar]
- Sun S, Ossandon M, Kostov Y, Rasooly A. Lab-on-a-chip for botulinum neurotoxin a (BoNT-A) activity analysis. Lab on a chip. 2009;9(22):3275–3281. doi: 10.1039/b912097a. [DOI] [PMC free article] [PubMed] [Google Scholar]
- Sun S, Yang M, Kostov Y, Rasooly A. ELISA-LOC: lab-on-a-chip for enzyme-linked immunodetection. Lab on a chip. 2010b;10(16):2093–2100. doi: 10.1039/c003994b. [DOI] [PubMed] [Google Scholar]
- Tseng D, Mudanyali O, Oztoprak C, Isikman SO, Sencan I, Yaglidere O, Ozcan A. Lensfree microscopy on a cellphone. Lab on a chip. 2010;10(14):1787–1792. doi: 10.1039/c003477k. [DOI] [PMC free article] [PubMed] [Google Scholar]
- Urdea M, Penny LA, Olmsted SS, Giovanni MY, Kaspar P, Shepherd A, Wilson P, Dahl CA, Buchsbaum S, Moeller G, Hay Burgess DC. Requirements for high impact diagnostics in the developing world. Nature. 2006;444(Suppl 1):73–79. doi: 10.1038/nature05448. [DOI] [PubMed] [Google Scholar]
- Wadhawan T, Situ N, Rui H, Lancaster K, Yuan X, Zouridakis G. Implementation of the 7-point checklist for melanoma detection on smart handheld devices. Conference proceedings: .. Annual International Conference of the IEEE Engineering in Medicine and Biology Society IEEE Engineering in Medicine and Biology Society Conference. 2011;2011:3180–3183. doi: 10.1109/IEMBS.2011.6090866. [DOI] [PMC free article] [PubMed] [Google Scholar]
- Wadkins RM, Golden JP, Pritsiolas LM, Ligler FS. Detection of multiple toxic agents using a planar array immunosensor. Biosens Bioelectron. 1998;13(3–4):407–415. doi: 10.1016/s0956-5663(97)00113-9. [DOI] [PubMed] [Google Scholar]
- Wang S, Zhao X, Khimji I, Akbas R, Qiu W, Edwards D, Cramer DW, Ye B, Demirci U. Integration of cell phone imaging with microchip ELISA to detect ovarian cancer HE4 biomarker in urine at the point-of-care. Lab on a chip. 2011;11(20):3411–3418. doi: 10.1039/c1lc20479c. [DOI] [PMC free article] [PubMed] [Google Scholar]
- Weigl BH, Holobar A, Trettnak W, Klimant I, Kraus H, O’Leary P, Wolfbeis OS. Optical triple sensor for measuring pH, oxygen and carbon dioxide. Journal of biotechnology. 1994;32(2):127–138. doi: 10.1016/0168-1656(94)90175-9. [DOI] [PubMed] [Google Scholar]
- Yager P, Domingo GJ, Gerdes J. Point-of-care diagnostics for global health. Annual review of biomedical engineering. 2008;10:107–144. doi: 10.1146/annurev.bioeng.10.061807.160524. [DOI] [PubMed] [Google Scholar]
- Zhang G, Li C, Lu Y, Hu H, Xiang G, Liang Z, Liao P, Dai P, Xing W, Cheng J. Validation of a mobile phone-assisted microarray decoding platform for signal-enhanced mutation detection. Biosens Bioelectron. 2011;26(12):4708–4714. doi: 10.1016/j.bios.2011.05.031. [DOI] [PubMed] [Google Scholar]
- Zhu H, Mavandadi S, Coskun AF, Yaglidere O, Ozcan A. Optofluidic fluorescent imaging cytometry on a cell phone. Anal Chem. 2011a;83(17):6641–6647. doi: 10.1021/ac201587a. [DOI] [PMC free article] [PubMed] [Google Scholar]
- Zhu H, Sikora U, Ozcan A. Quantum dot enabled detection of Escherichia coli using a cell-phone. Analyst. 2012;137(11):2541–2544. doi: 10.1039/c2an35071h. [DOI] [PMC free article] [PubMed] [Google Scholar]
- Zhu H, Yaglidere O, Su TW, Tseng D, Ozcan A. Wide-field fluorescent microscopy on a cell-phone. Conference proceedings: .. Annual International Conference of the IEEE Engineering in Medicine and Biology Society. IEEE Engineering in Medicine and Biology Society Conference. 2011b;2011:6801–6804. doi: 10.1109/IEMBS.2011.6091677. [DOI] [PubMed] [Google Scholar]