
Figure 3.
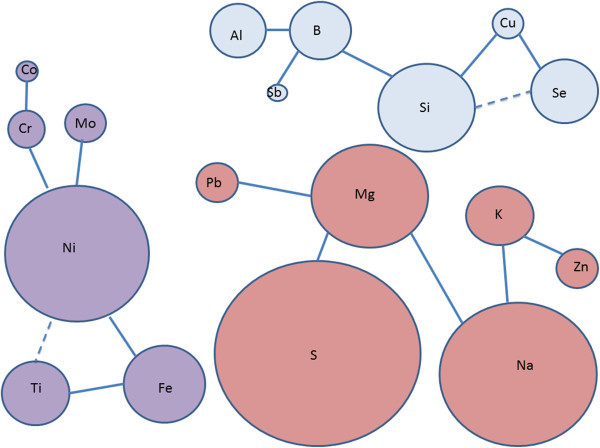
The correlation between trace elements in tooth enamel. In scheme straight lines represent the positive correlations and dotted lines represent the negative ones. Differences in the size of circles are directly proportional to the concentration difference among the correlated elements.