Abstract
The purpose of this study was to analyze background parenchymal enhancement (BPE) in the contralateral normal breast of cancer patients during the course of neoadjuvant chemotherapy (NAC). Forty-five subjects were analyzed. Each patient had 3 MRIs, one baseline (B/L) and 2 follow-up (F/U) studies. The fibroglandular tissue in the contralateral normal breast was segmented using a computer-assisted algorithm. Based on the segmented fibroglandular tissue, BPE was calculated. BPE measured in baseline (B/L) and follow-up (F/U) MR studies were compared. The baseline BPE was also correlated with age and compared between pre/peri (< 55 y/o) and post-menopausal women (≥55 y/o). The pre-treatment BPE measured in B/L MRI was significantly higher in women <55 y/o than in women ≥55 y/o (20.1±7.4 % vs. 12.1±5.1 %, p ≤ 0.01). A trend of negative correlation between BPE and age was noted (r = −0.29). In women <55 y/o, BPE at F/U-1 (18.8±6.9 %) was decreased compared to B/L, and was further decreased in F/U-2 (13.3±5.7 %) which was significant compared to B/L and F/U-1. In women ≥55 y/o, no significant difference was noted in any paired comparison among B/L, F/U-1 and F/U-2 MRI. A higher baseline BPE was associated with a greater reduction of BPE in F/U-2 MRI (r = 0.73). Our study showed that younger women tended to have higher BPE than older women. BPE was significantly decreased in F/U-2 MRI after NAC in women <55 y/o. The reduction in BPE was most likely due to the ovarian ablation induced by chemotherapeutic agents.
INTRODUCTION
Contrast enhancement in normal fibroglandular breast tissue of women, namely background parenchymal enhancement (BPE), is commonly observed in dynamic contrast enhanced (DCE)-MRI. Multiple factors, including age, menstrual or menopausal status, and the use of hormones can affect breast glandular tissue enhancements [1–5]. A marked BPE is more commonly seen in younger women, and the degree of BPE naturally decreases with age [5, 6]. BPE can be measured qualitatively by visually evaluating the degree of enhancement as severe (marked), intermediate (moderate), mild and absent (minimal) [6–8]. Or, it can be measured quantitatively by manually placing a region of interest (ROI) on the most enhancing part of the normal tissue [7]. These two methods are subject to rater variations. Alternatively, BPE can be measured precisely based on segmented fibroglandular tissue in the breast, by averaging the enhancements from all pixels [9].
BPE may influence the diagnostic performance of breast MRI. It was noted that the degree of background tissue enhancement might affect the detection sensitivity of breast MRI [1, 2, 8, 10], as well as the staging of cancer [11]. It was shown that for evaluating tumor extent, the accuracy of MRI with moderate/marked BPE was significantly lower than that with minimal/mild BPE [11, 12]. Also, the detection of non-mass-like enhancements, such as ductal carcinoma in situ (DCIS), is more difficult in the presence of moderate/marked BPE [11].
A recent study examining the relationships between breast cancer and both amount and the enhancement of fibroglandular tissue at MRI has found that increased BPE is strongly predictive of breast cancer odds [13]. The breast cancer odds also increased with increasing amount of fibroglandular tissue, but the BPE remained significant after adjustment for the amount of fibroglandular tissue [13].
Neoadjuvant chemotherapy (NAC) has been increasingly used for treatment of breast cancer, and MRI is commonly used to monitor the tumor response during and after NAC. The value of BPE surrounding primary breast tumors in the diseased breast on MRI was noted to be associated with response to NAC [14]. Change of BPE in the contralateral normal breast following NAC has not been studied before. Since BPE may affect the detection of residual tumor or contralateral breast lesions, it may be clinically important to investigate how BPE changes following the administration of chemotherapeutic regimens. A previous study has found that the breast density (characterized by fibroglandular tissue volume and the percent density by normalizing fibroglandular tissue volume to the total breast volume) is decreased in patients receiving NAC [15], and that the density reduction was most likely mediated through the suppression of ovarian function due to chemotherapy [16, 17]. It was noted that the likelihood of permanent chemotherapy-induced menopause is directly related to age [16]. Older age and the addition of taxane to doxorubicin and cyclophosphamide (AC) increased the risk of chemotherapy-induced amenorrhea (CIA) and the amenorrhea was more likely to be irreversible for women >40 [17].
In the present study we investigated the degree of BPE in the contralateral normal breast of patients undergoing NAC. The pre-treatment baseline BPE was correlated with age, and compared between pre/peri-menopausal women (< 55 years old) and post-menopausal women (≥55 years old). The BPE measured in baseline and follow-up MRI studies during the course of NAC treatment was compared to evaluate the impact of chemotherapy on BPE.
MATERIALS AND METHODS
Subjects
This retrospective study was approved by the institutional review board and was HIPAA compliant. All patients gave informed consent to participate in the breast MRI studies. Forty-five subjects (30 y/o – 72 y/o, mean 48 y/o) were analyzed in this study. The patient cohort was recruited in a period of three and a half years (from March 2003 to August 2006) among 65 patients who elected to receive NAC either due to inoperable tumor or with clinically documented lymph node involvement. Each NAC patient received several MRI scans for response monitoring. In this study, only those patients who had the baseline (B/L) MRI prior to the NAC, the first follow-up (F/U-1) MRI after two cycles of doxorubicin (Adriamycin) and cyclophosphamide (AC), and the second follow-up (F/U-2) MRI after four cycles of AC or two cycles of AC plus one month of taxane regimen were included for data analysis. In total, 45 patients were studied. Twenty patients out of the initial 65 patients were excluded from this study due to lack of baseline MRI (N=2), lack of F/U-1 MRI (N=11), and lack of F/U-2 MRI (N=7). Of the 45 patients, thirty-three women were < 55 y/o, and twelve were ≥ 55 years of age. Thirty-nine women had pathology-proven invasive ductal cancers (IDC), five had infiltrating lobular cancers (ILC), and one had IDC mixed with ILC. The baseline tumor size ranged from 0.5cm to 9.9cm (mean±STD = 4.1cm±2.5cm). According to the American Joint Committee on Cancer (AJCC) TNM system, 10 patients had stage I cancer and 35 patients had stage II cancer. Of the 45 women, 25 had estrogen receptor (ER) positive cancers and 20 had ER negative cancers. Twenty-four women had Her-2 positive cancers and 21 had Her-2 negative cancer. Five women had triple negative cancers. Twenty-seven women had cancers in left breast and 18 had cancers in right breast. In the present study, only the contralateral normal breast was analyzed. Thirty-four of the 45 patients in this study had been investigated and reported before [15]. However, the purpose of these two studies was different. The previous paper was to investigate the reduction of breast density, and the current study was to measure background parenchymal enhancement.
Neoadjuvant Chemotherapy
Biweekly AC was administered as the first-line regimen. After 2 cycles of AC, the patients continued to receive 2 additional cycles of AC or were switched to a taxane-based regimen based on the oncologist’s evaluation. The second-line taxane-based regimen comprised paclitaxel or Nab-paclitaxel (Abraxane, albumin-bound nanoparticle of paclitaxel), combined with carboplatin. All Her-2 positive patients also received trastuzumab. Her-2 negative patients also received bevacizumab.
MRI Studies
The breast MRI study was performed on a 1.5 Tesla MR scanner (Philips Medical Systems, Cleveland, OH) with a dedicated 4-channel breast coil. The imaging protocol included sagittal view pre-contrast T1-weighted imaging, and axial view bilateral dynamic contrast-enhanced MR imaging using a 3D Spoiled Gradient Recalled (SPGR) pulse sequence with 16 frames, including 4 pre-contrast and 12 post-contrast sets. The parameters were TR = 8.1 ms, TE = 4.0 ms, flip angle = 20 degrees, 32 axial partitions with slice thickness = 4 mm, matrix size = 256 x128, field of view = 32–38 cm. Gadodiamide (Omniscan, GE Healthcare) contrast agent was injected 0.1 mmol/kg in about 15 sec at the beginning of the fifth acquisition followed by 10 cc saline for flushing. The scan time was 42 seconds per acquisition.
Breast and Fibroglandular Tissue Segmentation
For each case, the side of contralateral normal breast was identified. The fibroglandular tissues on all imaging slices were segmented by an experienced operator (HY, a medical physicist with 5 years of experience in segmenting breast MRI) by using a computer-assisted algorithm [18]. This method has small measurement errors, with the intra-operator variation of 2.8% and inter-operator variation of 3.8% [18]. The measurement variation caused by body position is in the range of 3%–4% [18]. To ensure consistency, the operator had to go through training process using test datasets and demonstrated that the measurements done on two occasions could reach < 5% measurement variation. The superior (the beginning slice) and inferior (the ending slice) boundaries of the breast were determined by comparing the thickness of breast fat with the body fat. Non-breast subcutaneous fat on the chest typically displays homogenous thickness across the chest wall, whose fat-air boundary is closely parallel with the chest wall-fat boundary [19].
The procedures for the breast and fibroglandular tissue segmentation consisted of: (a) determining the posterior boundary of the breast by performing an initial V-shaped cutting at the aortic arch level using three body landmarks, (b) applying a fuzzy c-means – based segmentation algorithm with the B-spline curve fitting to remove other chest wall tissues and to obtain the chest-breast boundary, (c) performing a vertical line perpendicular to the sternum in the middle to separate between the right and the left breasts, (d) applying dynamic searching to exclude the skin along the breast boundary to obtain the final breast boundary and breast volume, (e), applying the adaptive fuzzy c-means algorithm for bias field correction to remove image signal intensity nonuniformities and to segment the fibroglandular tissue from the surrounding fatty tissue. Using the standard fuzzy c-means (FCM) algorithm, all pixels on the image were classified into 6 clusters; 3 as fibroglandular tissues and the other 3 as fatty tissues. After completing the segmentation from all imaging slices, the volume of fibroglandular tissue (FV) was calculated. The percent density (PD) is calculated by dividing the FV by the whole breast volume x 100%.
Calculation of BPE
BPE was defined as the average of the contrast enhancements measured from all pixels contained within the segmented fibroglandular tissue. BPE indicated a percent (%) increase of enhancement after contrast injection (BPE= (Senh – Snon-enh/Snon-enh) x 100%, where Senh denoted the signal intensity of the enhanced images and Snon-enh denoted the averaged signal intensity of the 4 non- enhanced imaging sets). The calculation was done for each of the 12 post-contrast frames acquired during the 7 minutes DCE period, and a mean BPE for each case was obtained by averaging over all 12 time points. Also, the mean enhancements in 3 DCE time segments, defined as ‘early’ (the first 4 post-contrast frames, approximately 1–3 min), ‘middle’ (the next 4 frames, 3–5 min), and ‘late’ (the last 4 frames, 5–7 min), were calculated separately.
Statistics
The patients were separated into pre/peri-menopausal (<55 years old) versus post-menopausal groups (≥55 years old) for comparison. The BPE in B/L, F/U-1 and F/U-2 were compared using the two-tailed paired t-test. P < 0.05 was considered as significant. A Pearson correlation test was used to correlate the baseline BPE with age, the reduction of BPE with the baseline BPE, and the baseline BPE with the percent density. The correlation coefficient of |r|<0.4 is considered as a weak correlation, 0.4≤ |r| ≤0.7 as moderate, and |r|>0.7 as a strong correlation.
RESULTS
Comparison of BPE in Women < 55 y/o vs. ≥55 y/o
The mean BPE calculated from the entire DCE period and the early, middle, and late DCE time segments in the group of women < 55 y/o and ≥55 y/o are listed in Table 1. The enhancement kinetics shows the persistent enhancing pattern, and the mean values in the early to middle to the last DCE time segments shows a clear increasing trend. The mean BPE (%) from the entire DCE period was higher in the < 55 y/o group compared to ≥55 y/o group (20.1±7.4 vs. 12.1±5.1, p=0.01 for B/L MRI; 18.8±6.9 vs. 11.0 ±3.8, p=0.02 for F/U-1 MRI; and 13.3±5.7 vs. 11.8±4.8, p=0.6 for F/U-2 MRI). The BPE in the baseline MRI before the starting of treatment showed a trend of weak negative correlation with age (r = − 0.29, p=0.05, Figure 1).
Table 1.
Background parenchymal enhancement (mean ± standard deviation, %) in the group women < 55 y/o and ≥55 y/o
| Baseline MRI | F/U-1 MRI | F/U-2 MRI | ||
|---|---|---|---|---|
| < 55 y/o | Entire DCE period | 20.1±7.4 | 18.8±6.9 | 13.3±5.7 *† |
| Early (1~3 min) | 12.1±9.5 | 11.4±10.5 | 7.1±5.6 *† | |
| Middle (3~5 min) | 22.0±14.9 | 20.5±15.8 | 14.6±10.1 *† | |
| Late (5~7 min) | 26.2±15.9 | 24.7±16.5 | 18.1±11.4 *† | |
| ≥55 y/o | Entire DCE period | 12.1±5.1 | 11.0 ±3.8 | 11.8±4.8 |
| Early (1~3 min) | 6.5±4.3 | 7.0±5.4 | 6.6±4.0 | |
| Middle (3~5 min) | 13.8±7.1 | 11.5±6.8 | 13.9±9.7 | |
| Late (5~7 min) | 16.1±8.9 | 14.5±7.9 | 14.8±8.3 |
significantly lower compared to the Baseline value
significantly lower compared to the F/U-1 value
Figure 1.
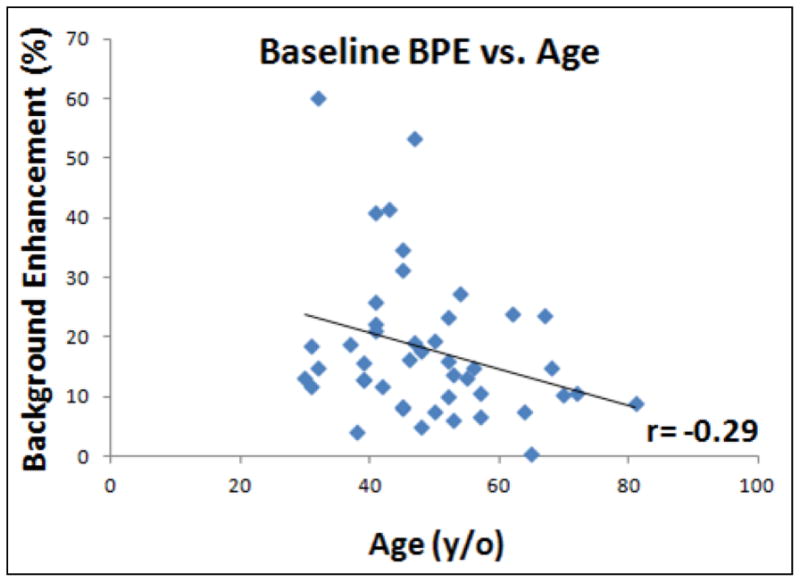
Correlation of mean BPE measured in baseline MRI with age. BPE decreases with age, but there is a high individual variation and the overall correlation is weak with r = − 0.29.
Change of BPE during Chemotherapy
The mean enhancement curves in the B/L, F/U-1 and F/U-2 MRI studies are plotted in Figure 2. In the group of women < 55 y/o, the mean BPE (%) shows a clear decreasing trend from B/L MRI to F/U-2 MRI with chemotherapy (20.1±7.4 at B/L to 18.8±6.9 at F/U-1 to 11.8±4.8 at F/U-2). For the entire DCE period and the early, middle, and late DCE time segments, the BPE at F/U-2 was significantly decreased compared to B/L (p=0.0002, p=0.0003, p=0.0005, and p=0.0003 respectively) and F/U-1 (p=0.0004, p=0.001, p=0.0006, and p=0.0004 respectively), but the difference between F/U-1 and B/L was not significant (p=0.48) (Table 1). The percent BPE reduction at F/U-2 compared to the baseline value is −30%±40%, −24%±35%, and −23%±37% for early, middle and late DCE time segments, respectively. In contrast, there is not much change in the group of women ≥55 y/o. The mean BPE (%) was 12.1±5.1 at B/L, 11.0 ±3.8 at F/U-1, and 11.8±4.8 at F/U-2. When the percent reduction of BPE was compared to the baseline value, a strong correlation (r = 0.73, p<0.0001) was noted (Figure 3). Two case examples from one post-menopausal woman and one pre-menopausal woman are shown in Figures 4 and 5, respectively.
Figure 2.
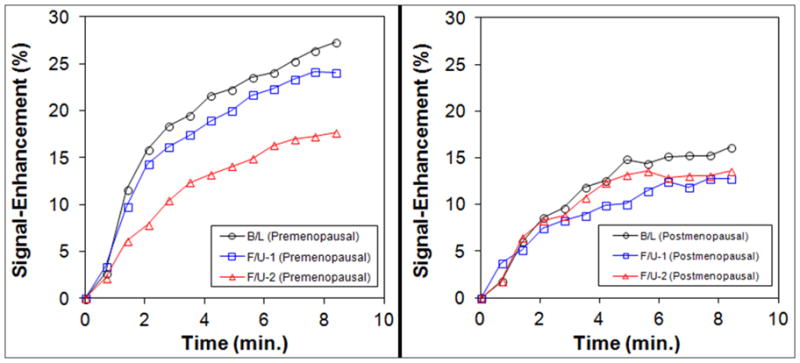
BPE before and after NAC in women < 55 y/o (left) and women ≥55 y/o (right). The enhancement scale in the y-axis is the same. It is clearly noted that the level of BPE is higher in the < 55 y/o than the ≥ 55 y/o groups. The BPE decreases from B/L to F/U-1 to F/U-2 in < 55 y/o group, but not in ≥ 55 y/o group.
Figure 3.
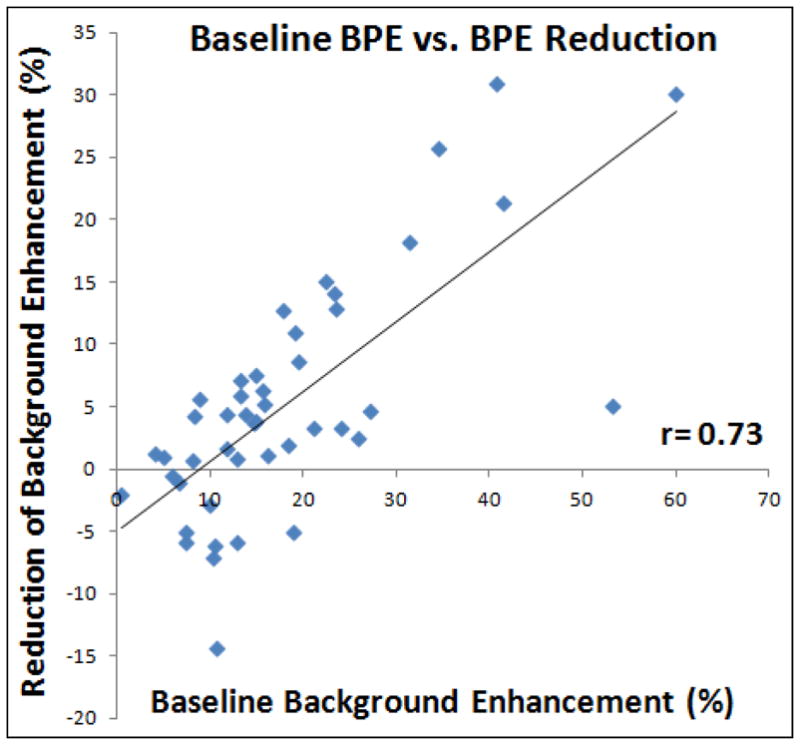
Correlation of the percent reduction of BPE at F/U-2 MRI compared to the B/L MRI with the baseline BPE. A higher baseline BPE is associated with a greater reduction, with r = 0.73.
Figure 4.
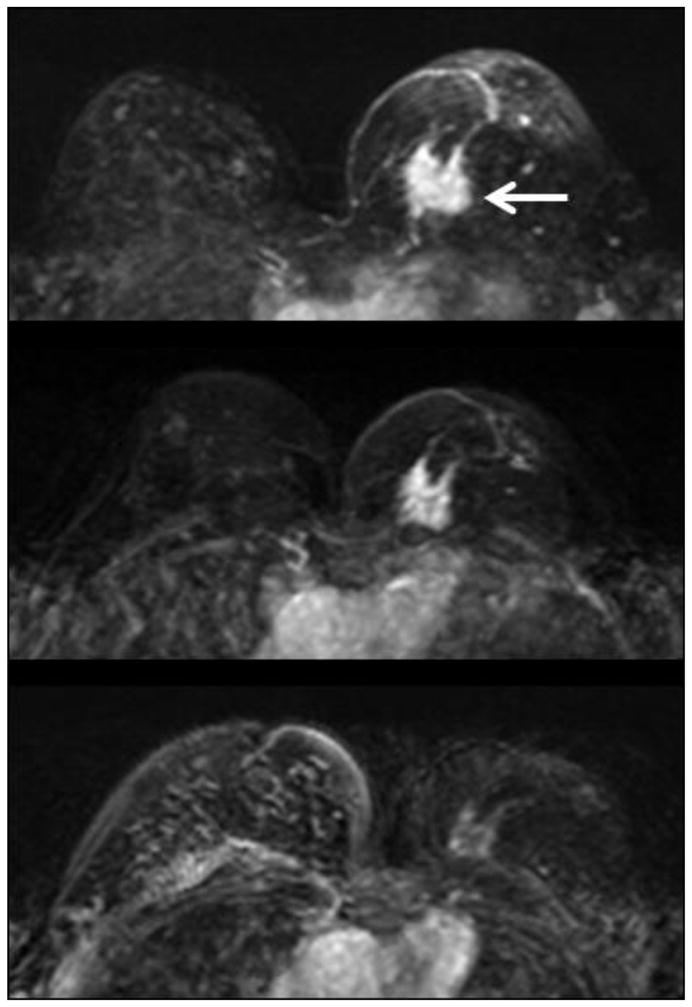
Maximal intensity projection images in a 56 y/o woman with a 3 cm hormonal positive and HER-2 negative invasive ductal cancer in the left breast (white arrow). Upper panel: baseline MRI; middle panel: F/U-1 MRI (after two cycles of AC); lower panel: F/U-2 MRI (after two cycles of AC+taxane). Note the scarce background enhancement in the fibroglandular tissue of the right breast, which does not show much change in these three MRI studies.
Figure 5.
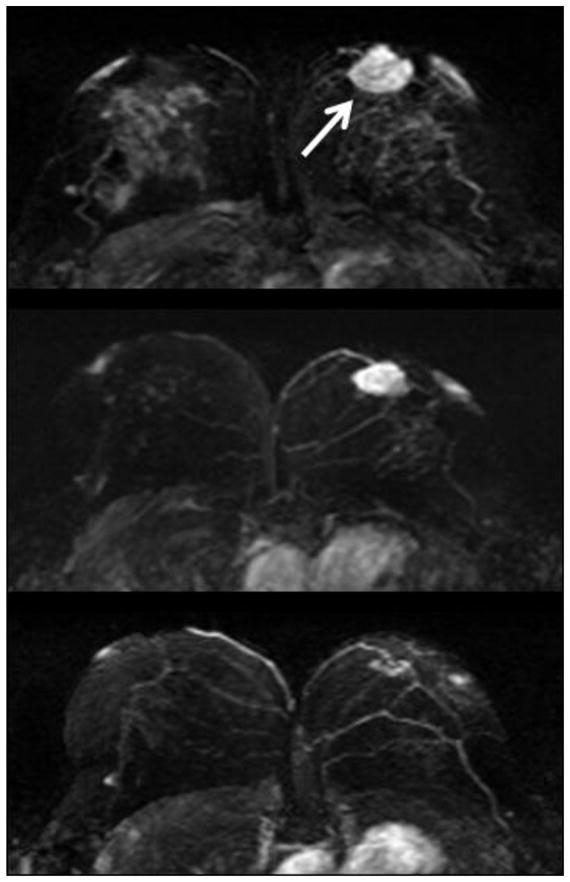
Maximal intensity projection images of a 41 y/o woman with a 3.1 cm hormonal positive and HER-2 positive invasive ductal cancer in the left breast (white arrow). Upper panel: baseline MRI; middle panel: F/U-1 MRI (after two cycles of AC); lower panel: F/U-2 MRI (after two cycles of AC+taxane). Note the strong background enhancement in the fibroglandular tissue of the right breast in the baseline MRI. The enhancement decreases remarkably in the F/U-1 and F/U-2 MRI studies.
Among the 33 pre-menopausal women, 16 had ER-positive cancer and 17 had ER-negative cancer. Both groups showed significant reduction of BPE at F/U-2 MRI, compared to B/L MRI and F/U-1 MRI (all p<0.05) (supplemental Figure 1). The BPE (%) did not show significant difference between these two groups of patients (B/L, 19.1±13.3 vs.21.0±13.7, p=0.68; F/U-1, 18.4±15.8 vs.19.2±12.9, p=0.88; F/U-2, 12.7±10.7 vs.13.8±7.3, p=0.73). Seventeen patients had Her-2 positive cancer and 16 had Her-2 negative cancer. The BPE (%) did not show significant difference between these two groups of patients (B/L, 22.1±13.7 vs.17.9±13.1, p=0.38; F/U-1, 18.5±16.6 vs.19.2±11.7, p=0.88; F/U-2, 13.2±10.6 vs.13.4±7.5, p=0.95).
Correlation of PD with BPE
The percent density (PD) was calculated by dividing the segmented fibroglandular tissue volume to the total breast volume. Only a trend of weak correlation was noted between PD and BPE (r = 0.33, p=0.03, Figure 6). The case showing a minimal enhancement on subtraction images may be due to a low contrast enhancement in a dense breast (Figure 7), or a low amount of fibroglandular tissue (Figure 8). Therefore, they may be used as separate features of the normal breast tissue. Based on the segmented fibroglandular tissue, we can separately evaluate the amount (volume) and the mean enhancement within the segmented tissue. We also correlated PD at B/L MRI with percent reduction of BPE at F/U-2 MRI and only a weak correlation (r=0.28) was noted (supplemental Figure 2).
Figure 6.
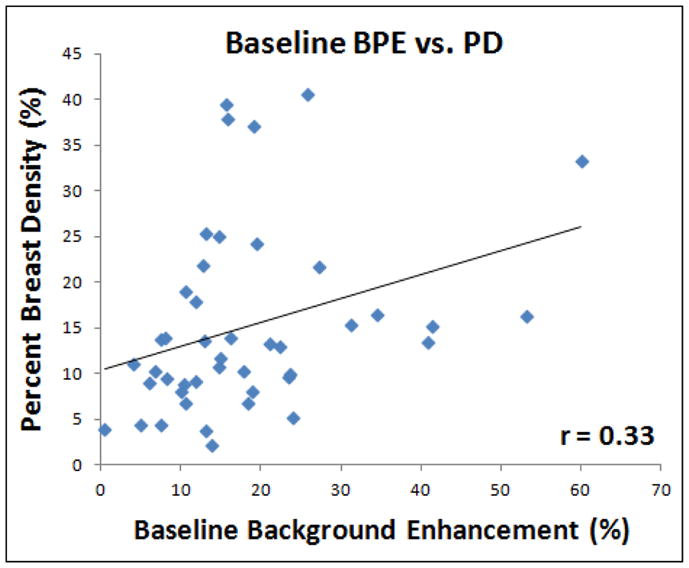
Correlation of mean BPE measured in baseline MRI with the percent density (PD, the ratio of fibroglandular tissue volume normalized to the total breast volume). A positive correlation is noted, but only weakly with r = 0.33.
Figure 7.
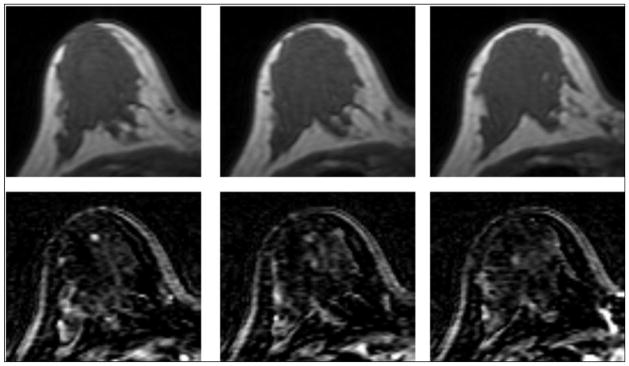
A 30 y/o patient with dense breast as shown in pre-contrast images (top row), but the tissue shows a low contrast enhancement on subtraction images (bottom row). The percent density is 25.3%, and the mean BPE is 13.2%.
Figure 8.
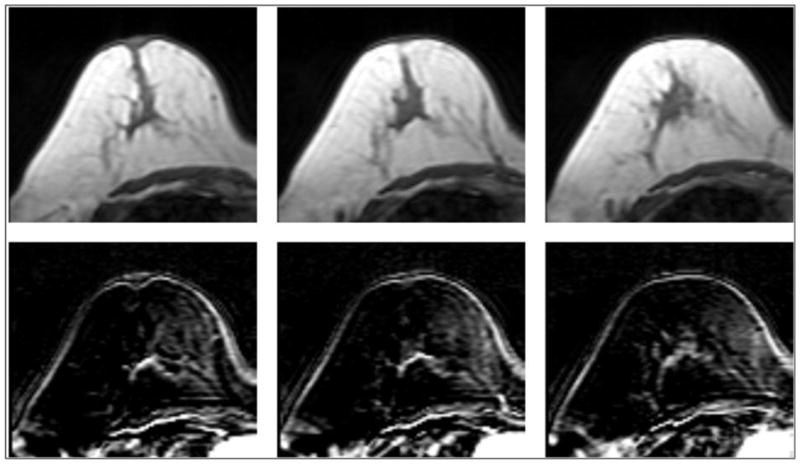
A 56-year-old patient with fatty breast. The percent density is only 2.2%, but it has a similar BPE of 13.8% comparable to Figure 7.
DISCUSSION
Studies investigating breast parenchymal enhancements have attracted more research attention recently [1–13]. Similar to breast density at mammography, the level of BPE at MR imaging after contrast medium administration is a feature of normal breast tissue [13]. Most of the previous studies evaluating BPE used a qualitative approach. In this study we used a sophisticated, comprehensive, computer-aided algorithm [18] to segment the breast and the fibroglandular tissue. This quantitative method allows for a precise measurement of the mean enhancement from the entire fibroglandular tissue. A previous study had used a similar approach to segment fibroglandular tissue on sagittal T1W images [9]; however, how the breast boundary was defined and how the fibroglandular tissue was segmented was not clearly described.
Most of the previously reported studies analyzed patients receiving diagnostic MRI. The fibroglandular enhancements could affect the evaluation of breast lesions. It is a great concern for the non-mass-like enhancement lesions, such as DCIS, since the boundary of the lesions may not be well-defined [12]. For tumor detection, the sensitivities of MRI with minimal/mild and moderate/marked BPE were 100% and 76% (p=0.001), respectively. For evaluating tumor extent, the accuracy of MRI was significantly better in cases with minimal/mild BPE (84%) than those with moderate/marked BPE (52%, p=0.002) [11]. Increased BPE on breast MRI is also associated with a higher abnormal interpretation rate [20, 21]. Women with minimal enhancement had a significantly higher rate of normal and very likely benign diagnoses (BI-RADS categories 1 and 2 examinations, 64.5%) than women with mild (38.8%), moderate (40%), or marked (25.6%) enhancements [20]. A normal and benign diagnosis can avoid the unnecessary short-term follow-up.
Different from diagnostic setting, BPE related to NAC has only rarely been studied. It was noted that higher signal enhancement ratios (SER) in the stroma of the diseased breast are significantly associated with decreased local recurrence and longer disease-free survival [14]. It was postulated that high stromal (parenchymal) signal enhancement may be due to greater microvessel density and thus better delivery of the chemo-regimens to the tumor, resulting in a better clinical response and decreased likelihood of recurrence after surgery [14]. Another study [22], however, found that a higher parenchymal SER on preoperative MRI was an independent factor associated with subsequent ipsilateral breast tumor recurrence in patients with breast cancer who had undergone breast-conserving treatment. These studies provided evidences regarding the importance of BPE in probing the stromal microenvironment, which is related to the progression of breast cancer.
In the present study we analyzed patients who had confirmed breast cancer and underwent NAC to investigate the effect of chemotherapy on BPE. In order to completely avoid the impact of enhancements associated with the cancer, only the contralateral normal breast enhancement was studied. This was different from the previous studies that analyzed the diseased breast [5, 11, 12]. The risk of contralateral second breast cancer is about 10%–15% at 15 years after treatment and is even higher for longer-term survivors [23, 24]. The factors associated with the increased risk of contralateral breast cancer are not fully understood. More frequent screening and/or prophylactic approaches to reduce risks of second breast cancer are adopted by breast cancer survivors [25]. In the continuous search of effective prophylactic preventative options, it is highly desirable to develop robust predictive tools for evaluating the risk of developing secondary breast cancer. Increased BPE was noted as a strong predictor of increased breast cancer risk [13]. A relatively large study analyzed 1,257 women who underwent breast MRI screening to examine the relationships between breast cancer risk and both amount of fibroglandular tissue and level of enhancement using a categorical scale. It was found that when breast cancer cases were compared with normal controls matched by patient ages and MR imaging dates, the background tissue enhancement level was higher in cases than controls, thus a highly significant risk predictor of breast cancer. The odds of breast cancer increased significantly with increasing background tissue enhancement level [13]. If increased BPE is proven as a risk factor, it has the potential to provide an additional risk stratification tool for choosing the optimal follow-up strategy, as well as to provide a surrogate marker for evaluating the effect of chemopreventive or other interventions.
In this study we investigated the relationship between BPE and woman’s age. The cut-off age (55 y/o) was chosen to ensure that women ≥ 55 y/o were indeed post-menopausal. It was found that younger women (< 55 y/o) had a higher normal fibroglandular tissue enhancement compared to the post-menopausal women. By using age as a continuous variable, there was a trend of negative correlation between BPE and age (r=−0.29). The results suggest that BPE was related to functional ovaries. Other studies have found a significant difference in women showing moderate and marked enhancement between the premenopausal and postmenopausal groups (p=0.001) [1, 10], and that the degree of the BPE varies with the individual as well as with the phase in the menstrual cycle at the time of imaging. In women with a strong hormonal influence, enhancement in normal fibroglandular tissue may be rapid and strong [10].
Our results further showed that in the group of women < 55 y/o, the BPE decreased with chemotherapy, but the reduction was not obvious in the group of women ≥ 55 y/o. This finding was most likely associated with ovarian ablation induced by chemotherapeutic agents (16, 17), which resulted in a significant reduction of BPE in F/U-2 MRI after 2 months of chemotherapy. A study examining the hemodynamic effects of hormonal agents has shown their impact on the significant increase of mammary blood flow [26]. Other studies have also demonstrated the effects of physiologic hormonal status [5] and hormone therapy [9, 27–29] on BPE in breast MRI.
Chemotherapy is known to cause significant atrophy of the terminal ductal lobular units in the normal breast, including reduction of the lobular acini, lobular sclerosis and the attenuation of the lobular/ductal epithelium [30]. It was shown that NAC causes significant reduction of PD in pre-menopausal women [15]. In this study we evaluated the association between the enhancement and the amount of dense tissue, and found a weak correlation between BPE and PD (r=0.33). It was found that women with dense breast might show a low BPE, while women with a low density might show a relatively high BPE within the dense tissue (as noted in Figures 6 and 7). A few studies have also investigated the correlation between BPE and breast density. Arkani et al. [31] found a significant correlation between qualitative assessment of MR density and enhancement levels in the cohort of 185 normal volunteers, but others did not find a strong correlation [8]. The different results may be attributed to different analysis methods that were used to assess density and tissue enhancement in these studies.
There were several limitations in this study. The effect of BPE on the detection of residual tumor is of great clinical interest; however, we did not include an analysis of the normal appearing parenchyma surrounding the tumors. We only investigated BPE during the NAC. It would be more helpful to know the long-term effects of NAC on BPE after the conclusion of treatment rather than during treatment. The number of subjects was small which might affect the statistical significance. The breast MRI studies were scheduled based on NAC treatments, not based on the menstrual cycle of patients, which was known to affect the BPE. However, it was impractical to schedule MRI based on the menstrual cycle for patients undergoing NAC. We have shown that the tissue enhancement increases with post-injection time, thus the level of enhancement will be dependent on the measurement time. In this study we averaged over all 12 post-contrast frames to calculate a mean BPE, also we measured BPE in three different DCE segments. The division of the three segments was arbitrary. The early segment (1–3 min. post injection) more likely reflects the imaging window used for imaging subtraction and clinical interpretation. Our study was different from other studies [14, 22] that used SER to quantify the parenchymal enhancement of the diseased breast. SER was found to be able to detect the increased endothelial permeability in the tissue microenvironment surrounding the tumor in patients with ipsilateral breast tumor recurrence [22]. It was noted that an interface zone, an alteration in the tissue microenvironment preceding tumor invasion, may exist surrounding the tumor [32]. The SER quantification based on DCE-MRI had also been proven to be a practical alternative to the measurement of kep [33], which was used to characterize the microvasculature of the breast tumor [34]. Since our study focused on the contralateral normal breast, which was supposed to have very minimal leaky vessels, if any, a method of averaging 12 post-contrast frames should suffice.
In conclusion, using a quantitative method to measure BPE based on the segmented fibroglandular tissue in the normal breast of NAC patients, it was noted that women of younger age tended to have higher BPE than older women. BPE was significantly decreased in F/U-2 MRI after NAC in women <55 y/o. The reduction of BPE after NAC correlated well with the pre-treatment BPE. A weak correlation between BPE and PD was noted, suggesting that they may serve as independent factors. The change of BPE and PD after NAC in the contralateral normal breast may be used as a biomarker for the assessment of secondary cancer risk, and that needs to be investigated in the future.
Supplementary Material
Comparison of BPE among B/L MRI, F/U-1 MRI, and F/U-2 MRI in premenopausal ER-positive (left) and ER-negative (right) patients.
Correlation of PD at B/L MRI with percent reduction of BPE at F/U-2 MRI. A positive correlation is noted, but only weakly with r = 0.28.
Acknowledgments
This work was supported in part by NIH/NCI Grant No. R01 CA127927, R21 CA170955, and R03 CA136071.
Footnotes
Publisher's Disclaimer: This is a PDF file of an unedited manuscript that has been accepted for publication. As a service to our customers we are providing this early version of the manuscript. The manuscript will undergo copyediting, typesetting, and review of the resulting proof before it is published in its final citable form. Please note that during the production process errors may be discovered which could affect the content, and all legal disclaimers that apply to the journal pertain.
References
- 1.Morris EA. Diagnosis breast MR imaging: current status and future directions. Radiol Clin North Am. 2007;45:863–80. doi: 10.1016/j.rcl.2007.07.002. [DOI] [PubMed] [Google Scholar]
- 2.Kuhl CK. The current status of breast MR imaging. Part 1. Choice of technique, image interpretation, diagnostic accuracy, and transfer to clinical practice. Radiology. 2007;244:356–78. doi: 10.1148/radiol.2442051620. [DOI] [PubMed] [Google Scholar]
- 3.Kuhl CK, Bieling HB, Gieseke J, et al. Healthy premenopausal breast parenchyma in dynamic contrast-enhanced MR imaging of the breast: normal contrast medium enhancement and cyclical-phase dependency. Radiology. 1997;203:137–44. doi: 10.1148/radiology.203.1.9122382. [DOI] [PubMed] [Google Scholar]
- 4.Muller-Schimpfle M, Ohmenhauser K, Stoll P, Dietz K, Claussen CD. Menstrual cycle and age: influence on parenchymal contrast medium enhancement in MR imaging of the breast. Radiology. 1997;203:145–9. doi: 10.1148/radiology.203.1.9122383. [DOI] [PubMed] [Google Scholar]
- 5.Baltzer PA, Dietzel M, Vag T, et al. Clinical MR mammography: impact of hormonal status on background enhancement and diagnostic accuracy. Rofo. 2011 May;183(5):441–7. doi: 10.1055/s-0029-1246072. [DOI] [PubMed] [Google Scholar]
- 6.Uematsu T, Kasami M, Watanabe J. Should breast MRI be performed with adjustment for the phase in patients’ menstrual cycle? Correlation between mammographic density, age, and background enhancement on breast MRI without adjusting for the phase in patients’ menstrual cycle. Eur J Radiol. 2012 Jul;81(7):1539–42. doi: 10.1016/j.ejrad.2011.04.059. [DOI] [PubMed] [Google Scholar]
- 7.Jansen SA, Lin VC, Giger ML, Li H, Karczmar GS, Newstead GM. Normal parenchymal enhancement patterns in women undergoing MR screening of the breast. Eur Radiol. 2011 Jul;21(7):1374–82. doi: 10.1007/s00330-011-2080-z. [DOI] [PubMed] [Google Scholar]
- 8.Cubuk R, Tasali N, Narin B, Keskiner F, Celik L, Guney S. Correlation between breast density in mammography and background enhancement in MR mammography. Radiol Med. 2010 Apr;115(3):434–41. doi: 10.1007/s11547-010-0513-4. [DOI] [PubMed] [Google Scholar]
- 9.Klifa C, Suzuki S, Aliu S, et al. Quantification of background enhancement in breast magnetic resonance imaging. J Magn Reson Imaging. 2011 May;33(5):1229–34. doi: 10.1002/jmri.22545. [DOI] [PMC free article] [PubMed] [Google Scholar]
- 10.Ko ES, Lee BH, Choi HY, Kim RB, Noh WC. Background enhancement in breast MR: correlation with breast density in mammography and background echotexture in ultrasound. Eur J Radiol. 2011 Dec;80(3):719–23. doi: 10.1016/j.ejrad.2010.07.019. [DOI] [PubMed] [Google Scholar]
- 11.Uematsu T, Kasami M, Watanabe J. Does the degree of background enhancement in breast MRI affect the detection and staging of breast cancer? Eur Radiol. 2011 Nov;21(11):2261–7. doi: 10.1007/s00330-011-2175-6. [DOI] [PubMed] [Google Scholar]
- 12.Uematsu T, Kasami M, Watanabe J. Background enhancement of mammary glandular tissue on breast dynamic MRI: imaging features and effect on assessment of breast cancer extent. Breast Cancer. 2012 Jul;19(3):259–65. doi: 10.1007/s12282-011-0279-0. [DOI] [PubMed] [Google Scholar]
- 13.King V, Brooks JD, Bernstein JL, Reiner AS, Pike MC, Morris EA. Background parenchymal enhancement at breast MR imaging and breast cancer risk. Radiology. 2011 Jul;260(1):50–60. doi: 10.1148/radiol.11102156. [DOI] [PMC free article] [PubMed] [Google Scholar]
- 14.Hattangadi J, Park C, Rembert J, Klifa C, Hwang J, Gibbs J, Hylton N. Breast stromal enhancement on MRI is associated with response to neoadjuvant chemotherapy. AJR Am J Roentgenol. 2008;190(6):1630–1636. doi: 10.2214/AJR.07.2533. [DOI] [PubMed] [Google Scholar]
- 15.BLIND FOR REVIEW
- 16.Minton SE, Munster PN. Chemotherapy-induced amenorrhea and fertility in women undergoing adjuvant treatment for breast cancer. Cancer Control. 2002;9:466–72. doi: 10.1177/107327480200900603. [DOI] [PubMed] [Google Scholar]
- 17.Tham YL, Sexton K, Weiss H, Elledge R, Friedman LC, Kramer R. The rates of chemotherapy-induced amenorrhea in patients treated with adjuvant doxorubicin and cyclophosphamide followed by a taxane. Am J Clin Oncol. 2007;30:126–32. doi: 10.1097/01.coc.0000251398.57630.4f. [DOI] [PubMed] [Google Scholar]
- 18.Nie K, Chen JH, Chan S, et al. Development of a quantitative method for analysis of breast density based on three-dimensional breast MRI. Med Phys. 2008;35 (12):5253–62. doi: 10.1118/1.3002306. [DOI] [PMC free article] [PubMed] [Google Scholar]
- 19.Chan SW, Su MY, Lei FJ, et al. Menstrual cycle related fluctuations in breast density measured by 3D MRI. Radiology. 2011;261(3):744–51. doi: 10.1148/radiol.11110506. [DOI] [PMC free article] [PubMed] [Google Scholar]
- 20.Hambly NM, Liberman L, Dershaw DD, Brennan S, Morris EA. Background parenchymal enhancement on baseline screening breast MRI: impact on biopsy rate and short-interval follow-up. AJR. 2011;196:218–24. doi: 10.2214/AJR.10.4550. [DOI] [PubMed] [Google Scholar]
- 21.DeMartini WB, Liu F, Peacock S, Eby PR, Gutierrez RL, Lehman CD. Background parenchymal enhancement on breast MRI: impact on diagnostic performance. AJR. 2012;198:W373–80. doi: 10.2214/AJR.10.6272. [DOI] [PubMed] [Google Scholar]
- 22.Kim MY, Cho N, Koo HR, et al. Predicting local recurrence following breast-conserving treatment: parenchymal signal enhancement ratio (SER) around the tumor on preoperative MRI. Acta Radiol. 2013 Apr 2; doi: 10.1177/0284185113483676. [Epub ahead of print] [DOI] [PubMed] [Google Scholar]
- 23.Freedman GM, Anderson PR, Hanlon AL, Eisenberg DF, Nicolaou N. Pattern of local recurrence after conservative surgery and whole-breast irradiation. Int J Radiat Oncol Biol Phys. 2005;61(5):1328–36. doi: 10.1016/j.ijrobp.2004.08.026. [DOI] [PubMed] [Google Scholar]
- 24.Gao X, Fisher SG, Emami B. Risk of second primary cancer in the contralateral breast in women treated for early-stage breast cancer: a population-based study. Int J Radiat Oncol Biol Phys. 2003;56(4):1038–45. doi: 10.1016/s0360-3016(03)00203-7. [DOI] [PubMed] [Google Scholar]
- 25.Brenner DJ. Contralateral second breast cancers: prediction and prevention. J Natl Cancer Inst. 2010;102:444–5. doi: 10.1093/jnci/djq058. [DOI] [PubMed] [Google Scholar]
- 26.Zoma WD, Baker S, Kopernik G, Mershon JL, Clark KE. Differential effects of selective estrogen receptor modulators and estrogens on mammary blood flow in the ovine. Am J Obstet Gynecol. 2002;187:1555–60. doi: 10.1067/mob.2002.127600. [DOI] [PubMed] [Google Scholar]
- 27.Pfleiderer SO, Sachse S, Sauner D, et al. Changes in magnetic resonance mammography due to hormone replacement therapy. Breast Cancer Res. 2004;6:R232–8. doi: 10.1186/bcr779. [DOI] [PMC free article] [PubMed] [Google Scholar]
- 28.Mousa NA, Eiada R, Crystal P, Nayot D, Casper RF. The effect of acute aromatase inhibition on breast parenchymal enhancement in magnetic resonance imaging: a prospective pilot clinical study. Menopause. 2012;19:420–5. doi: 10.1097/gme.0b013e31823772a8. [DOI] [PubMed] [Google Scholar]
- 29.King V, Kaplan J, Pike MC, et al. Impact of tamoxifen on amount of fibroglandular tissue, background parenchymal enhancement, and cysts on breast magnetic resonance imaging. Breast J. 2012 Nov-Dec;18(6):527–34. doi: 10.1111/tbj.12002. [DOI] [PubMed] [Google Scholar]
- 30.Schnitt SJ, Collins LC. Biopsy Interpretation of the Breast Treatment Effects. Philadelphia, PA: Lippincott Williams and Wilkins; 2009. pp. 435–9. [Google Scholar]
- 31.Arkani S, Newstead GM, Chen V, et al. Parenchymal enhancement on breast MRI may be a marker for cancer risk: correlation of parenchymal enhancement with breast density. San Antonio Breast Cancer Research Conference; 2006. [Google Scholar]
- 32.Kim BG, An HJ, Kang S, et al. Laminin-332-rich tumor microenvironment for tumor invasion in the interface zone of breast cancer. Am J Pathol. 2011;178:373–81. doi: 10.1016/j.ajpath.2010.11.028. [DOI] [PMC free article] [PubMed] [Google Scholar]
- 33.Li KL, Henry RG, Wilmes LJ, et al. Kinetic assessment of breast tumors using high spatial resolution signal enhancement ratio (SER) imaging. Magn Reson Med. 2007;58:572–81. doi: 10.1002/mrm.21361. [DOI] [PMC free article] [PubMed] [Google Scholar]
- 34.Li KL, Partridge SC, Joe BN, et al. Invasive breast cancer: predicting disease recurrence by using high-spatial-resolution signal enhancement ratio imaging. Radiology. 2008;248:79–87. doi: 10.1148/radiol.2481070846. [DOI] [PMC free article] [PubMed] [Google Scholar]
Associated Data
This section collects any data citations, data availability statements, or supplementary materials included in this article.
Supplementary Materials
Comparison of BPE among B/L MRI, F/U-1 MRI, and F/U-2 MRI in premenopausal ER-positive (left) and ER-negative (right) patients.
Correlation of PD at B/L MRI with percent reduction of BPE at F/U-2 MRI. A positive correlation is noted, but only weakly with r = 0.28.


