

Abstract
Animal model-based studies have shown that ethanol exposure during early gestation induces developmental stage-specific abnormalities of the face and brain. The exposure time-dependent variability in ethanol’s teratogenic outcomes is expected to contribute significantly to the wide spectrum of effects observed in humans with fetal alcohol spectrum disorder (FASD). The work presented here employs a mouse FASD model and magnetic resonance microscopy (MRM; high resolution magnetic resonance imaging) in studies designed to further our understanding of the developmental stage-specific defects of the brain that are induced by ethanol. At neurulation stages, i.e. at the beginning of gestational day (GD) 9 and again 4 hours later, time-mated C57Bl/6J dams were intraperitoneally administered 2.9 g/kg ethanol or vehicle. Ethanol-exposed fetuses were collected on GD 17, processed for MRM analysis, and results compared to comparably staged controls. Linear and volume measurements as well as shape changes for numerous individual brain regions were determined. GD 9 ethanol exposure resulted in significantly increased septal region width, reduction of cerebellar volume, and enlargement of all of the ventricles. Additionally, the results of shape analyses showed that many areas of the ethanol-exposed brains including the cerebral cortex, hippocampus and right striatum were significantly misshapen. These data demonstrate that ethanol can induce dysmorphology that may not be obvious based on volumetric analyses alone, highlight the asymmetric aspects of ethanol-induced defects, and add to our understanding of ethanol’s developmental stage-dependent neuroteratogenesis.
Keywords: Fetal Alcohol Spectrum Disorder, MRI, Mouse, Brain, Ethanol, Shape analysis
1. Introduction
The full range of abnormalities that result from prenatal ethanol exposure, termed fetal alcohol spectrum disorder (FASD), includes craniofacial defects and growth retardation as well as damage to a variety of organ systems including the central nervous system (CNS). Associated with the latter are variable patterns and degrees of structural and functional alterations including cognitive and behavioral deficits (Mattson, et al., 2013; Ware, et al., 2013). This variability of effect is a product of differing maternal ethanol dosages and timing of intake during pregnancy as well as concurrent exposure to other environmental agents, nutritional status, and genetic profiles (Jones, 2011). Of particular interest for the current report is the developmental stage-dependency of CNS insult; an issue that lends itself well to assessment in animal models. This information regarding the stage-dependent effects of ethanol is aimed at improving the postnatal and prenatal diagnosis of ethanol-exposed subjects.
Previous studies of prenatal rodents have shown that acute teratogen exposure occurring at times during embryogenesis that are separated by as little as half a day result in profoundly varying patterns of brain damage (Dunty, et al., 2001; Godin, et al., 2010; Kotch and Sulik, 1992; Parnell, et al., 2009; Shenefelt, 1972). Notable in this regard are data illustrating stage-dependent patterns of ethanol-induced cell death in tissues including the developing brain; patterns that appear to reflect subsequent malformations (Dunty, et al., 2001; Kotch and Sulik, 1992). Following up on these pathogenesis studies, the application of advanced imaging methodologies including magnetic resonance microscopy (MRM - high-resolution magnetic resonance imaging) and diffusion tensor imaging (DTI) has greatly enhanced our understanding of the gross structural brain defects that result from developmental stage-specific ethanol insult. To date, the results of imaging-based studies of the brains of mice acutely exposed to ethanol on gestational day (GD) 7, 8, and 10 have been reported (Godin, et al., 2010; O’Leary-Moore, et al., 2010; Parnell, et al., 2009). Features unique to each of these exposure times were found. GD7 (early gastrulation stage) ethanol exposure-induced defects include a wide range of median forebrain deficiencies that fall within the holoprosencephaly (HPE) spectrum and entail cerebro-cortical, striatal, septal, and pituitary abnormalities. Ethanol exposure at this time point also resulted in neuronal migration defects presenting as leptomeningeal heterotopias and cortical dysplasia. Acute maternal ethanol treatment on GD 8, a time during which neurulation is beginning does not yield holoprosencephaly, but results in olfactory bulb, hippocampal and cerebellar volume reductions along with ventricular enlargement (Parnell, et al., 2009). Similarly, acute ethanol exposure on GD 10 results in altered ventricular size and morphology. This was particularly pronounced in the third ventricle, a finding that may be indicative of alterations in the surrounding thalamus and hypothalamus (O’Leary-Moore, et al., 2010). Also notable were significant volumetric reductions in the cerebral cortex.
Filling a void in the study of brain defects resulting from acute ethanol insult occurring at developmental stages present in the human during the third through the fourth week of gestation, the current investigation is directed toward imaging-based analyses of GD9 ethanol exposure in mice. In addition to methodologically extending the previous investigations of ethanol-induced volumetric changes, this study employs advanced shape analysis algorithms to localize regional brain changes. Overall, the information acquired through this work provides a foundation for understanding the variable outcomes associated with prenatal ethanol exposure and promises to be of value in helping to recognize and treat alcohol-affected individuals by enhancing our knowledge of the full spectrum of ethanol’s teratogenesis.
2. Methods
2.1. Animal Husbandry & Maternal Ethanol Exposure
C57Bl/6J mice were obtained from The Jackson Laboratory (Bar Harbor, ME) and housed under reverse light/dark cycle conditions in a room that was held at constant temperature and humidity. Animals had water and standard laboratory chow available ad libitum. At the beginning of the dark cycle, 1–2 female mice were placed in the home cage of a singly-housed male for two hours. The female mice were examined for the presence of a copulation plug, and if present, the time of introduction of the female to the cage was designated as the beginning of gestational day (GD) 0. At the beginning of GD 9 and again four hours later, pregnant dams were administered two intraperitoneal injections (2.9 g/kg/dose) of either vehicle (Ringer’s solution) or 25% (v/v) ethanol. This ethanol exposure regimen results in peak blood ethanol concentrations (BECs) of approximately 420–440 mg/dl (Godin, et al., 2010; O’Leary-Moore, et al., 2010). There were five fetuses in each of the ethanol-exposed and control groups. Animal protocols were approved by UNC – Chapel Hill’s Institutional Animal Care and Use Committee (IACUC) in AAALAC-approved facilities and in accordance with the Guide for the Care and Use of Laboratory Animals.
2.2. Specimen Collection and Magnetic Resonance Microscopy (MRM)
On GD 17, the ethanol-exposed dams were euthanized via CO2 asphyxiation, followed by cervical dislocation. The fetuses were removed from the dam and dissected free of decidua in ice-cold phosphate-buffered saline (PBS) followed by submersion fixation in a 20:1 Bouin’s fixative (Sigma Aldrich, St. Louis, MO):Prohance (Bracco Diagnostics, Princeton, NJ) solution for 9 hours (Petiet, et al., 2007). Fixed fetuses were stored at 4° C in a 200:1 solution of PBS:Prohance until imaged (usually 48–72 hrs after collection).
MRM was performed on a 9.4T vertical bore magnet configured explicitly for magnetic resonance microscopy. The system includes Resonance Research coils capable of achieving gradients of 2000 mT/m. Scanning was controlled by a GE MR imaging console (GE Medical Systems, Waukesha, Wisc) running Epic 12.4 software. This clinical console has been adapted for high field (400 MHz) through the use of an intermediate rf up/down converter. Specimens were mounted in a specially fabricated plastic tube and surrounded by fomblin, a perfluorocarbon used to minimize magnetic susceptibility differences at the surface of the specimen. The tube was placed in a 20 mm diameter single sheet solenoid coil. Images were acquired using a conventional rf refocused spin echo sequence (TR/TE= 75/5.2 ms) with an asymmetric partial Fourier sampling strategy to reduce scan time (Johnson, et al., 2007). Data were reconstructed onto a 5122 ×1024 array with isotropic spatial resolution at 29 um. Scan time was approximately 4 hrs per specimen.
As previously reported (O’Leary-Moore, et al., 2010), the ethanol treatment protocol employed for this study results in a generalized developmental delay of approximately one half day Thus, control fetuses were collected on GD 16.5, as opposed to GD 17 for the treated specimens, allowing analysis of comparably staged specimens.
2.3. Linear Measurements
MRM images were viewed and re-aligned in the horizontal, sagittal and coronal planes using ImageJ (Version 1.45, NIH, http://rsbweb.nih.gov/ij/index.html) to ensure accurate and reproducible linear measurements. ImageJ was also used to measure crown-rump length, mid-sagittal brain length, cortical width, frontothalamic length, transverse cerebellar distance, olfactory bulb width and length, septal region width and length, widths of the pituitary gland and third ventricle, and ocular diameter as previously described in both animal models (Godin, et al., 2010; Parnell, et al., 2009) and in clinical studies designed to improve the prenatal ultrasound diagnoses of patients with developmental ethanol exposure (Kfir, et al., 2009). These linear measurements are defined as follows: mid-sagittal brain length – distance from anterior to posterior, minus the olfactory bulbs; cortical width – width of the brain from left to right; frontathalamic length – distance from the anterior aspect of the cortex to the most posterior point of the diencephalon; transverse cerebellar distance – width of the cerebellum from right to left. Measurements of the cerebellum, pituitary, optic globes and olfactory bulbs were made at their respective widest levels in the horizontal plane. All other linear measurements were taken at the level of the anterior commissure in the same plane. Anterior-posterior measurements were normalized to the midsagittal brain length, while right-left measurements were normalized to cortical width.
2.4. Volumetric Analyses
Regional brain volumes were determined following manual segmentation of each 29 μm MRM slice. ITK Snap (Yushkevich, et al., 2006) was used to display the fetal brain slice-by-slice simultaneously in three dimensions; a technique that is ideal for ensuring segmentation accuracy. On each of the ~175 2D slices, the brain was manually segmented into the following individual regions: cerebral cortex, septal region, hippocampus, striatum, diencephalon, olfactory bulbs, midbrain, pons/hindbrain, cerebellum, pituitary and lateral, third and fourth/mesencephalic ventricles (the mesencephalic ventricle is a ventricular enlargement that is the embryonic progenitor of the cerebral aqueduct). Regional boundaries were defined according to published fetal mouse atlases (Kaufman, 1992; Schambra, 2008; Schambra, et al., 1992). After segmentation, the ITK Snap program was used to assemble the individual slices into a 3D reconstruction of each region and to calculate volume (Fig. 1). The volumetric data were then analyzed by normalizing each individual brain region to overall brain size for each subject to account for individual differences in brain growth.
Figure 1.
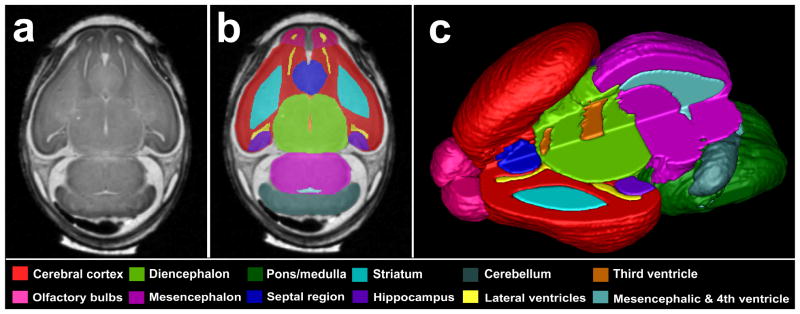
Manually segmented magnetic resonance microscopy (MRM)-derived images of the GD 17 mouse brain. A representative coronal MRM view (a) demonstrates the high resolution made possible with this imaging technology. Manually segmented MRM scans are regionally color-coded (b). 3-D reconstructions are generated (c) for use in evaluating gross morphology, calculating regional volumes and analyzing potential shape changes. Notice that the upper left quadrant of the reconstructed brain was removed to allow for visualization of the internal structures.
2.5. Shape Analyses
To identify and precisely document ethanol-induced shape changes in localized brain regions, a 3DSlicer plugin module, Spherical HARMonic representation Point Distributed Models (SPHARM-PDM), developed by the UNC Neuro Image Research and Analysis Laboratories (NIRAL) (Styner, et al., 2006) was utilized. Initially, binary label maps generated in ITK-SNAP (see section 2.4) were used to generate a spherical harmonic representation of 3D shape. Using this representation, it was possible to generate correspondent triangulated surface descriptions of shape for each brain region. After a quality check to ensure data integrity and correspondence establishment, individual PDMs of regions were grouped by treatment condition. 3D models separated in different treatment groups were compared using a permutation testing based multivariate analysis of covariance (Paniagua, 2009). The outputs of these analyses include heat maps indicating areas of statistically significant shape differences and directional projections of those differences between the mean 3D shape of control and ethanol-exposed subjects groups. P-value maps were corrected for false positives using a false-discovery rate (FDR). The magnitude and direction of these shape changes were visualized in KWMeshVisu (Oguz et al, 2006). In these analyses, a false-discovery rate (FDR) correction (α = 0.05) was applied for multiple comparison correction of the raw p-values (only FDR corrected significant maps are shown).
2.6. Statistical Analyses
Normalized linear and volumetric data from the ethanol-treated and control groups were analyzed using a repeated measures ANOVA with each brain region as the repeated measure, as described previously (Parnell, et al., 2009; Piven, et al., 1996; Yasuno, et al., 2002). Post-hoc analyses were performed using Fisher’s protected least significant difference (PLSD) when appropriate. Individual T-tests were used to analyze overall body and brain growth. In order to ensure accurate and repeatable manual segmentations of each brain region, two fetal brains were completely resegmented and intra-rater reliability was assessed using intraclass correlation coefficients (ICC). The ICC demonstrated consistent regional segmentation with all regions above 0.990 and most regions above 0.995. All α levels were set at 0.05.
3. Results
3.1. Growth Retardation
When comparing GD 17 ethanol-exposed fetuses to GD 16.5 controls, no statistically significant differences in either whole body volume (Control = 478.6 ± 21.4 mm3, Ethanol = 420.3 ± 36.9 mm3 [mean ± standard error]) or crown-rump length (Control = 16.16 ± 0.26 mm, Ethanol = 15.42 ± 0.44 mm) were found, confirming previous findings of approximately a half day ethanol-induced developmental delay. In comparison to the stage-matched controls, the brains of the ethanol-exposed animals were reduced in size. More specifically, the total brain volume of the stage-matched control fetuses averaged 44.7 ± 1.3 mm3, while that of the ethanol-exposed specimens averaged 39.1 ± 1.0 mm3 (T-test, p < 0.05). These data indicate that GD 9 ethanol exposure disproportionately impacts the brain relative to the body.
3.2. Linear Measurements
After normalization to either brain width or length (depending on the direction of the individual regional measurement), there were no significant differences found in any linear measurement with the exception of the width of the septal region (Table 1). The fetuses in the ethanol-exposed group had septal regions that were approximately 9% wider as compared to the control group (p < 0.005). Additionally, while not significantly different, the third ventricle was, on average, 11% wider in the ethanol-exposed group as compared to the controls. That an 11% difference lacked statistical significance was largely due to the increased variability in the width of the third ventricles in individual ethanol-exposed subjects.
Table 1.
Linear Measurements
| Measurement (mean ± sem) | Control | Ethanol |
|---|---|---|
| Crown-rump length (mm) | 16.16 ± 0.26 | 15.42 ± 0.44 |
| Mid-sagittal brain length (mm) | 5.19 ± 0.24 | 5.79 ± 0.27 |
| Cortical width (mm) | 4.44 ± 0.04 | 4.44 ± 0.05 |
| Frontothalamic length | 59.56 ± 2.34 | 54.57 ± 2.04 |
| Olfactory bulb length | ||
| Right | 14.81 ± 0.94 | 13.40 ± 0.93 |
| Left | 14.54 ± 0.73 | 13.18 ± 0.87 |
| Olfactory bulb width | ||
| Right | 18.16 ± 0.57 | 17.48 ± 0.64 |
| Left | 18.14 ± 0.40 | 17.58 ± 0.29 |
| Septal region length | 21.58 ± 0.82 | 20.21 ± 1.56 |
| Septal region width | 23.34 ± 0.22 | 25.51 ± 0.30* |
| Pituitary width | 24.02 ± 0.71 | 25.01 ± 0.86 |
| Third ventricle width | 6.31 ± 0.41 | 7.03 ± 0.36 |
| Cerebellar width | 73.02 ± 0.77 | 71.78 ± 0.51 |
| Ocular width | ||
| Right | 27.52 ± 0.51 | 27.84 ± 0.77 |
| Left | 27.41 ± 0.46 | 26.92 ± 0.96 |
Linear measurements in control and ethanol-exposed fetal mice. Crown-rump length, mid-sagittal brain length and cortical width data are presented in real mm measurements. All other data is expressed as a percentage of either mid-sagittal brain length (for anterior/posterior measurements) or cortical width (for left-right measurements). Only the width of the septal region was significantly different between ethanol-exposed subjects and controls.
Indicates p < 0.05
3.3. Volumetric Analyses
In order to identify disproportionately affected brain areas, in each subject the regional volumes were normalized to the overall brain volume. After normalization, statistical comparisons of the ethanol-exposed group to the control group revealed that the GD 9 ethanol exposure significantly reduced the cerebellar volume (~14%) compared to the controls (p < 0.05; Fig. 2a). In contrast, the lateral, third and mesencephalic/fourth ventricles were significantly enlarged in the ethanol-exposed specimens (p < 0.005, 0.05 and 0.01, respectively; Fig. 2b).
Figure 2.

Ethanol-induced regional volumetric changes as a percentage of total brain size. The GD 9 ethanol exposure reduced the volume of the cerebellum (a), while at the same time increasing the volume of the lateral, 3rd, and mesencephalic and 4th ventricles (b). There were no significant volumetric differences between the ethanol and control groups in the cerebral cortex, diencephalon, mesencephalon, pons/medulla (c), hippocampus, septal region or striatum (d). * = p < 0.05.
Analysis of other brain regions demonstrated that the right and left cerebral cortices were slightly smaller (~5%) in the ethanol-exposed subjects, although this difference did not quite reach statistical significance (Fig. 2c). However, these cortical reductions, combined with the other small, but non-significant decreases in the diencephalon and pons/medulla, are the primary drivers of the overall brain growth retardation observed in the ethanol-exposed fetuses. No other brain regions examined were significantly different between the ethanol-exposed and control groups (Fig. 2d).
3.4. Shape Analyses
Using the SPHARM-PDM software, each individual brain region was analyzed for group shape differences. Not surprisingly, the cerebellum, which was significantly smaller in the ethanol-treated animals compared to controls, had significant shape changes, particularly on the inferior aspects. In addition it was bilaterally asymmetric, with the right half being slightly more dysmorphic than the left. This is illustrated in Figure 3a–b, where statistical differences in shape between the ethanol-exposed and control groups are indicated by color; blue represents areas with similar shapes between the two groups, yellow indicates areas that are significantly different at a value of less than 0.05, and red indicates areas that are significantly different at a p value of less than 0.01. The arrows on each region in Figure 3 illustrate the direction and magnitude of change in the ethanol-exposed group relative to the controls; i.e. the arrows point in the direction that the ethanol-exposed subjects would need to adjust in order to be similar to control specimens.
Figure 3.
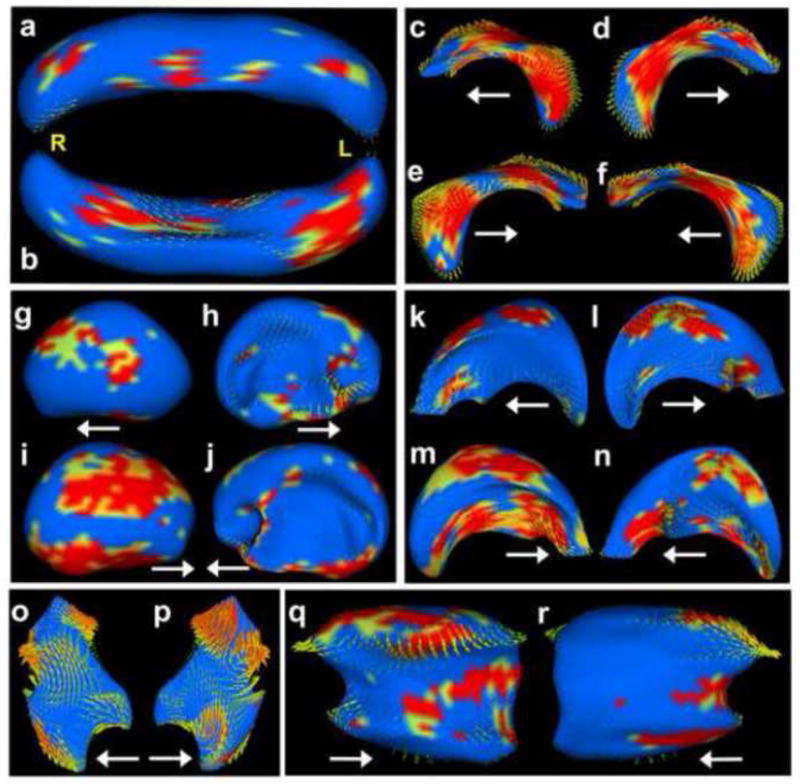
Ethanol-induced shape changes in the fetal mouse brain. In this figure, areas color-coded as blue are statistically unchanged between control mice and those exposed to ethanol; areas color-coded yellow are slightly significantly different between the two groups (p < 0.05); areas color-coded orange have more significant shape changes (p < 0.01); and areas color-coded red have changes that are highly significant (p < 0.005). The yellow letters indicate right (R), left (L), and the arrows point anteriorly. Ethanol exposure during neurulation significantly altered the shape of the cerebellum (a–b, superior and inferior views, respectively). While ethanol did not induce hypoplasia of the hippocampus, it did significantly affect its shape (c, left-lateral; d, left-medial; e, right-lateral; f, right-medial). Other affected regions include the cortex (g, left-lateral; h, left-medial; i, right-lateral; j, right-medial), lateral ventricles (k, left-lateral; l, left-medial; m, right-lateral; n, right-medial), third ventricle (o, left; p, right) and the right striatum (q, lateral; r, medial).
Examinations of other brain regions demonstrated the increased utility of this shape analyses approach over volumetric comparisons alone by demonstrating that many brain regions that did not exhibit any significant volumetric changes between the ethanol-exposed and control groups show obvious shape alterations. For example, neither the right nor left hippocampi exhibit any observable size alterations resulting from GD 9 ethanol exposure. However, the shape of this region was different in the ethanol-exposed and control brains (Fig. 3a–d and Supplemental Videos 1–2). Similarly, the shape of some areas of the cerebral cortex were significantly altered by ethanol exposure, particularly on the lateral and inferior aspects and in the areas adjacent to the septal region; tissues that give rise to the nucleus accumbens, anterior olfactory nuclei and bed nucleus of the stria terminalis (Fig. 3g–j). As for the hippocampus, the right cerebrocortical hemisphere displayed a greater amount of dysmorphology as compared to the left. As would be expected, the lateral ventricles, which are situated completely within the overlying cortices, were affected similarly to the cortex (Fig. 3k–n). The shape of the third ventricle was also significantly changed. Although the current analyses did not include examinations of shape changes involving the medial aspects of the thalamus, based on the level of third ventricular shape alterations, it would be expected that this area would be significantly dysmorphic and deserves further study. Interestingly, the striatum also displayed rather significant asymmetry, with the right half being affected while the left was not (Fig. 3k–n; Supplemental Fig. 1). Additionally found were uniform, yet only moderate changes throughout the diencephalon (Suppl. Fig. 2) and slight changes in the olfactory bulbs and inferior aspect of the septal area, with the right olfactory bulb being more affected than the left (Suppl. Fig. 3). There were no significant changes found in the shape of the midbrain, pons/medulla, fourth/mesencephalic ventricle and pituitary (Suppl. Fig. 4).
4. Discussion
The results of this study are in keeping with former pathogenesis studies illustrating that acute GD 9 ethanol insult in mice selectively impacts the progenitors of the cerebral cortex, hippocampus, and cerebellum (Dunty, et al., 2001). Regarding the latter, as assessed from 3-D reconstructions of MRM scans, a major finding from the acute GD 9 exposure employed for the current study is significant reduction in cerebellar volume. Using similar methodology, this end point had also been observed following GD 8 ethanol insult, but was not found following GD 7 or 10 treatment (Godin, et al., 2010; O’Leary-Moore, et al., 2010). In addition to cerebellar deficiency, enlargement of all of the ventricles was documented. Ventricular enlargement is common to ethanol-induced insult occurring throughout the vulnerable early stages of embryogenesis (Godin, et al., 2010; O’Leary-Moore, et al., 2010; Parnell, et al., 2009). It is possible that at least some of the ventricular enlargement may be a result of a generalized developmental delay, suggesting that with continued growth it may resolve. However, based on the shape changes observed in the ethanol-exposed subjects, it is clear that some areas of the ventricles are affected far more than others. These shape changes, particularly in the third ventricle, are expected to be indicative of abnormalities in the surrounding tissue, such as the thalamus and hypothalamus; areas that warrant further detailed examination.
Ethanol-induced shape changes were also documented in brain regions that had no observable changes in volume. The hippocampus and cerebral cortex appeared the most significantly affected, indicating that changes in behavior, learning and cognition might be expected. In contrast to the primarily lateral shape changes in the cerebral cortex, nearly every aspect of the hippocampus was affected. It is notable that the previously described GD 8 ethanol exposure resulted in significant hippocampal hypoplasia, while the GD 9 exposure altered the hippocampal shape in the absence of volumetric change. Importantly, human FASD imaging studies indicate that analyses of volume alone are inadequate to account for the neurobehavioral effects of ethanol and that significant ethanol-induced changes in regional brain shapes can occur in the absence of volumetric changes (Archibald, et al., 2001; Astley, et al., 2009; Joseph, et al., 2012).
Both the volumetric and shape analyses conducted in this study have highlighted ethanol-induced changes in symmetry, with the right side being more severely affected than the left. This is true for the hippocampus, cerebral cortex, olfactory bulb, lateral ventricle, and striatum, the latter of which consistently demonstrated severe right-sided dysmorphology in the absence of a left-sided affect in the ethanol-exposed animals. This right-sided predisposition involving the hippocampus and olfactory bulbs has previously been documented following acute GD 8 ethanol exposure in mice (Parnell, et al., 2009). Other studies in this mouse model have demonstrated that right eyes and limbs are affected by early gestational ethanol exposure nearly twice as often as the left (Chen, et al., 2004; Cook, et al., 1987; Parnell, et al., 2006). Asymmetries have also been observed in many patients with FAS, as documented in reports of disproportionate reductions in the size of the left hippocampus and frontal lobes, along with alterations in the normal cortical gray matter patterns (Reinhardt, et al., 2010; Riikonen, et al., 1999; Sowell, et al., 2001; Sowell, et al., 2002). In addition to the brain, the craniofacies of individuals with FAS may be asymmetric. In this regard, a recent human study based on high-resolution laser facial scanning and morphometric analysis software has shown a shift of some midline facial features to the right while landmarks around the eye are shifted to the left with overall facial asymmetry (Jackson and Hussain, 1990; Klingenberg, et al., 2010). Interestingly, asymmetric dysmorphology is common in other developmental disorders such as autism spectrum disorders (ASD), schizophrenia, attention-deficit/hyperactivity disorder (ADHD) and CHARGE syndrome (Davenport, et al., 1986; Gourion, et al., 2004; Hammond, et al., 2008; Herbert, et al., 2005; Riva, et al., 2011; Shashi, et al., 2004; Shaw, et al., 2009; Stevenson, et al., 2006). Exploration of the cellular and molecular basis for these asymmetries is expected to lead to a better understanding of ethanol’s teratogenic mechanisms and of the myriad gene/environment interactions that contribute to FASD.
In conclusion, the results of this study add to the increasing body of evidence demonstrating that even small changes in the timing of prenatal ethanol exposure can result in differing patterns of CNS dysmorphology in mice. Regional brain volumetric and shape alterations resulting from acute ethanol insult at a time corresponding to the mid to late fourth week of human gestation are documented. Overall, these results are important for prevention efforts, emphasizing the need for pregnancy planning. They also provide a foundation for future functional/behavioral analyses focusing on this ethanol exposure period.
Supplementary Material
Highlights.
Early gestational ethanol exposure induces stage-dependent brain abnormalities
An acute GD 9 ethanol exposure reduces the volume of the cerebellum
Ethanol exposure can result in shape abnormalities in the absense of volume changes
The right side of the mouse brain is more severely affected by ethanol than the left
Acknowledgments
This study was conducted at the UNC Bowles Center for Alcohol Studies as part of the Collaborative Initiative on Fetal Alcohol Spectrum Disorders and as part of the Carolina Institute for Developmental Disabilities. It was funded by Grant Nos. U01-AA017124, U01-AA0216521 and P60-AA011605 to KKS and grant K99/R00-AA018697 to SEP from the National Institute on Alcohol Abuse and Alcoholism/NIH; and by NIBIB grant U54-EB005149-01 and NICHD grant P30-HD03110 to MAS. MRM scanning was performed at the Duke Center for In Vivo Microscopy, an NIH/NIBIB National Biomedical Technology Resource Center (P41-EB015897). The content of this publication is solely the responsibility of the authors and does not necessarily represent the official views of the National Institutes of Health.
Footnotes
Conflict of Interest Statement
No conflicts to disclose.
Publisher's Disclaimer: This is a PDF file of an unedited manuscript that has been accepted for publication. As a service to our customers we are providing this early version of the manuscript. The manuscript will undergo copyediting, typesetting, and review of the resulting proof before it is published in its final citable form. Please note that during the production process errors may be discovered which could affect the content, and all legal disclaimers that apply to the journal pertain.
References
- Archibald SL, Fennema-Notestine C, Gamst A, Riley EP, Mattson SN, Jernigan TL. Brain dysmorphology in individuals with severe prenatal alcohol exposure. Dev Med Child Neurol. 2001;43:148–54. [PubMed] [Google Scholar]
- Astley SJ, Aylward EH, Olson HC, Kerns K, Brooks A, Coggins TE, Davies J, Dorn S, Gendler B, Jirikowic T, Kraegel P, Maravilla K, Richards T. Magnetic resonance imaging outcomes from a comprehensive magnetic resonance study of children with fetal alcohol spectrum disorders. Alcoholism, clinical and experimental research. 2009;33:1671–89. doi: 10.1111/j.1530-0277.2009.01004.x. [DOI] [PMC free article] [PubMed] [Google Scholar]
- Chen SY, Dehart DB, Sulik KK. Protection from ethanol-induced limb malformations by the superoxide dismutase/catalase mimetic, EUK-134. FASEB J. 2004;18:1234–6. doi: 10.1096/fj.03-0850fje. [DOI] [PubMed] [Google Scholar]
- Cook CS, Nowotny AZ, Sulik KK. Fetal alcohol syndrome. Eye malformations in a mouse model. Arch Ophthalmol. 1987;105:1576–81. doi: 10.1001/archopht.1987.01060110122045. [DOI] [PubMed] [Google Scholar]
- Davenport SL, Hefner MA, Mitchell JA. The spectrum of clinical features in CHARGE syndrome. Clin Genet. 1986;29:298–310. doi: 10.1111/j.1399-0004.1986.tb01258.x. [DOI] [PubMed] [Google Scholar]
- Dunty WC, Jr, Chen SY, Zucker RM, Dehart DB, Sulik KK. Selective vulnerability of embryonic cell populations to ethanol-induced apoptosis: implications for alcohol-related birth defects and neurodevelopmental disorder. Alcohol Clin Exp Res. 2001;25:1523–35. [PubMed] [Google Scholar]
- Godin EA, O’Leary-Moore SK, Khan AA, Parnell SE, Ament JJ, Dehart DB, Johnson BW, Allan Johnson G, Styner MA, Sulik KK. Magnetic resonance microscopy defines ethanol-induced brain abnormalities in prenatal mice: effects of acute insult on gestational day 7. Alcohol Clin Exp Res. 2010;34:98–111. doi: 10.1111/j.1530-0277.2009.01071.x. [DOI] [PMC free article] [PubMed] [Google Scholar]
- Gourion D, Goldberger C, Bourdel MC, Jean Bayle F, Loo H, Krebs MO. Minor physical anomalies in patients with schizophrenia and their parents: prevalence and pattern of craniofacial abnormalities. Psychiatry Res. 2004;125:21–8. doi: 10.1016/j.psychres.2003.06.001. [DOI] [PubMed] [Google Scholar]
- Hammond P, Forster-Gibson C, Chudley AE, Allanson JE, Hutton TJ, Farrell SA, McKenzie J, Holden JJ, Lewis ME. Face-brain asymmetry in autism spectrum disorders. Molecular psychiatry. 2008;13:614–23. doi: 10.1038/mp.2008.18. [DOI] [PubMed] [Google Scholar]
- Herbert MR, Ziegler DA, Deutsch CK, O’Brien LM, Kennedy DN, Filipek PA, Bakardjiev AI, Hodgson J, Takeoka M, Makris N, Caviness VS., Jr Brain asymmetries in autism and developmental language disorder: a nested whole-brain analysis. Brain. 2005;128:213–26. doi: 10.1093/brain/awh330. [DOI] [PubMed] [Google Scholar]
- Jackson IT, Hussain K. Craniofacial and oral manifestations of fetal alcohol syndrome. Plast Reconstr Surg. 1990;85:505–12. doi: 10.1097/00006534-199004000-00003. [DOI] [PubMed] [Google Scholar]
- Johnson GA, Ali-Sharief A, Badea A, Brandenburg J, Cofer G, Fubara B, Gewalt S, Hedlund LW, Upchurch L. High-throughput morphologic phenotyping of the mouse brain with magnetic resonance histology. Neuroimage. 2007;37:82–9. doi: 10.1016/j.neuroimage.2007.05.013. [DOI] [PMC free article] [PubMed] [Google Scholar]
- Jones KL. The effects of alcohol on fetal development. Birth Defects Res C Embryo Today. 2011;93:3–11. doi: 10.1002/bdrc.20200. [DOI] [PubMed] [Google Scholar]
- Joseph J, Warton C, Jacobson SW, Jacobson JL, Molteno CD, Eicher A, Marais P, Phillips OR, Narr KL, Meintjes EM. Three-dimensional surface deformation-based shape analysis of hippocampus and caudate nucleus in children with fetal alcohol spectrum disorders. Hum Brain Mapp. 2012 doi: 10.1002/hbm.22209. [DOI] [PMC free article] [PubMed] [Google Scholar]
- Kaufman MH. The atlas of mouse development. Academic; 1992. [Google Scholar]
- Kfir M, Yevtushok L, Onishchenko S, Wertelecki W, Bakhireva L, Chambers CD, Jones KL, Hull AD. Can prenatal ultrasound detect the effects of in-utero alcohol exposure? A pilot study. Ultrasound Obstet Gynecol. 2009;33:683–9. doi: 10.1002/uog.6379. [DOI] [PMC free article] [PubMed] [Google Scholar]
- Klingenberg CP, Wetherill L, Rogers J, Moore E, Ward R, Autti-Ramo I, Fagerlund A, Jacobson SW, Robinson LK, Hoyme HE, Mattson SN, Li TK, Riley EP, Foroud T. Prenatal alcohol exposure alters the patterns of facial asymmetry. Alcohol. 2010;44:649–57. doi: 10.1016/j.alcohol.2009.10.016. [DOI] [PMC free article] [PubMed] [Google Scholar]
- Kotch LE, Sulik KK. Patterns of ethanol-induced cell death in the developing nervous system of mice; neural fold states through the time of anterior neural tube closure. Int J Dev Neurosci. 1992;10:273–9. doi: 10.1016/0736-5748(92)90016-s. [DOI] [PubMed] [Google Scholar]
- Mattson SN, Roesch SC, Glass L, Deweese BN, Coles CD, Kable JA, May PA, Kalberg WO, Sowell ER, Adnams CM, Jones KL, Riley EP. Further Development of a Neurobehavioral Profile of Fetal Alcohol Spectrum Disorders. Alcohol Clin Exp Res. 2013;37:517–528. doi: 10.1111/j.1530-0277.2012.01952.x. [DOI] [PMC free article] [PubMed] [Google Scholar]
- O’Leary-Moore SK, Parnell SE, Godin EA, Dehart DB, Ament JJ, Khan AA, Johnson GA, Styner MA, Sulik KK. Magnetic resonance microscopy-based analyses of the brains of normal and ethanol-exposed fetal mice. Birth defects research Part A. Clinical and molecular teratology. 2010;88:953–64. doi: 10.1002/bdra.20719. [DOI] [PMC free article] [PubMed] [Google Scholar]
- Parnell SE, Dehart DB, Wills TA, Chen SY, Hodge CW, Besheer J, Waage-Baudet HG, Charness ME, Sulik KK. Maternal oral intake mouse model for fetal alcohol spectrum disorders: ocular defects as a measure of effect. Alcohol Clin Exp Res. 2006;30:1791–8. doi: 10.1111/j.1530-0277.2006.00212.x. [DOI] [PubMed] [Google Scholar]
- Parnell SE, O’Leary-Moore SK, Godin EA, Dehart DB, Johnson BW, Allan Johnson G, Styner MA, Sulik KK. Magnetic resonance microscopy defines ethanol-induced brain abnormalities in prenatal mice: effects of acute insult on gestational day 8. Alcohol Clin Exp Res. 2009;33:1001–11. doi: 10.1111/j.1530-0277.2009.00921.x. [DOI] [PMC free article] [PubMed] [Google Scholar]
- Petiet A, Hedlund L, Johnson GA. Staining methods for magnetic resonance microscopy of the rat fetus. J Magn Reson Imaging. 2007;25:1192–8. doi: 10.1002/jmri.20932. [DOI] [PMC free article] [PubMed] [Google Scholar]
- Piven J, Arndt S, Bailey J, Andreasen N. Regional brain enlargement in autism: a magnetic resonance imaging study. Journal of the American Academy of Child and Adolescent Psychiatry. 1996;35:530–6. doi: 10.1097/00004583-199604000-00020. [DOI] [PubMed] [Google Scholar]
- Reinhardt K, Mohr A, Gartner J, Spohr HL, Brockmann K. Polymicrogyria in fetal alcohol syndrome. Birth defects research Part A. Clinical and molecular teratology. 2010;88:128–31. doi: 10.1002/bdra.20629. [DOI] [PubMed] [Google Scholar]
- Riikonen R, Salonen I, Partanen K, Verho S. Brain perfusion SPECT and MRI in foetal alcohol syndrome. Dev Med Child Neurol. 1999;41:652–9. doi: 10.1017/s0012162299001358. [DOI] [PubMed] [Google Scholar]
- Riva D, Bulgheroni S, Aquino D, Di Salle F, Savoiardo M, Erbetta A. Basal forebrain involvement in low-functioning autistic children: a voxel-based morphometry study. AJNR American journal of neuroradiology. 2011;32:1430–5. doi: 10.3174/ajnr.A2527. [DOI] [PMC free article] [PubMed] [Google Scholar]
- Schambra UB. Prenatal mouse brain atlas. Springer; New York: 2008. [Google Scholar]
- Schambra UB, Lauder JM, Silver J. Atlas of the prenatal mouse brain. Academic Press; San Diego: 1992. [DOI] [PubMed] [Google Scholar]
- Shashi V, Muddasani S, Santos CC, Berry MN, Kwapil TR, Lewandowski E, Keshavan MS. Abnormalities of the corpus callosum in nonpsychotic children with chromosome 22q11 deletion syndrome. Neuroimage. 2004;21:1399–406. doi: 10.1016/j.neuroimage.2003.12.004. [DOI] [PubMed] [Google Scholar]
- Shaw P, Lalonde F, Lepage C, Rabin C, Eckstrand K, Sharp W, Greenstein D, Evans A, Giedd JN, Rapoport J. Development of cortical asymmetry in typically developing children and its disruption in attention-deficit/hyperactivity disorder. Archives of general psychiatry. 2009;66:888–96. doi: 10.1001/archgenpsychiatry.2009.103. [DOI] [PMC free article] [PubMed] [Google Scholar]
- Shenefelt RE. Morphogenesis of malformations in hamsters caused by retinoic acid: relation to dose and stage at treatment. Teratology. 1972;5:103–18. doi: 10.1002/tera.1420050115. [DOI] [PubMed] [Google Scholar]
- Sowell ER, Thompson PM, Mattson SN, Tessner KD, Jernigan TL, Riley EP, Toga AW. Voxel-based morphometric analyses of the brain in children and adolescents prenatally exposed to alcohol. Neuroreport. 2001;12:515–23. doi: 10.1097/00001756-200103050-00018. [DOI] [PubMed] [Google Scholar]
- Sowell ER, Thompson PM, Peterson BS, Mattson SN, Welcome SE, Henkenius AL, Riley EP, Jernigan TL, Toga AW. Mapping cortical gray matter asymmetry patterns in adolescents with heavy prenatal alcohol exposure. Neuroimage. 2002;17:1807–19. doi: 10.1006/nimg.2002.1328. [DOI] [PubMed] [Google Scholar]
- Stevenson JC, Everson PM, Williams DC, Hipskind G, Mahoney ER, Mehler M, Cawley M, Chamberlin W, Watts L. Attention-deficit hyperactivity disorder and fluctuating asymmetry in another college sample. Am J Hum Biol. 2006;18:402–14. doi: 10.1002/ajhb.20507. [DOI] [PubMed] [Google Scholar]
- Styner M, Oguz I, Xu S, Brechbuhler C, Pantazis D, Levitt JJ, Shenton ME, Gerig G. Framework for the Statistical Shape Analysis of Brain Structures using SPHARM-PDM. Insight J. 2006:242–250. [PMC free article] [PubMed] [Google Scholar]
- Ware AL, O’Brien JW, Crocker N, Deweese BN, Roesch SC, Coles CD, Kable JA, May PA, Kalberg WO, Sowell ER, Jones KL, Riley EP, Mattson SN. The effects of prenatal alcohol exposure and attention-deficit/hyperactivity disorder on psychopathology and behavior. Alcohol Clin Exp Res. 2013;37:507–16. doi: 10.1111/j.1530-0277.2012.01953.x. [DOI] [PMC free article] [PubMed] [Google Scholar]
- Yasuno F, Hasnine AH, Suhara T, Ichimiya T, Sudo Y, Inoue M, Takano A, Ou T, Ando T, Toyama H. Template-Based Method for Multiple Volumes of Interest of Human Brain PET Images. Neuroimage. 2002;16:577–586. doi: 10.1006/nimg.2002.1120. [DOI] [PubMed] [Google Scholar]
- Yushkevich PA, Piven J, Hazlett HC, Smith RG, Ho S, Gee JC, Gerig G. User-guided 3D active contour segmentation of anatomical structures: significantly improved efficiency and reliability. Neuroimage. 2006;31:1116–28. doi: 10.1016/j.neuroimage.2006.01.015. [DOI] [PubMed] [Google Scholar]
Associated Data
This section collects any data citations, data availability statements, or supplementary materials included in this article.