

Abstract
A clear link exists between iron deficiency (ID) and nigrostriatal dopamine malfunction. This link appears to play an important role in at least restless legs syndrome (RLS) if not several other neurological diseases. Yet, the underlying mechanisms remain unclear. The effects of ID on gene expression in the brain have not been studied extensively. Here, to better understand how exactly ID alters dopamine functioning, we investigated the effects of ID on gene expression in the brain, seeking to identify any potential transcription-based mechanisms. We used six strains of recombinant inbred mice (BXD type) known to differ in susceptibility to ID in the brain. Upon weaning, we subjected mice from each strain to either an iron-deficient or iron-adequate diet. After 100 days of dietary treatment, we measured the effects of ID on gene expression in the ventral midbrain (VMB), a region containing the substantia nigra. The substantia nigra is the base of the nigrostriatal dopamine pathway and a region particularly affected by iron loss in RLS. We screened for ID-induced changes in expression, including changes in that of both iron-regulating and dopamine-related genes. Results revealed a number of expression changes occurring in ID, with large strain-based differences in the genes involved and number of expression changes occurring. In terms of dopamine-related genes, results revealed ID-induced expression changes in three genes with direct ties to nigrostriatal dopamine functioning, two of which have never before been implicated in an iron-dopamine pathway. These were stromal cell-derived factor 1 (Cxcl12, or SDF-1), a ferritin regulator and potent dopamine neuromodulator, and hemoglobin, beta adult chain 1 (Hbb-b1), a gene recently shown to play a functional role in dopaminergic neurons. The extent of up-regulation of these genes varied by strain. This work not only demonstrates wide genetic variation in the transcriptional response to ID in the brain, but also reveals two novel biochemical pathways by which iron may potentially alter dopamine function.
Keywords: BXD, Recombinant inbred strains, Drd2, Cxcl12, Hbb-b1
Introduction
Iron deficiency (ID) has a number of effects in the brain, including dopamine malfunction, and is associated with restless legs syndrome (RLS; Allen et al., 2013), a neurological disorder with dopaminergic abnormalities. RLS is one of several dopamine-related neurological disorders associated with iron imbalance in the brain, particularly in the substantia nigra. Thus, iron and dopamine share an important link to neurological disease (Snyder and Connor, 2009).
Several lines of evidence implicate the iron-dopamine relationship in RLS. First, impaired iron acquisition (Connor et al., 2003) and iron deficits in RLS have been observed in the substantia nigra, a region housing dopaminergic neurons of the nigrostriatal pathway (Earley et al., 2006; Astrakas et al., 2008; Godau et al., 2008). This region is normally iron-rich. Secondly, the dopaminergic abnormalities of RLS overlap those of animal models of ID—in both RLS and ID, the nigrostriatal pathway is disrupted, with reduced striatal densities of dopamine D2 receptors and increased levels of tyrosine hydroxylase (TH) and phosphorylated TH (Connor et al., 2009). Other nigrostriatal changes in animal models of ID include reductions in striatal dopamine D1 receptors and the dopamine transporter, increases in striatal extracellular dopamine levels, and sensorimotor deficits (Beard et al., 1994, 2002; Erikson et al., 2000, 2001; Burhans, et al., 2005; Felt et al., 2006; Unger et al., 2007; Bianco et al., 2008; Georgieff, 2011; Lozoff, 2011). Finally, RLS symptoms can be reduced by intravenous iron therapy (Earley et al., 2009).
Nevertheless, many questions remain unanswered regarding the role of iron in RLS. Our research centers on two: 1) what causes ID to develop in the substantia nigra in RLS? and 2) by what mechanisms does ID alter dopamine functioning in this and neighboring regions? Here, we investigate the potential role of gene expression in either.
Several studies have demonstrated a number of expression changes in ID in early development, in both whole brain (Clardy et al., 2006) and hippocampus (Carlson et al., 2007, 2008). It is thus plausible that ID-related expression changes also occur in adulthood and may influence nigral iron levels in ID and/or mediate the effects of ID on dopamine pathways. To our knowledge, however, no studies have yet profiled expression changes in response to ID in the substantia nigra, particularly in adulthood when RLS typically develops.
In previous work, we investigated the potential role of genetics in susceptibility to brain iron deficits in RLS. We showed that recombinant inbred strains of mice (BXD type) differ widely in their response to ID in the brain, in terms of brain iron loss. In one study, we profiled 22 strains for susceptibility to iron deficiency in the ventral midbrain (VMB), which contains the substantia nigra. We found that in response to 100 days of being fed a low iron diet, VMB iron loss ranged from 0-40%, depending on strain (Jellen et al., 2012). From this work, we identified a QTL linked to VMB iron levels and used microarray analysis of a subset of six strains with high or low susceptibility to VMB iron loss to narrow down identification of a candidate gene, Glt-1, which may regulate VMB iron. In the current study, we used the same set of microarray data, but expanded our focus from the effects of ID on genes within the QTL interval (i.e. genes that regulate iron concentration) to the effects of ID on expression throughout the genome, whether related to iron regulation or other downstream effects of ID, especially dopamine function.
The purpose of this study was thus to profile the effects of ID on gene expression in a dopamine- and RLS-relevant region of the brain and identify a) genes that respond to ID that may underlie susceptibility to iron loss in this region and/or b) genes that respond to ID and may in turn regulate dopamine neurobiology.
To perform this work, we chose a subset of six of the original twenty-two strains, which exhibited relatively high- or low-susceptibility to VMB iron loss. We then fed mice from these strains a low- or adequate-iron diet for 100 days and profiled each strain’s response to ID in terms of changes in VMB gene expression.
Among our findings, we identified a large number of ID-responsive genes in the VMB, and found wide variation among the six strains in this response. We did not find evidence linking gene expression profiles to differences in susceptibility to VMB iron loss in ID among the strains. We did, however, reveal expression changes in three genes in ID that do indeed have direct ties to nigrostriatal dopamine functioning. Two of these have never before been implicated in an iron-dopamine pathway.
This study demonstrates wide genetic variation in the transcriptional response to ID in the VMB, even among strains with nearly identical VMB iron loss profiles, and reveals two genes potentially involved in novel biochemical pathways linking iron to dopamine.
METHODS
Animals
All experimental protocols were conducted in accordance with the National Institutes of Health Animal Care guidelines and were approved by the Pennsylvania State University Institutional Animal Care and Use Committee. Rearing and housing was controlled, with a constant light-dark cycle (06:00-18:00, on-off), ambient temperature (23 ± 2 °C) and relative humidity (40%). All mice were weighed weekly. Mice were from the BXD panel of recombinant inbred strains, derived from a C57BL/6J x DBA/2J pairing. The BXDs exhibit differential VMB iron regulation; varying widely in both baseline VMB iron content (Jones et al., 2003; Jones et al., 2006) and susceptibility to VMB iron loss in response to a low iron diet (Jellen et al., 2012). The BXDs also vary in systemic response to ID (Yin et al., 2012).
Strain Selection
Six strains were selected for gene expression profiling; these were a subset of twenty-two BXD strains previously profiled for VMB iron levels and susceptibility to ID in this region (Jellen et al., 2012). Inclusion in this subset was based on two criteria: first, that VMB iron loss was either very low or very high, and second, that no sex differences were apparent. While sex differences are a factor in RLS in humans (Manconi et al., 2012), with higher prevalence in females than males, the pooling of sexes in this study was necessary for statistical power, as segregating by sex would have reduced the number of mice per group by approximately half. Since pooling the sexes was required for practical reasons, we aimed to reduce the influence of sex as much as possible by choosing strains with similar VMB iron loss profiles in previous work, although similarity in the extent of VMB iron loss in ID does not necessarily translate to similarity in the underlying transcriptional response. Exclusion of strains with sex differences thus limited the number of eligible strains to six. These included two of the most susceptible strains (BXD 38 and BXD 40), which showed ∼40% reductions in VMB iron following a low iron dietary challenge, and four of the most resistant (BXD 39, 6, 19, and 31), none of which had significant reductions in VMB iron content following the same low iron diet challenge (Jellen et al., 2012). VMB Iron loss profiles in these strains are depicted in Figure 1.
Figure 1.
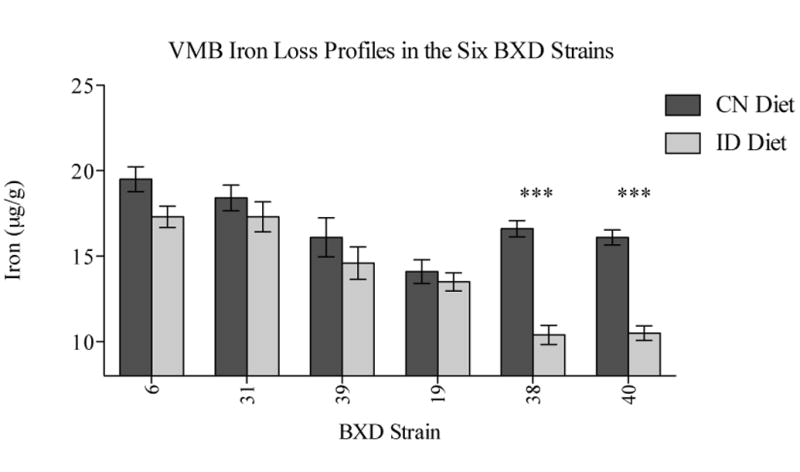
VMB iron concentration in the six BXD strains (adapted from Jellen et al., 2012). In previous work, mean (+/- SEM) iron concentration (μg/g) was measured in mice from the BXD strains used in the current analysis. While these iron values were generated from a separate cohort, mice from BXD strains are genetically identical, thus the data provide predictive iron values for mice in the current study.
Dietary Treatment
The diets, timing, and duration of treatment were identical to those used to measure the effects of iron deficiency on VMB iron levels in prior work (Jellen et al., 2012). Upon weaning at postnatal day 21, same-sex littermates were group housed (maximum 3 males or 4 females) and assigned to one of two dietary groups: an iron deficient (ID) diet or an iron-adequate, control (CN) diet. The ID diet was a pelleted, 3-5 ppm iron diet (Teklad, Inc.); the CN diet contained 240 ppm iron but was otherwise identical. Both diets were supplied ad libitum from weaning until sacrifice.
Tissue Harvest
At postnatal day 120, all mice were sacrificed via CO2 inhalation and the brain was immediately harvested for gene expression analysis. The VMB was dissected as described by Boone et al., 2007. In addition, body weight was measured and a blood sample was collected at the time of sacrifice to measure various indices of systemic iron status, including hemoglobin and hematocrit. Body weight and hematocrit are reported in Table 1.
Table 1. Within-strain body weight and hematocrit data by diet.
Summary of body weight and hematocrit data on mice within each strain, by diet. Mean, standard deviation (SD), and number of mice per strain (N) are reported. Significance of differences between ID and CN groups is indicated by asterisks following the mean ID values
| Strain | Body Weight (g)
|
Hematocrit (% packed red blood cells)
|
||||||||||
|---|---|---|---|---|---|---|---|---|---|---|---|---|
| CN
|
ID
|
CN
|
ID
|
|||||||||
| Mean | SD | N | Mean | SD | N | Mean | SD | N | Mean | SD | N | |
|
| ||||||||||||
| 6 | 21.9 | 1.66 | 11 | 23.6 | 2.22 | 12 | 43.5 | 4.78 | 11 | 37.9* | 7.06 | 12 |
| 19 | 30.4 | 7.79 | 12 | 21.7** | 4.05 | 10 | 42.2 | 8.50 | 12 | 26.1** | 12.93 | 9 |
| 31 | 27.7 | 4.73 | 9 | 27.3 | 3.01 | 9 | 40.1 | 3.14 | 9 | 32.3* | 5.35 | 6 |
| 38 | 24.7 | 2.75 | 6 | 21.4 | 2.77 | 10 | 46.0 | 1.67 | 6 | 30.9** | 9.90 | 8 |
| 39 | 37.9 | 5.66 | 17 | 28.9* | 7.83 | 7 | 47.9 | 2.41 | 16 | 30.7*** | 5.56 | 7 |
| 40 | 23.4 | 4.08 | 19 | 22.9 | 2.89 | 22 | 42.8 | 4.67 | 17 | 32.2*** | 7.96 | 20 |
p<0.05
p<0.01
p<0.001.
RNA Isolation
Tissue samples for gene expression analysis were dissected within five minutes of sacrifice and placed in RNAlater (Ambion) on ice. Samples were then refrigerated for 24 hours and stored at -20°C. Samples were randomized for RNA isolation. VMB tissue weights ranged from 20-45 mg. RNA was isolated using the RNAeasy Lipid Tissue Mini Kit (Qiagen, Germantown, MD or Hilden, Germany). Tissues were homogenized in Qiazol Lysis Reagent using a motor-driven pestle and 1.5 mL centrifuge tubes. RNA was then isolated according to manufacturer’s protocol, including an additional 15-minute DNAse treatment using the Qiagen DNAse kit. Once isolated, RNA was eluted into RNase-free H20 and stored at -80°C. RNA concentration and purity was measured using a NanoDrop 2000 spectrophotometer (Thermoscientific, Wilmington, DE, USA). RNA was then diluted to 100 ng/μL. RNA was considered acceptable if it had a 260/230 ratio of 1.8 or above and a 260/230 ratio of 1.8 or above. The integrity of the RNA was tested using the Agilent Bioanalyzer (Agilent Technologies) and the criterion for acceptance was an RNA integrity number of 8 or greater (Schroeder et al., 2006).
Microarray Analysis
Within each strain, VMB gene expression was measured across dietary conditions. Males and females were both represented in each experimental group and were balanced as much as possible. The number of mice per experimental group ranged from 3 to 8 with an average of 5 mice. Samples were not pooled. Microarray analysis was performed at the Molecular Resource Center at the University of Tennessee. Analysis was performed using the Illumina Mouse WG-6 Version 2.0 Expression Beadchip. Balanced randomization was used to position the samples on the arrays. Gene expression was assayed according to manufacturer’s instructions. The data set was normalized using the Rank invariant method (Pelz, 2008). The data were transformed to obtain the log2 of each probe set and standardized using Z scores. The Z scores were doubled and 8 was added to each to produce a set of Z scores with a mean of 8 and a standard deviation of 2. The advantage of this modified Z score is that a two-fold difference in expression level corresponds approximately to a 1-unit difference in expression. Expression levels below 7 were considered essentially to be background. Normalized data were initially filtered by omitting genes for which expression was lower than 8.0 in >70% of the samples. Data were then analyzed for gene expression differences among our experimental groups in Nexus Expression™ software (Biodiscovery, El Segundo, CA).
Data analysis
Gene expression differences among the experimental groups (ID vs. CN across the strains and within each strain) were determined using Nexus Expression™ software (Biodiscovery, El Segundo, CA). Treatment effects were reported as the log 2 ratio (LR) of ID/CN values. Differences were considered significant when the false discovery rate of the log ratio (FDR; Benjamini and Hochberg, 1995) was 5% or lower. In addition to testing for expression differences in individual genes, changes in functionally-related groups of genes were also measured using Gene Set Enrichment Analysis (GSEA; Subramanian et al., 2005) and k-Means clustering. GSEA reveals Gene Sets, or groups of functionally-related genes, that are significantly up- or down-regulated by a treatment. We performed GSEA of the comparison of ID vs. CN overall. For clustering, we included all genes differentially expressed in ID in any or all of the six strains. Clusters were then tested for enrichment, which reveals overrepresented GO Terms.
Real Time-Polymerase Chain Reaction (RT-PCR)
RT-PCR was used to validate the results of the microarray analysis for five genes. RT-PCR was performed on the samples used in the microarray analysis and additional samples from the same cohort. RT-PCR was performed using the StepOne Plus system, Gene Expression Mastermix, and Taqman Gene assays (Applied Biosystems, Foster City, CA). Cycle thresholds were set manually on a per gene basis; baseline thresholds were set automatically by the StepOne software. Experiments were designed to be analyzed by the comparative CT method, or ΔΔCT method. Two housekeeping genes were run on all samples (Gapdh and UBC) and neither showed significant expression differences between control and ID experimental groups. Gapdh showed less variability and was selected for the housekeeping gene. Two internal standards and a no template control were run on each plate. Plates were run on a per-strain basis, with iron deficient and control samples from each strain all represented on one plate. The data were analyzed as differences in expression in mice fed the ID diet relative to the CN diet; significance of differences was analyzed using unpaired t-tests with Welch correction. Alpha was set at < 0.05.
RESULTS
Low iron diet alters gene expression in the VMB
Across the strains, the ID diet led to differential expression in thirteen genes, all of which were up-regulated (Table 2). Individual strains showed many more strain-specific changes in expression; however, the changes in each of these thirteen genes did not always reach significance in all strains (data not shown). Five of the thirteen had known relevance to iron or dopamine biology and were selected for verification by RT-PCR analysis; RT-PCR confirmed increases in the expression of all five across the strains (Figure 2). Included were two dopamine-related genes: hemoglobin, beta adult chain (Hbb-b1) and chemokine (C-X-C motif) ligand 12 (Cxcl12), one iron-regulatory gene: transferrin receptor (Tfrc), one gene required for heme biosynthesis: aminolevulinic acid synthase 2 (Alas2), and one iron-sulfur cluster binding gene: radical S-adenosyl methionine domain containing 2 (Rsad2). GSEA also highlighted several gene sets that were significantly up- or down-regulated by the low iron diet across the strains. These included down-regulation of myelin-related genes and up-regulation of genes related to cell adhesion, angiogenesis, and glycolysis (Figure 3). Finally, k-means clustering resulted in four clusters among the genes differentially expressed in ID versus CN mice. Each cluster was enriched for biological process GO Terms. These were as follows: for cluster 1, hematopoiesis and oxygen transport, for cluster 2, electron transport, protein biosynthesis, metal ion homeostasis, protein folding, and mRNA metabolism, for cluster 3, electron transport, and for cluster 4, chromosome organization and biogenesis and nucleosome assembly.
Table 2.
Results from Illumina Beadchip analysis: differential expression in the VMB following 100 days on a low iron diet. These are changes that occurred across the six strains. Highlighted in gray are genes with a known role in heme biosynthesis or function. LR=Log2 ratio of ID/CN, Q=FDR.
| Gene | Probe ID | Location Chr: Mb | eQTL Chr: Mb | Log Ratio | Q-Value |
|---|---|---|---|---|---|
| Erythrocyte membrane protein band 3, Diego blood group | |||||
| Slc4a1 | ILMN_1227675 | 11: 102.2 | 14*: 46.7* | 1.27 | 0.0000 |
| Aminolevulinic acid synthase 2, erythroid | |||||
| Alas2 | ILMN_2675874 | X: 147.0 | --- | 1.04 | 0.0000 |
| Hemoglobin, beta adult chain | |||||
| Hbb-b1 | ILMN_1239117 | 7: 103.7 | 14: 67.1 | 0.81 | 0.0168 |
| Apolipoprotein L 11b | |||||
| Apol11b | ILMN_1252157 | 15: 77.5 | 13: 41.5 | 0.98 | 0.0000 |
| Chemokine (C-X-C motif) ligand 12 (stromal cell-derived factor 1) | |||||
| Cxcl12 | ILMN_2658908 | 6: 117.1 | --- | 0.75 | 0.0000 |
| Radical S-adenosyl methionine domain containing 2 | |||||
| Rsad2 | ILMN_1225204 | 12: 27.1 | 15: 21.7 | 0.66 | 0.0018 |
| Transferrin receptor | |||||
| Tfrc | ILMN_2860804 | 16: 32.6 | --- | 0.58 | 0.0001 |
| Glycophorin A | |||||
| Gypa | ILMN_2696696 | 8: 83.0 | 2: 15.3 | 0.59 | 0.0001 |
| Alkaline ceramidase 2 | |||||
| Asah3l (Acer2) | ILMN_2629112 | 4: 86.6 | 4**: 88.0** | 0.58 | 0.0001 |
| Alpha hemoglobin stabilizing protein | |||||
| Eraf (Ahsp) | ILMN_2619200 | Unknown | --- | 0.45 | 0.0168 |
| 8430408G22Rik | |||||
| Fseg (Depp) | ILMN_2894211 | 6: 116.6 | --- | 0.45 | 0.0000 |
| E2F transcription factor 2 | |||||
| E2f2 | ILMN_2673776 | 4: 135.7 | 7: 125.8 | 0.35 | 0.0168 |
| Ubiquitin-conjugating enzyme E2L 6 | |||||
| Ube2l6 | ILMN_2431619 | 0.25 | 0.0473 | ||
Figure 2.
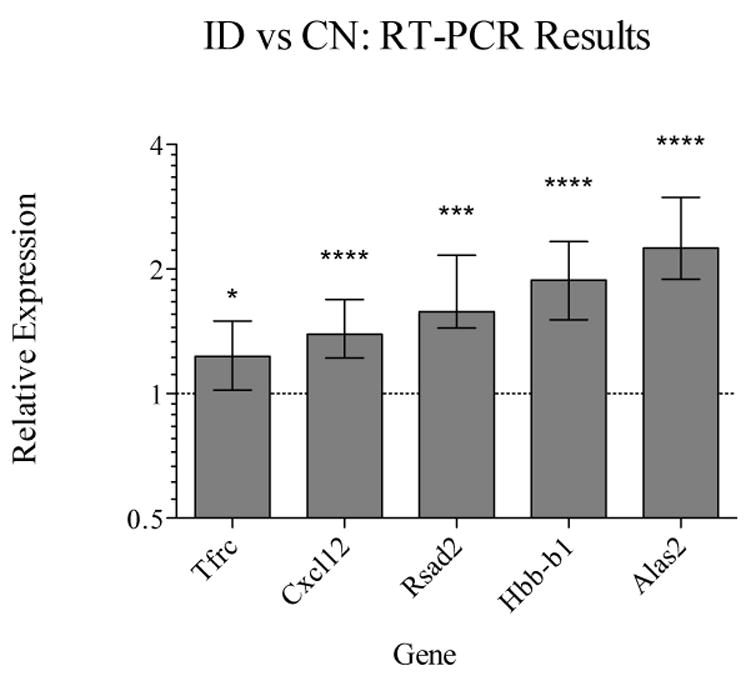
Across-strain RT-PCR confirmation of changes in expression in ID versus CN mice. Relative expression refers to the log2 ratio (LR) of ID/CN values, determined using the ΔΔCT method. A value of 1 on the y-axis is equivilant to a 2-fold increase in expression in mice fed the low iron diet. Error bars indicate 95% CI of the mean difference in expression; *=p<0.05, **=p<0.01, ***=p<0.001.
Figure 3.
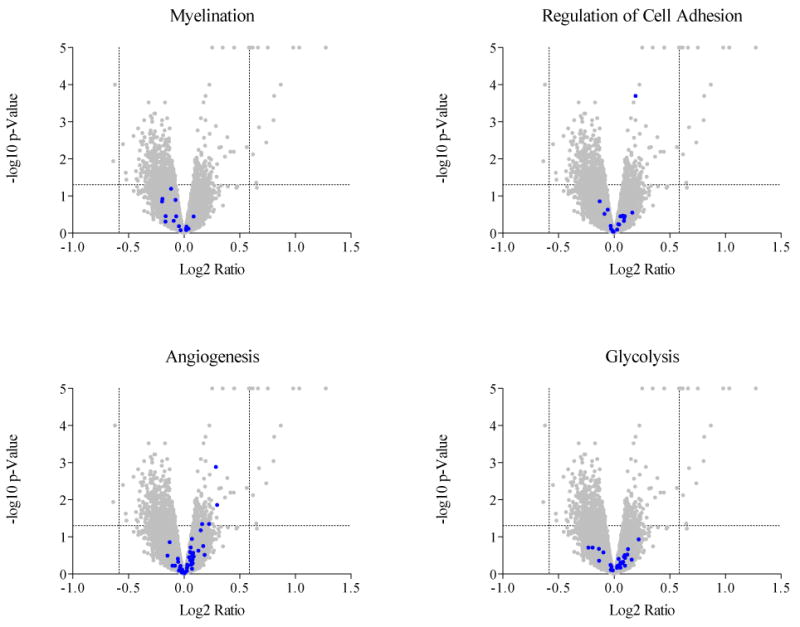
Volcano plots showing the distribution of gene probes in terms of significance and fold change in iron deficiency across all six strains; here, the four GO terms most significantly enriched in iron deficiency are individually depicted, with genes from the GO term gene set highlighted in grey.
Transcriptional response to ID is strain-dependent
Among the six strains, the number of significant expression changes seen with ID was highly variable. These ranged from 295 and 257 differentially expressed genes in BXD strains 6 and 40, respectively, to 39 in BXD strain 19, 13 in BXD strain 31, 5 in BXD strain 38, and 1 in BXD strain 39. There was also wide, strain-based variation in the overall direction of the transcriptional response. Expression changes in BXD strains 6, 40, and 19 were predominately down, whereas those in strains 38 and 39 were predominately up. In strain 31, the most interesting finding is how minimal the transcriptional response was to the ID diet, with no apparent tendency toward up- or down-regulation. These expression patterns are illustrated in volcano plots (Figure 4).
Figure 4.
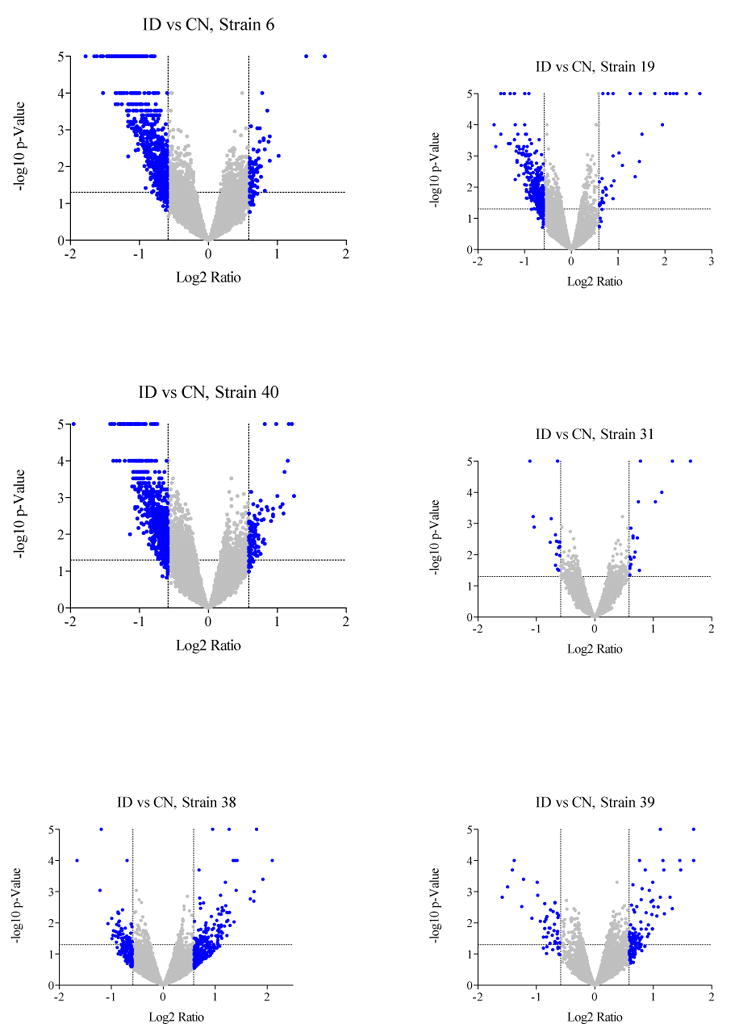
Volcano Plots illustrating strain-based differences in the effects of iron deficiency on gene expression in the VMB. Each point represents a single probe on the Illumina array; probes are distributed in terms of significance (y-axis) and fold-change (x-axis) when iron deficient mice are compared to control mice within each strain. Points highlighted in grey reached significance (p<0.05) and/or showed more than 1.5-fold change in expression.
Transferrin receptor (Tfrc) was the only major iron regulatory gene affected by the low iron diet
Tfrc is a known major iron regulatory gene and is the receptor for the primary iron transporter, transferrin. VMB expression of Tfrc was relatively high, ranging from 12.2 to 13.3 in CN mice across the six strains. Tfrc was up-regulated 1.5-fold in ID mice compared to CN. A two-way analysis of covariance (ANCOVA) showed that Tfrc expression was not only significantly up-regulated by the ID diet (F1,45=12.68, p<0.001), but also significantly different across the strains (F5,45=3.134, p<0.05). There was no strain by diet interaction and Tfrc was not significantly influenced by hematocrit. Notably, in the microarray analysis, within-strain increases in Tfrc were non-significant. In the follow-up RT-PCR analysis, Tfrc expression was again significantly up-regulated overall; however, this up-regulation reached significance in strain BXD 40 only (t39=2.169, p<0.05), with 1.35-fold higher expression in the ID mice.
Gene Expression Related to Dopamine
ID produced several expression changes in dopamine-related genes in the VMB. These included dopamine receptor 2 (Drd2), stromal cell-derived factor 1 (Sdf1, or Cxcl12), and hemoglobin, adult beta-chain (Hbb-b1)).
Drd2 was highly expressed in the VMB among the strains with little variation (ranging 12.3-12.6). While no changes in Drd2 were detected with the FDR applied, removal of the FDR and use of alpha of p<0.05, revealed a marginally significant decrease in the expression of this gene across the strains under ID dietary conditions (ILMN_2988228; LR=-0.23, p<0.05). Within-strain comparisons using t-tests with Welch Correction revealed a significant effect of the diet in strain 40 (t8=2.50, p<0.05) and strain 6 (t7=3.93, p<0.01; Figure 5).
Figure 5.
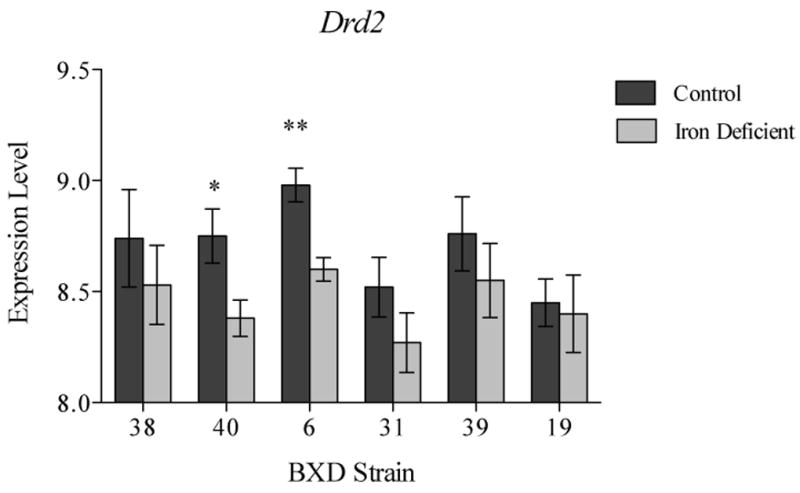
Results from Illumina Beadchip analysis showing decrease in Drd2 expression in two BXD strains following 100 days on a low iron diet (mean +/- SD). *=p<0.05, **=p<0.01; no FDR applied. Expression level of 8 refers to mean expression level of all probes; each one-unit difference in expression is a two-fold difference.
Cxcl12 was highly expressed in the VMB with little variation in baseline expression (range of expression=12.1-12.6 in CN mice). The low iron diet led to increased expression of Cxcl12; expression was 1.7-fold higher overall in ID mice (LR=0.752, Q<0.001). Within-strain increases were significant in strain 40, with 1.98-fold higher expression in ID (LR=0.985, Q<0.001), and strain 19, with 2.39-fold higher expression in ID (LR=1.255, Q<0.01). RT-PCR confirmed the overall increase in Cxcl12 expression and, with larger numbers of mice per group, showed that increases in Cxcl12 expression were similar in magnitude and in fact significant in four of the six strains (Figure 6): BXD 40 (t37=2.154, p<0.05), BXD 19 (t18=2.695, p<0.05), BXD 39 (t22=6.414, P<0.0001), and BXD 31 (t16=2.527, p<0.05). Using the microarray data, a two-way ANCOVA for Cxcl12 expression showed that hematocrit was a highly significant covariate (F1,45=18.76, p<0.001), but that even when hematocrit was controlled for, there was a significant main effect for strain (F5,45=3.151, p<0.05) with diet showing a non-significant trend (F1,45=3.508, p<0.10). No strain by diet interaction was detected. Given the large effect of hematocrit on Cxcl12 expression, the data were reanalyzed for differential expression, grouping the mice by hematocrit rather than dietary treatment (Hct <35 vs. Hct >35). Indeed, up-regulation of Cxcl12 in mice with low hematocrit exceeded the up-regulation attributed to diet alone; in strain 40, low-hematocrit mice showed 3.58-fold higher Cxcl12 expression than those within the range of normal (LR=1.84, Q<0.02); similarly, in strain 19, expression was 2.28-fold higher, although non-significant (LR=1.19, Q<0.10).
Figure 6.
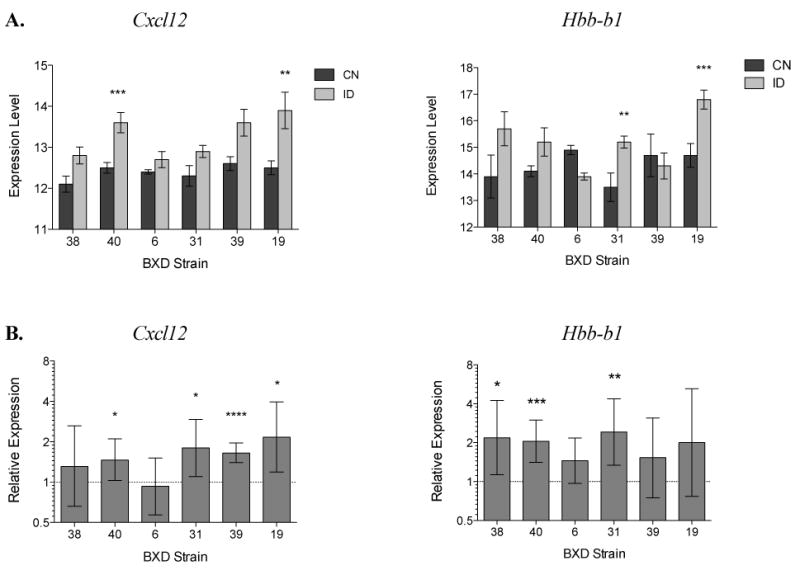
Within-strain RT-PCR confirmation of increases in expression of Hbb-b1 and Cxcl12 in ID versus CN mice. A. Results from Illumina Beadchip microarray analysis (*=Q<0.05, **=Q<0.01, ***=Q<0.001) B. Results from RT-PCR anslysis. Relative expression refers to the log2 ratio (LR) of ID/CN values, determined using the ΔΔCT method. A value of 1 on the y-axis is equivalent to a 2-fold increase in expression in mice fed the low iron diet. Error bars indicate 95% CI of the mean difference in expression (*=p<0.05, **=p<0.01, ***=p<0.001).
Hbb-b1 was also highly expressed in the VMB, with a wide range of baseline expression (range of expression=14.3–15.3 in CN mice). Hbb-b1 was up-regulated nearly 2-fold overall in mice fed the low iron diet (Table 2, Figure 2). Among the strains, the increases were quite variable, with a 4.9-fold increase in strain 19 (LR=2.31, Q <0.0001) and 2.37-fold increase in strain 31 (LR=1.25, Q<0.05) but non-significant changes in the other four strains (Figure 6). Notably, strain 6 showed a trend toward a decrease in expression. In fact, strain 6 also showed a non-significant decrease over 2-fold in Hba-a1 expression (LR= -1.17, Q<0.10). Despite the fact that Hba-a1 and Hbb-b1 expression are known to be tightly correlated, Hba-a1 expression was unchanged in any other strain (data not shown). In the RT-PCR analysis (Figure 6), Hbb-b1 increases were significant in BXD 38 (t13=2.54, p<0.05), BXD 31 (t13=3.24, p<0.01), and BXD 40 (t29=3.92, p<0.001). There was a modest but significant correlation between Hbb-b1 expression and hematocrit (r=-0.38, p<0.01).
DISCUSSION
ID alters dopamine functioning in the brain, but the underlying mechanisms are unknown. ID causes a number of changes in gene expression, at least early in development (Clardy et al., 2006; Carlson et al., 2007, 2008) but these changes have not yet been profiled in regions with direct ties to nigrostriatal dopamine function, nor in adulthood, when iron-related RLS typically develops. Here, we investigated whether any transcriptional-level effects occur in genes with ties to dopamine function. Because susceptibility to ID in the VMB is known to vary, we measured these effects in both ID-susceptible and ID-resistant strains of mice. In this way we also sought to determine the extent to which susceptibility to ID is related to gene expression. This study revealed novel expression changes in a number of genes, including three genes with direct ties to nigrostriatal dopamine function. Moreover, it showed that these changes vary widely depending on strain.
ID altered gene expression in the VMB
Across the strains, ID led to a number of changes in the expression of individual genes and changes in several gene sets, including myelination, cell adhesion, angiogenesis, and glycolysis. The down-regulation of myelination-related genes and up-regulation of those related to angiogenesis is in line with previous reports that ID leads to hypo-myelination and increased angiogenesis (Beard et al., 2003; Todorich et al., 2009; Eckard et al., 2010). Hypo-myelination is also characteristic of RLS in humans (Connor et al., 2011). Of the thirteen genes whose expression changed when all strains were included, seven could be tied to erythropoiesis or erythrocyte function, including Slc4a1(AE1), which encodes band 3, an erythrocyte membrane protein, Gypa, which encodes Glycophorin A, an erythroid protein that interacts with AE1, E2f2, which encodes a transcription factor, E2F2, that complexes with GATA-1, the master-controlling transcription factor of erythropoiesis (Kadri et al., 2009), Alas2, which encodes an erythroid enzyme that catalyzes the first step of heme biosynthesis, Ahsp, which encodes an erythroid protein that stabilizes free alpha-hemoglobin (Kihm et al., 2002), and Hbb-b1, which encodes the adult beta chain of hemoglobin. Rsad2 encodes viperin, which is iron-sulfur cluster-binding and involved in the immune response. While the known functions of these genes are primarily erythrocyte-specific, pleiotropic functions yet to be discovered for these genes could be important in the VMB during ID. For example, Hbb-b1 was recently found to be important not only for hemoglobin but also for the functioning of dopaminergic neurons in the substantia nigra (Biagioli et al., 2009).
No link found between VMB gene expression profiles and iron loss profiles in ID
Although gene expression patterns in the VMB in response to ID were strain-specific, we did not find a direct association between the predicted extent of VMB iron loss in each strain and patterns of gene expression. In fact, the two strains that were by far the most susceptible to VMB iron loss of all BXDs in previous work (BXD 38 and 40, with ∼40% reductions; Jellen et al., 2012) also had the most strikingly divergent responses to ID at the transcriptional level; many expression changes in strain 40 were opposite those seen in strain 38. Thus, susceptibility to ID in the VMB is either 1) not strongly related to transcription-level differences, 2) influenced by differences in only one or a few genes (in which case more strains would be required to detect a correlation), or 3) driven by very diverse patterns of expression.
Direct and/or indirect effects of the diet may underlie diversity of expression among strains
Some of the strains’ diversity of expression in ID might be explained by indirect effects of ID, secondary to the diet itself. Susceptibility to ID is a complex phenotype and does not only vary in terms of brain iron concentration. In past work, we showed that in addition to differing in the response to ID in the VMB, the BXD strains vary widely in the systemic response as well (e.g., some strains become severely anemic while others remain normal; Yin et al., 2012). Systemic differences could have led to indirect effects of the diet on gene expression and could explain differences among strains with similar VMB iron loss profiles. For example, one of the expression changes in our study, up-regulation of Cxcl12, was attributable to low hematocrit (suggestive of anemia) more so than the low iron diet itself. Thus the extent of Cxcl12 up-regulation in ID in the VMB is not directly related to the extent of ID in the brain, per se.
It is also possible that ID-induced changes in the dopamine system may underlie changes in gene expression in ID mice. Given the duration of our dietary treatment and what is known about the effects of ID on dopamine systems, we would expect disturbance of the dopamine system in the ID mice in this study, likely to extent among the strains. Strain-based differences in the effects of ID on dopamine systems have not been profiled in the BXDs, but baseline differences in dopamine systems have. Large differences in basal striatal dopamine receptor densities and other dopamine-related phenotypes among the BXD strains have been reported (Jones et al., 1999; Hitzemann et al., 2003). Thus it is not unreasonable to assume that there may also be differences among the BXD strains in the effects of ID on the dopamine system. It is also possible that changes in the dopamine system lead to compensatory changes in gene expression, thus “iron-responsive” genes in this study could ultimately be “dopamine responsive.” As such, strain-based differences in their expression response could come back to strain-based differences in the dopamine system. However, with two of the dopamine-related genes identified as iron-responsive in this study, Cxcl12 and Hbb-b1, there is evidence to suggest that this is not the case. As mentioned above, Cxcl12 expression appears to be linked to differences related to hematocrit and hemoglobin. And as detailed below, research has shown bi-directional interactions between CXCL12 and Ferritin Heavy-Chain (FHC), an iron-storage protein and indicator of iron status; thus iron status is known to affect at least the protein (Li et al., 2006). Furthermore, a number of effects of Cxcl12 on the dopamine system have been described, but not the converse (Guyon et al., 2006, 2008; Skrzydelski, et al., 2007). Finally, the predicted effects of Cxcl12 up-regulation on the dopamine system dovetail nicely with the effects of ID on this system. For Hbb-b1, as discussed below, there is evidence that its expression can influence iron regulation and that it can influence the functioning of dopaminergic neurons (Biagioli et al., 2009). There is not yet evidence to show that its expression is controlled by dopaminergic factors, although this remains a possibility with both genes.
ID had no detected effects on iron regulatory genes other than Tfrc
Significant changes did not occur in the transcript levels of any major iron homeostatic genes except transferrin receptor (Tfrc). This is not surprising, as changes in cellular iron affect key iron-management proteins primarily through changes in the post-transcriptional mechanisms (Wang and Pantopoulos, 2011; Singh et al., 2012). Transcriptional changes may have occurred with ID, however, undectable with our sample size. Up-regulation of Tfrc is consistent with the known function of this gene, which is to allow transferrin-bound iron to enter the cell; an increase in its expression reflects low cellular iron levels. The fact that changes in Tfrc were only significant in strain BXD 40 could have reflected true expression differences among the strains, or could have been because the fold-change was small and this strain had a larger sample size (41 mice total) compared to the other strains in the RT-PCR analysis, which had between 16 and 23 mice total.
ID altered the transcription of several dopamine-related genes, including Hbb-b1 and Cxcl12
While it is clear that ID impairs various aspects of central dopamine functioning, the mechanistic basis for iron-dopamine interactions is poorly understood. Our ID diet altered the expression of at least three genes that play a direct role in nigrostriatal dopamine function: Cxcl12, Hbb-b1, and, with marginal significance, Drd2. While future work is required to define the exact causes and effects of these expression changes, it is plausible that they are mechanisms by which ID alters the nigrostriatal dopamine profile. To our knowledge, neither Cxcl12 nor Hbb-b1 has previously been implicated in an iron-dopamine pathway. The following is a discussion of their roles in dopamine function and iron regulation.
Hbb-b1
Hbb-b1 encodes the beta chain of hemoglobin. While traditionally known for its role in oxygen transport in the blood, Hbb-b1 is also important for dopamine functioning in the brain (Biagioli et al., 2009). In a recent microarray experiment, Biagioli and colleagues revealed that Hbb-b1 expression not only occurs in dopaminergic neurons of the SN, but may also play an important functional role there. Overexpression of Hbb-b1 and Hba-a1 in dopaminergic cell lines alters transcription related to iron metabolism, O2 homeostasis, oxidative phosphorylation, and nitric oxide synthesis (Biagioli et al., 2009). Interestingly, iron metabolism, O2 homeostasis, and oxidative phosphorylation were three of the processes altered by ID in our work, concurrent with ID-induced increases in Hbb-b1 expression. While it is unclear from our work whether Hbb-b1 up-regulation is occurring in dopaminergic neurons, it would be interesting to find out and, if so, to investigate whether its effects mirror any of the above effects of Hbb-b1 and Hba-a1 overexpression. Notably, Hba-a1 was not affected; the reason for this is unclear, as Hba-a1 and Hbb-b1 expression are typically tightly correlated.
Cxcl12
Cxcl12 encodes a chemokine that activates the nigrostriatal dopamine system; it increases the excitability, firing pattern, and action potential frequency of dopaminergic neurons of the SN (Guyon et al., 2006; Skrzydelski, et al., 2007). Cxcl12 also increases dopamine release by activating its receptor, CXCR4, which increases the amplitude of N-type high-voltage-activated Calcium currents (Guyon et al., 2008). The effects of Cxcl12 on dopamine also surface at the behavioral level; its expression is not only correlated with cocaine-induced stereotypy in the BXD strains (Jones et al., 1999; genenetwork.org)—it increases cocaine-induced stereotypy when injected into the CP (Trecki and Unterwald, 2009). One of the effects of ID on the dopamine system is increased extracellular DA in the nigrostriatal pathway (Beard et al., 1994; Bianco et al., 1998). Given the above effects of Cxcl12 on the dopamine system, it is plausible that ID-induced up-regulation of Cxcl12 contributes to this increase.
Cxcl12 has also previously been linked to iron regulation; the protein, CXCL12, is intimately tied to the functioning of ferritin heavy-chain (FHC), a cellular iron storage protein (Li et al., 2006). CXCL12 induces co-localization of FHC with its receptor and also causes the phosphorylation and nuclearization of FHC. Interestingly, cytosolic FHC is decreased in the SN in RLS (Connor et al., 2009). FHC can also alter CXCL12 function; FHC knockdown prolongs the chemokine-receptor mediating signaling of CXCR4 (Li et al., 2006). Thus, the decrease in FHC in ID may further potentiate the actions of CXCL12 on its receptor.
Our findings extend those from previous reports of Cxcl12 and Hbb-b1 up-regulation in ID hippocampus
Finally, we are not the first to report an increase in Cxcl12 and Hbb-b1 in ID. In 2007, Carlson and colleagues showed that both are up-regulated in ID in the developing rat hippocampus. Indeed, and fittingly, changes in hippocampal and nigrostriatal function are two of the well-characterized effects of ID on the brain (Beard, 2003). That changes in the expression of these particular genes could have functional effects in the hippocampus is plausible; Hbb-b1 is expressed in astrocytes and mature oligodendrocytes there (Biagioli et al., 2009) and Cxcl12 alters the excitability of CA1 neurons (Guyon and Nahon, 2006). In more recent work, it has been suggested that CXCL12-CXCR4 signaling disrupted by early ID in the CA1 of the hippocampus may affect dendritic morphology there; the receptor for Cxcl12, Cxcr4, is down-regulated in the developing hippocampus CA1 in early ID along with a number of other genes that appear to be involved with abnormal apical dendrite formation (Brunette et al., 2010). The subsequent morphological changes may underlie later deficits in LTP and learning and memory that follow early ID. This is also relevant to the current work, as it is thus possible that the effects of early changes in the expression of Cxcl12 and/or Cxcr4 expression in ID may lead to morphologic changes elsewhere in the brain, such as the nigrostriatal pathway, which may in turn play a role in some of the irreversible effects of early ID there as well.
Conclusions
Iron imbalances in the brain (specifically the substantia nigra) are associated with dopamine malfunction and several neurological diseases including RLS; yet, the biochemical pathways that link iron to dopamine are unknown. Elucidating the effects of iron imbalances in the substantia nigra will lead to a better understanding of the etiology of dopamine-based neurological disease and thus to advances in the treatment of these diseases. Studying these effects across multiple genetic backgrounds will increase our understanding of individual differences in susceptibility to disease and underlying pathology. Here we have demonstrated wide genetic-based variation in the transcriptional response to ID in the brain and revealed changes in the expression of three genes with direct ties to nigrostriatal dopamine functioning, two of which have never before been implicated in an iron-dopamine pathway. Future work will determine whether these genes help mediate the effects of ID on dopamine functioning.
Highlights.
Inbred mice show differential gene expression in iron deficiency in brain
Some of these genes are related to dopamine
Two new iron/dopamine genes identified are Hbb-b1 and Cxcl12
Acknowledgments
This work was funded in part by NIA Grant # PO1AG021190, by a grant from the Restless Legs Foundation, by NRSA fellowship 5F31NS060393 to LCJ, and by NIAAA grant U01AA13499 to LL and RWW.
Footnotes
Publisher's Disclaimer: This is a PDF file of an unedited manuscript that has been accepted for publication. As a service to our customers we are providing this early version of the manuscript. The manuscript will undergo copyediting, typesetting, and review of the resulting proof before it is published in its final citable form. Please note that during the production process errors may be discovered which could affect the content, and all legal disclaimers that apply to the journal pertain.
References
- Allen RP, Auerbach S, Bahrain H, Auerbach M, Earley CJ. The prevalence and impact of restless legs syndrome on patients with iron deficiency anemia. Am J Hematol. 2013;88:261–264. doi: 10.1002/ajh.23397. [DOI] [PubMed] [Google Scholar]
- Astrakas LG, Konitsiotis S, Margariti P, Tsouli S, Tzarouhi L, Argyropoulou MI. T2 relaxometry and fMRI of the brain in late-onset restless legs syndrome. Neurology. 2008;71:911–916. doi: 10.1212/01.wnl.0000325914.50764.a2. [DOI] [PubMed] [Google Scholar]
- Beard JL, Chen Q, Connor J, Jones BC. Altered monoamine metabolism in caudate-putamen of iron-deficient rats. Pharmacol Biochem Behav. 1994;48:621–624. doi: 10.1016/0091-3057(94)90323-9. [DOI] [PubMed] [Google Scholar]
- Beard JL, Erikson KM, Jones BC. Neurobehavioral analysis of developmental iron deficiency in rats. Beh Brain Res. 2002;134:517–524. doi: 10.1016/s0166-4328(02)00092-x. [DOI] [PubMed] [Google Scholar]
- Beard JL. Iron deficiency alters brain development and functioning. J Nutr. 2003;133:1468S–1472S. doi: 10.1093/jn/133.5.1468S. [DOI] [PubMed] [Google Scholar]
- Beard JL, Wiesinger JA, Connor JR. Pre- and Post-weaning iron deficiency alters myelination in Sprague-Dawley rats. Dev Neurosc. 2003;25:308–15. doi: 10.1159/000073507. [DOI] [PubMed] [Google Scholar]
- Benjamini Y, Hochberg Y. Controlling the false discovery rate: a practical and powerful approach to multiple testing. J Roy Stat Soc B. 1995;57:289–300. [Google Scholar]
- Biagioli M, Pinto M, Cesselli D, Zaninello M, Lazarevic D, Roncaglia P, Simone R, et al. Unexpected expression of alpha- and beta globin in mesencephalic dopaminergic neurons and glial cells. Proc Natl Acad Sci. 2009;106:15454–9. doi: 10.1073/pnas.0813216106. [DOI] [PMC free article] [PubMed] [Google Scholar]
- Bianco LE, Wiesinger J, Earley CJ, Jones BC, Beard JL. Iron deficiency alters dopamine uptake and response to L-DOPA injection in Sprague-Dawley rats. J Neurochem. 2008;106:205–215. doi: 10.1111/j.1471-4159.2008.05358.x. [DOI] [PubMed] [Google Scholar]
- Brunette KE, Tran PV, Wobken JD, Carlson ES, Georgieff MK. Gestational and neonatal iron deficiency alters apical dendrite structure of CA1 Pyramidal neurons in adult rat hippocampus. Dev Neurosci. 2010;32:238–248. doi: 10.1159/000314341. [DOI] [PMC free article] [PubMed] [Google Scholar]
- Burhans MS, Dailey C, Beard Z, Wiesinger J, Murray-Kolb L, Jones BC, Beard JL. Iron deficiency: differential effects on monoamine transporters. Nutr Neurosc. 2005;8:31–38. doi: 10.1080/10284150500047070. [DOI] [PubMed] [Google Scholar]
- Carlson ES, Stead JDH, Neal CR, Petryk A, Georgieff MK. Perinatal iron deficiency results in altered developmental expression of genes mediating energy metabolism and neuronal morphogenesis in hippocampus. Hippocampus. 2007;17:679–691. doi: 10.1002/hipo.20307. [DOI] [PubMed] [Google Scholar]
- Carlson ES, Magid R, Petrk A, Georgieff MK. Iron deficiency alters expression of genes implicated in Alzheimer disease pathogenesis. Brain Res. 2008;1237:75–83. doi: 10.1016/j.brainres.2008.07.109. [DOI] [PMC free article] [PubMed] [Google Scholar]
- Clardy SL, Wang X, Zhao W, Liu W, Chase GA, Beard JL, True Felt B, Connor JR. Acute and chronic effects of developmental iron deficiency on mRNA expression patterns in the brain. J Neural Transm Suppl. 2006;71:173–196. doi: 10.1007/978-3-211-33328-0_19. [DOI] [PubMed] [Google Scholar]
- Connor JR, Boyer PJ, Menzies SL, Dellinger B, Allen RP, Ondo WG, Earley CJ. Neuropathological examination suggests impaired brain iron acquisition in restless legs syndrome. Neurology. 2003;61:304–309. doi: 10.1212/01.wnl.0000078887.16593.12. [DOI] [PubMed] [Google Scholar]
- Connor JR, Wand XS, Allen RP, Beard JL, Wiesinger JA, Felt BT, Earley CJ. Altered dopaminergic profile in the putamen and substantia nigra in restless legs syndrome. Brain. 2009;132:2403–2412. doi: 10.1093/brain/awp125. [DOI] [PMC free article] [PubMed] [Google Scholar]
- Connor JR, Ponnuru P, Lee BY, Podskalny GD, Alam S, Allen RP, Earley CJ, Yang QX. Postmortem and imaging based analyses reveal CNS decreased myelination in restless legs syndrome. Sleep Med. 2011;12:614–619. doi: 10.1016/j.sleep.2010.10.009. [DOI] [PMC free article] [PubMed] [Google Scholar]
- Earley CJ, B Barker P, Horska A, Allen RP. MRI-determined regional brain iron concentrations in early- and late-onset restless legs syndrome. Sleep Med. 2006;7:458–461. doi: 10.1016/j.sleep.2005.11.009. [DOI] [PubMed] [Google Scholar]
- Earley CJ, Horská A, Mohamed MA, Barker PB, Beard JL, Allen RP. A randomized, double-blind, placebo-controlled trial of intravenous iron sucrose in restless legs syndrome. Sleep Med. 2009;10:206–211. doi: 10.1016/j.sleep.2007.12.006. [DOI] [PMC free article] [PubMed] [Google Scholar]
- Eckard J, Dai J, Wu J, Jian J, Yang Q, Chen H, Costa M, Frenkel K, Huang X. Effects of cellular iron deficiency on the formation of vascular endothelial growth factor and angiogenesis--Iron deficiency and angiogenesis. Cancer Cell Int. 2010;10:28. doi: 10.1186/1475-2867-10-28. [DOI] [PMC free article] [PubMed] [Google Scholar]
- Erikson KM, Jones BC, Beard JL. Iron deficiency alters dopamine transporter functioning in rat striatum. J Nut. 2000;130:2831–2837. doi: 10.1093/jn/130.11.2831. [DOI] [PubMed] [Google Scholar]
- Erikson KM, Jones BC, Hess EJ, Zhang Q, Beard JL. Iron deficiency decreases dopamine D1 and D2 receptors in rat brain. Pharm Biochem Beh. 2001;69:409–418. doi: 10.1016/s0091-3057(01)00563-9. [DOI] [PubMed] [Google Scholar]
- Felt BT, Beard JL, Schallert T, Shao J, Aldridge JW, Connor JR, Georgieff MK, Lozoff B. Persistent neurochemical and behavioral abnormalities in adulthood despite iron supplementation for perinatal iron deficiency anemia in rats. Beh Brain Res. 2006;171:261–270. doi: 10.1016/j.bbr.2006.04.001. [DOI] [PMC free article] [PubMed] [Google Scholar]
- Georgieff MK. Long-term brain and behavioral consequences of early iron deficiency. Nutr Rev. 2011;69(Suppl 1):S43–48. doi: 10.1111/j.1753-4887.2011.00432.x. [DOI] [PMC free article] [PubMed] [Google Scholar]
- Godau J, Klose U, Di Santo A, Schweitzer K, Berg D. Multiregional brain iron deficiency in restless legs syndrome. Mov Disord. 2008;23:1184–1187. doi: 10.1002/mds.22070. [DOI] [PubMed] [Google Scholar]
- Guyon A, Skrzydelski D, Rovere C, et al. Stromal-cell-derived factor-1 alpha modulation of the excitability of rat substantia nigra dopaminergic neurons: presynaptic mechanisms. J Neurochem. 2006;96:1540–1550. doi: 10.1111/j.1471-4159.2006.03659.x. [DOI] [PubMed] [Google Scholar]
- Guyon A, Nahon JL. Multiple actions of the chemokine stromal cell-derived factor-1 alpha on neuronal activity. J Mol Endocrinol. 2007;38:365–376. doi: 10.1677/JME-06-0013. [DOI] [PubMed] [Google Scholar]
- Guyon A, Skrzydelski D, Rovere C, et al. Stromal-cell derived factor 1 alpha/CXCL12 modulates high-threshold calcium currents in rat substantia nigra. Eur J Neurosc. 2008;28:862–870. doi: 10.1111/j.1460-9568.2008.06367.x. [DOI] [PubMed] [Google Scholar]
- Hitzemann R, Hitzemann B, Rivera S, Gatley J, Thanos P, Shou LL, Williams RW. Dopamine D2 receptor binding, Drd2 expression and the number of dopamine neurons in the BXD recombinant inbred series: genetic relationships to alcohol and other drug associated phenotypes. Alcohol Clin Exp Res. 2003;27:1–11. doi: 10.1097/01.ALC.0000047862.40562.27. [DOI] [PubMed] [Google Scholar]
- Jellen LC, Beard JL, Jones BC. Systems genetics analysis of iron regulation in the brain. Biochimie. 2009;91:1255–1259. doi: 10.1016/j.biochi.2009.04.009. [DOI] [PMC free article] [PubMed] [Google Scholar]
- Jellen LC, Unger EL, Lu L, Williams RW, Rousseau S, Wang X, Earley CJ, Allen RP, Miles MF, Jones BC. Systems genetic analysis of the effects of iron deficiency in mouse brain. Neurogenetics. 2012;13:147–57. doi: 10.1007/s10048-012-0321-1. [DOI] [PMC free article] [PubMed] [Google Scholar]
- Jones BC, Tarantino LM, Rodriguez LA, Reed CL, McClearn GE, Plomin R, Erwin VG. Quantitative-trait loci analysis of cocaine-related behaviours and neurochemistry. Pharmacogenetics. 1999;9:607–617. [PubMed] [Google Scholar]
- Kadri Z, Shimizu R, Ohneda O, Maouche-Chretien L, Gisselbrecht S, Yamamoto M, Romeo PH, Leboulch P, Chretien S. Direct binding of pRb/E2F-2 to GATA-1 regulates maturation and terminal cell division during erythropoiesis. PLoS Biol. 2009;9:e1000123. doi: 10.1371/journal.pbio.1000123. [DOI] [PMC free article] [PubMed] [Google Scholar]
- Kihm AJ, Kong Y, Hong W, Russell JE, Rouda S, Adachi K, Simon MC, Blobel GA, Weiss MJ. An abundant erythroid protein that stabilizes free alpha-haemoglobin. Nature. 2002;417:758–763. doi: 10.1038/nature00803. [DOI] [PubMed] [Google Scholar]
- Li R, Luo C, Mines M, Zhang J, Guo-Huang F. Chemokine CXCL12 induces binding of ferritin heavy chain to the chemokine receptor CXCR4, alters CXCR4 signaling, and induces phosphorylation and nuclear translocation of ferritin heavy chain. J Biol Chem. 2006;281:37616–37627. doi: 10.1074/jbc.M607266200. [DOI] [PubMed] [Google Scholar]
- Lozoff B. Early iron deficiency has brain and behavior effects consistent with dopaminergic dysfunction. J Nutr. 2011;141:740S–746S. doi: 10.3945/jn.110.131169. [DOI] [PMC free article] [PubMed] [Google Scholar]
- Pelz CR, Kulesz-Martin M, Bagby G, Sears RC. Global rank-invariant set normalization (GRSN) to reduce systematic distortions in microarray data. BMC Bioinformatics. 2008;9:520. doi: 10.1186/1471-2105-9-520. [DOI] [PMC free article] [PubMed] [Google Scholar]
- Schroeder A, Mueller O, Stocker S, Salowsky R, Leiber M, Gassmann M, Lightfoot S, Menzel W, Granzow M, Ragg T. The RIN: an RNA integrity number for assigning integrity values to RNA measurements. BMC Mol Biol. 2006;7:3. doi: 10.1186/1471-2199-7-3. [DOI] [PMC free article] [PubMed] [Google Scholar]
- Skrzydelski D, Guyon A, Dauge V, et al. The chemokine stromal cell-derived factor-1/CXCL12 activates the nigrostriatal dopamine system. J Neurochem. 2007;102:1175–1183. doi: 10.1111/j.1471-4159.2007.04639.x. [DOI] [PubMed] [Google Scholar]
- Singh N, Haldar S, Tripathi AK, Horback K, Wong J, Sharma D, Beserra A, et al. Brain iron homeostasis: from molecular mechanisms to clinical significance and therapeutic opportunities. Antioxid Redox Signal. 2013 doi: 10.1089/ars.2012.4931. [Epub ahead of print] [DOI] [PMC free article] [PubMed] [Google Scholar]
- Snyder AM, Connor JR. Iron, the substantia nigra and related neurological disorders. Biochim Biophys Acta. 2009;1790:606–14. doi: 10.1016/j.bbagen.2008.08.005. [DOI] [PubMed] [Google Scholar]
- Subramanian A, Tamayo P, Mootha VK, Mukherjee S, Ebert BL, Gillette MA, Paulovich A, Pomeroy SL, Golub TR, Lander ES, Mesirov JP. Gene set enrichment analysis: a knowledge-based approach for interpreting genome-wide expression profiles. Proc Natl Acad Sci USA. 2005;102:15545–15550. doi: 10.1073/pnas.0506580102. [DOI] [PMC free article] [PubMed] [Google Scholar]
- Todorich B, Pasquini JM, Garcia CJ, Paez PM, Connor JR. Oligodendrocytes and myelination: the role of iron. Glia. 2009;57:467–78. doi: 10.1002/glia.20784. [DOI] [PubMed] [Google Scholar]
- Trecki J, Unterwald EM. Modulation of cocaine-induced activity by intracerebral administration of Cxcl12. Neuroscience. 2009;161:13–22. doi: 10.1016/j.neuroscience.2009.03.027. [DOI] [PMC free article] [PubMed] [Google Scholar]
- Unger EL, Paul T, Murray-Kolb LE, Felt B, Jones BC, Beard JL. Early iron deficiency alters sensorimotor development and brain monoamines in rats. J Nut. 2007;137:118–124. doi: 10.1093/jn/137.1.118. [DOI] [PubMed] [Google Scholar]
- Wang J, Pantopoulos K. Regulation of cellular iron metabolism. Biochem. 2011;434:365–381. doi: 10.1042/BJ20101825. [DOI] [PMC free article] [PubMed] [Google Scholar]
- Yin L, Unger EL, Jellen LC, Earley CJ, Allen RP, Tomaszewicz A, Fleet JC, Jones BC. Systems genetic analysis of multivariate response to iron deficiency in mice. Am J Physiol Regul Integr Comp Physiol. 2012;302:R1282–1296. doi: 10.1152/ajpregu.00634.2011. [DOI] [PMC free article] [PubMed] [Google Scholar]