

Abstract
Sjögren’s syndrome (SjS) is a chronic autoimmune disease characterized initially by lymphocytic infiltration and destruction of exocrine glands, followed by systemic organ damage and B-cell lymphoma. Conventional treatment is based on management of symptoms and there is a shortage of therapies that address the underlying causes of inflammation at source exocrine tissue. The aim of this study was to test a novel protein polymer-based platform consisting of diblock copolymers composed from Elastin-like Polypeptides (ELPs) fused with FKBP12, to deliver a potent immunosuppressant with dose-limiting toxicity, rapamycin (Rapa) also known as Sirolimus, and evaluate its effects on the inflamed lacrimal gland (LG) of non-obese diabetic mouse (NOD), a classic mouse model of SjS. Both soluble and diblock copolymer ELPs were fused to FKBP12 and characterized with respect to purity, hydrodynamic radii, drug entrapment and release. Both formulations showed successful association with Rapa; however, the nanoparticle formulation, FSI, released drug with nearly a 5 fold longer terminal half-life of 62.5h. The strong interaction of FSI nanoparticles with Rapa was confirmed in vivo by a shift in the monoexponential pharmacokinetic profile for free drug to a biexponential profile for the nanoparticle formulation. When acutely administered by injection into NOD mice via the tail vein, this FSI formulation significantly suppressed lymphocytic infiltration in the LG relative to the control group while reducing toxicity. There was also a significant effect on inflammatory and mammalian target of Rapamycin (mTOR) pathway genes in the LG and surprisingly, our nanoparticle formulation was significantly better at decreasing a proposed tear biomarker of SjS, cathepsin S (CATS) compared to free drug. These findings suggest that FSI is a promising tool for delivering Rapa for treatment of SjS in a murine model and may be further explored to meet the unmet medical challenge of SjS.
Keywords: Sjögren’s syndrome, Dacryoadenitis, Rapamycin, Cathepsin S, Non obese diabetic mouse, Elastin like-Polypeptide
1. Introduction
The lacrimal gland (LG), an exocrine secretory gland, is the main contributor to the aqueous layer of the tear film. It is primarily responsible for secretion of nutrients, proteins and antibodies to the surface of the eye, thus maintaining the integrity of the ocular surface. The LG is made up of ductal, myoepithelial and acinar cells, with the latter accounting for 80 % of the mass of the gland. In many pathological cases, changes in LG function due to profound inflammation results in insufficient secretion that leaves the eye compromised; these changes can lead to an array of different dry eye syndromes [1]. An important and typically underdiagnosed chronic autoimmune disease associated with severe dry eye and compromised visual acuity is Sjögren’s syndrome (SjS), characterized by lymphocytic infiltration and loss of function of the LG and salivary glands(SG) [2, 3]. Apart from affecting these glands, SjS also impacts multiple other organ systems such as the musculoskeletal and nervous systems, skin, lungs, kidneys, and the gastrointestinal tract [4]. A significant subset of SjS patients also develop B-cell lymphoma [5]. Early identification of SjS patients through the use of new and more effective biomarkers, combined with treatment with more potent and accessible immunomodulatory agents may prevent the most debilitating consequences of this chronic and progressive disease.
A well-established and widely used animal model for SjS is the male non-obese diabetic (NOD) mouse, which recapitulates many characteristics of human SjS such as lymphocytic infiltration of the LG (dacryoadenitis) and SG (sialoadenitis), accompanied by reduced secretory flow from these glands [2, 6]. Male NOD mice are more prone to developing dacryoadenitis than female NOD mice and this pathological change is usually initiated by 6 weeks and fully manifested in the LG by 12 weeks [2].In addition to these pathological abnormalities including lymphocytic infiltration and loss of tear flow, we have previously demonstrated an upregulation of inflammatory cytokinesin the LG including interferon gamma (IFN γ), IL-10, IL-12, as well as proteases including cathepsins S (CATS) and H. Intriguingly, along with the enhanced protein expression and enzymatic activity of CATS in NOD mice LG, there is increased activity recovered in tears [3].CATS is a lysosomal cysteine protease found in antigen presenting cells which plays a key role in regulating the processing and trafficking of MHC-II cells thus contributing to the modulation of MHC-II dependent immune responses [7, 8]. Inhibition of CATS in a mouse model of SjS significantly reduced lymphocytic infiltration in the LG and SG along with a suppression of autoimmunity [9]; thus it represents an indicator of therapeutic response.
The failure of conventional therapies for autoimmune diseases, which mainly include general immunomodulatory drugs in combination with palliative treatment of dry eye and mouth symptoms, motivated our interest to treat the root causes of SjS through development of novel therapies that restore the normal physiology of the ocular surface system [10, 11]. We chose to utilize a potent and systemic immunomodulatory agent, rapamycin (Rapa)also known as Sirolimus, to suppress inflammatory responses directed to the LG; unfortunately, Rapa is known to cause significant kidney and brain toxicity [12, 13] and has black box warnings for indications found in many autoimmune disease patients [14, 15]. Rapa is highly hydrophobic and has low water solubility. This results in low and unpredictable oral bioavailability (Sirolimus) and may necessitate parenteral delivery in solvent formulations (Temsirolimus), which include ethanol, polysorbate 80, and polyethylene glycol 400 [16, 17]. Previous work has attempted to develop novel drug delivery systems to safely deliver this immunosuppressant to tumors in mice, but this is the first time that either free Rapa or a drug delivery formulation of Rapa has been evaluated for SjS therapy [18, 19]. Despite drawbacks, Rapa offers exciting potential for treatment of SjS. It belongs to a class of immunosuppressive macrolides, several of which bind with high affinity to FK506 binding protein (FKBP12), the cognate human receptor to Rapa. The Rapa-FKBP12 complex is an all osteric inhibitor of mammalian target of Rapamycin (mTOR), a kinase consisting of two complexes, mTORC1 and mTORC2, and involved in regulating a myriad of cellular responses such as protein and lipid synthesis [20]. mTOR is associated with negative regulation of autophagy, a process playing an important role in immunity and inflammation [21]. T-cells in particular rely on autophagy for their development, survival and proliferation. In addition, B-cell survival, development of early B-cell progenitors, and dendritic cell activation is promoted by autophagy [5, 6]. Therefore, the inhibition of B- and T-cells and activation of dendritic cells could all contribute to the efficacy of Rapa in treatment of SjS. This drug has been explored in past to manage other autoimmune diseases [14, 15] but its use continues to be limited by dose-limiting side effects.
Because of concerns about the potential toxicity of Rapa, we proceeded to evaluate its efficacy with and without a drug carrier that we hypothesized would reduce the quantitative signs of toxicity. We utilized an emerging class of biodegradable and biocompatible nanoparticles composed from Elastin-like Polypeptides (ELPs) [22, 23]. ELPs are unique protein polymers that undergo reversible inverse phase transition wherein they remain soluble below their transition temperature (Tt) and form insoluble coacervates above Tt. Derived from human tropoelastin, ELPs consist of pentameric repeats of (Val-Pro-Gly-Xaa-Gly)n where the identity of Xaa and n determine Tt. ELPs with different Tt can be fused into diblock copolymers that assemble micelle nanoparticles [24, 25].In this study, an ELP diblock copolymer consisting of 48 ELP repeats with Xaa=Ser and 48 ELP repeats with Xaa=Ile (S48I48) capable of forming nanoparticles was genetically fused the FKBP12 protein on its amino terminus (FSI) (Figure 1).The goal was to develop these FSI nanoparticles to specifically load Rapa, release it at a very slow rate, and to reduce the renal exposure to drug. To control for the effects of nanoparticle assembly, another FKBP12ELP was developed to remain disassembled at body temperature, having 48 ELP repeats with Xaa=Val (FKBP-V48). To reduce renal filtration, the size of the FSI nanocarriers was optimized to fall between 10 and 100 nm. Through preliminary characterization studies, in vitro release studies, and in vivo pharmacokinetic (PK) modeling, the FSI nanoparticles were selected for therapeutic evaluation due to their higher hydrodynamic radius (24 nm), slower terminal rate of in vitro release, and in vivo modification of Rapa PK as compared to controls. In another recently published study from our group, this same FKBP-ELP Rapa formulation was characterized extensively in a tumor regression model of human breast cancer, where it decreased toxicity and enhanced the anti-cancer activity of Rapa [26]. We did not attempt to evaluate FKBP12 alone to sequester Rapa, as its low MW (12 kDa)is insufficient to avoid renalfiltration, making it unlikely to modulate nephrotoxicity.
Figure 1. Strategy for immunomodulation in the LG of NOD mice using protein polymer nanoparticles carrying Rapa.
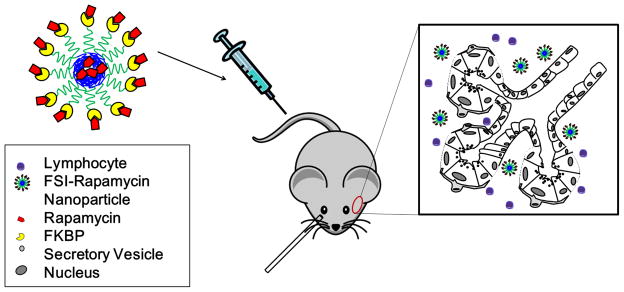
Male NOD mice were used as an experimental model. Mice received tail vein injections of Rapa encapsulated in the core of a protein polymer nanoparticle decorated with the FKBP domain (FSI), which binds additional Rapa on the surface of the particle. Rapa release from FSI is hypothesized to occur by diffusion or proteolytic degradation of the nanoparticles, either into interstitial fluid or within cells internalizing nanoparticles.
In the present study, we have evaluated the preclinical efficacy of free Rapa versus FKBP-ELP Rapa nanoparticles via tail vein injections in NOD mice in an acute administration study. Our data suggests that both free Rapa and FSI-Rapa nanoparticles elicit significant therapeutic effects in the LG. However, FSI-Rapa lacks the nephrotoxicity associated with the free drug following short-term treatment and had a more potent effect on reduction of tear biomarker of SjS, (CATS) [3] that has been clinically-validated (Hamm-Alvarez, SF et al., Manuscript in preparation).Our results provide insights into the potential for use of Rapa for the debilitating disorder, SjS, in a way that mitigates the detrimental effects of this potent agent.
2. Materials and Methods
2.1 Synthesis of ELPs
Here, we biosynthesized an ELP fusion protein called FSI, which consists of the human FKBP12 protein fused to an ELP diblock copolymer comprised of 48 repeats with Xaa=Ser and 48 repeats Xaa=Ile [26]. A second ELP fusion protein was expressed called FKBP-V48, which consists of the human FKBP12 protein fused to an ELP monoblock polymer comprised of 48 repeats with Xaa=Val [27]. ELP gene synthesis was carried out using recursive directional ligation (RDL) in a pET25b (+) vector in TOP 10 cells followed by protein expression in BLR cells. Constructs were purified using inverse transition cycling (ITC) following synthesis in E.coli.
2.2 FKBP-V48 and FSI characterization
Fusion protein polymers were checked for purity by CuCl2 SDS-PAGE gel analysis. The hydrodynamic radius (Rh) of FKBP-V48 or FSI at 37 °C was determined using dynamic light scattering (DLS) as previously described [28].
2.3 Encapsulation of Rapa using ELP nanoparticles
A two-phase solvent evaporation was used to drive encapsulation of the hydrophobic drug, Rapa [26]. An aqueous phase containing 250 μM FSI was mixed with an organic phase hexane/EtOH containing 250 μM Rapa. The vial was stirred and warmed above the critical micelle temperature(CMT) of the ELP diblock copolymers under dry nitrogen to drive evaporation of hexane/EtOH. The resulting solution was clarified by centrifugation at 13.2K RPM, 10 min, to remove insoluble drug. To determine the amount of encapsulated and released drug, the sample was injected into a C-18 reverse phase HPLC column and eluted in an H2O: Acetonitrile gradient from 50 % to 100 %. Rapa concentration was calculated using a standard curve. The loading efficiency of Rapa to FSI and FKBP-V48 was 78 % and 99 % respectively.
2.4 Rate of release of Rapa using dialysis
Rapa release from soluble FKBP-V48(125 μM) and FSI (200 μM) nanoparticles was determined by performing dialysis under sink conditions in water. The rate of release was determined at 30 °C for both the fusion protein polymers. Samples were collected from the dialysis cassette (cutoff 10 kDa)between 0 and 45 hrs. Samples were analyzed for Rapa content using Reverse phase – HPLC using a standard curve. The release half-life of the drug from both the fusion protein polymers was calculated by non-linear regression.
2.5 Reagents
The Reverse Transcription kit, the Universal Master Mix, and primers for real-time PCR analysis of CATS, SDHA (succinate dehydrogenase complex, subunit A) and GAPDH (Glyceraldehyde 3-phosphate dehydrogenase) were all purchased from Life Technologies (Grand Island, NY). The RNeasy plus Universal Mini Kit, the RT2 First strand kit and the mTOR (PAMM 098 Z), and Cytokine and Chemokine (PAMM 150 Z) PCR arrays were bought from Qiagen (Valencia, CA). The CATS activity assay kit was purchased from Biovision (Milpitas CA). The TOP 10 cells used for ELP gene transformation were obtained from Invitrogen (Carlsbad, CA). The BLR cells used for the final protein polymer expression were obtained from Novagen (Madison, WI). Precast gels used for the SDS page analysis were purchased from Lonza Inc. (Allendale, NJ). Rapa was purchased from LC Laboratory (Woburn, MA).Eye relief solution for washing the ocular surface of mouse eyes was from Bausch + Lomb (Rochester, NY). The 2-μL microcaps pipettes for tear collection were obtained from Drummond (Broomall, PA). Ketaject and Xylazine were obtained from the USC Vivarium and carbachol, used as a secretagogue for tear production, was from Sigma-Aldrich Corp. (St. Louis, MO).
2.6 Pharmacokinetic studies in normal mice
After dosing, the mice were euthanized at designated time points where blood was collected at 0.25, 1, 2, 8, & 24 h using cardiac puncture with heparinized syringes (n=2 for each time point). The collected blood was centrifuged at 2000 rpm for 10 minutes at 4 °C, and the plasma was frozen until further LC/MS analysis. An aliquot of 50 μL of the plasma sample was mixed with 50 μL of 500 ng/mL Tacrolimus (Fujisawa), which served as internal standard. Both Rapa and Tacrolimus were extracted using 350 μL acetonitrile and the samples were centrifuged at 13,000 rpm for 5 minutes. The clarified supernatant was quantified with Rapa. The pellet was resuspended in acetonitrile and centrifuged at 13,000 rpm to determine the encapsulated Rapa. The amount of Rapa was quantified using an Agilent 1100 linked onto API3000. The analytes were separated using a C18 Kinetex column (Phenomenex) with the following dimension 50 ×3.0 ×2.6 μm. The mobile phase utilized a gradient system consisting of two components, where component A was water with 0.1 % formic acid and component B was acetonitrile with 0.1 % formic acid. The program consisted of 50 % Component B at time 0), where the concentration increased to 90 % after two minutes and held for another five minutes. Rapa and Tacrolimus were quantified using MRM of 931.7 → 865.0 and 821.5 → 768.7, respectively. For direct comparison to FSI-Rapa, the resulting plasma concentrations for free Rapa and FKBP-V48 Rapa were adjusted slightly to an equivalent dose of 0.42 mg/kg BW using the following equation:
| Eq. 1 |
Common pharmacokinetic parameters were assessed using Graphpad Prism V5.0 a, and are presented in Table 2.
Table 2.
Rapamycin pharmacokinetic parameters are altered by incorporation with FSI nanoparticles
| * Parameter | FSI + Rapa | Free Rapa | FKPB-V48 + Rapa | |||
|---|---|---|---|---|---|---|
| **Preferred Model | biexponential | monoexponential | monoexponential | |||
| R2 | 0.944 | 0.864 | 0.618 | |||
| Adistribution (ng mL−1) | 1311 | (549) | n.a. | n.a. | n.a. | n.a. |
| Kdistribution (hr−1) | 1.9 | (0.7) | n.a. | n.a. | n.a. | n.a. |
| Thalf, distribution (hr) | 0.36 | (0.13) | n.a. | n.a. | n.a. | n.a. |
| Bterminal (ng mL−1) | 105 | (43) | 503 | (60) | 533 | (108) |
| Kterminal (hr−1) | 0.079 | (0.023) | 0.136 | (0.010) | 0.125 | (0.018) |
| Thalf,terminal (hr) | 8.8 | (2.6) | 5.1 | (0.4) | 5.6 | (0.8) |
| C0 (ng mL−1) | 1416 | (560) | 503 | (60) | 533 | (108) |
| AUC (ng hr ml−1) | 2019 | 3696 | 4270 | |||
| Cl (ml mL−1) | 0.21 | 0.11 | 0.10 | |||
| V0 (ml (g BW)−1) | 0.30 | 0.83 | 0.79 | |||
| ***kplasma-> tissue (hr−1) | 1.067 | n.a. | n.a. | |||
| ***kplasma->tissue (hr−1) | 0.215 | n.a. | n.a. | |||
| ***kelimination (hr−1) | 0.701 | 0.136 | 0.125 | |||
For each condition, the pharmacokinetic parameters of Rapa were fit to 10 independent samples (2 mice per time point) using quantitative HPLC mass spectrometry at an equivalent dose of 0.42 mg/kg BW (Fig. 3). Values are indicated as the mean (S.E.M.) n.a. indicates not applicable.
The extra-sum-of-squares F test was used to identify the simplest preferred model that improves the fit to the data (alpha = 0.05). Two models were considered: i) a biexponential curve [Cp = Adistribution e−kdistribution + Bterminal e−Kterminal t] ; and ii) a monoexponential curve [Cp = Bterminal e−kterminalt]
For the mono and biexponential curves, a one or two compartment model was used to interpret the microconstants associated with the elimination from a plasma compartment with volume V0.
2.7 Therapeutic studies in NOD model of LG dacryoadenitis
The male NOD mice used in this study were bred in house using breeding pairs purchased from Taconic (Hudson, NY) or purchased from Taconic at the age of 8 weeks. Treatments were initiated when animals reached 12 wks of age, when SjS-like disease is fully developed [3, 29]. Animals were divided into five groups receiving treatments through tail vein injection, at 2-day intervals, 3 times per week. Groups included: 1. Day 0 control (sacrificed on the day of the first injection with no injection given); 2, PBS control (PBS injected at equal volumes); 3, FSI-Rapa (150 μM, 0.75 mg/kg bodyweight Rapa); 4, free Rapa, (0.75mg/kg bodyweight); and 5, Vehicle control for free Rapa (60 % EtOH). Treatment 2 to 5 was administered using the injection schedule above. After the week of treatment, with injections given at day 0, 2 and 4, the animals were anesthetized on day 7 by i.p. injection of a mixture of 50-60 mg of Ketaject and 5-10 mg of Xylazine per kg of body weight and euthanized by cervical dislocation either directly or after tear fluid collection. LG were removed and placed in lysis buffer for RNA preparation, in CATS enzyme activity buffer or fixed immediately in 10 % neutral buffered formalin.
2.8 Tear Fluid Collection
Procedures are based on those previously published [3]. Mice were treated and euthanized and the LG was exposed through a small incision along an axis between the ear and the outer can thus of the eye. The ocular surface was washed with Eye Relief solution. The LG was stimulated by adding the agonist, carbachol (CCH, 3 μl, 50 μM), topically and tear fluid was collected as described before pooling and assay immediately for CATS activity [3].
2.9 Histology Evaluation
Horizontal paraffin sections (5 μm) of the LG were cut and stained with hematoxylin-eosin (H & E) according to standard procedures. After histological staining, LG sections were analyzed and photographed using a Nikon 80 i microscope equipped with a digital camera (Nikon Instruments Inc., Melville, NY). Low magnification images covering most of the gland in one optical field were obtained and levels of lymphocytic infiltration in a randomly chosen optical field per mouse were scored as % of tissue area using Image J software (National Institutes of Health, http://imagej.nih.gov/ij)by a blinded reviewer. N = 9-12 for day 0 control, PBS, free Rapa, FSI-Rapa and 5 for vehicle control. For nephrotoxicity studies, kidneys were isolated from mice at necropsy. The tissues were trimmed, weighed and placed in buffered formalin overnight. The tissues were cut in half, placed in paraffin, sectioned and stained with H & E. Five random 10 x fields were photographed per animal and analyzed by a blinded reviewer. The photo micrographs were scored for the number of vacuolated tubules.
2.10 Mammalian target of Rapamycin (mTOR) and Cytokines and Chemokines PCR array analysis
Quantitative mRNA expression analysis for 84 key genes from two commercial arrays was performed in RNA isolated from LG from control and treated NOD mice. These arrays included the Mouse mTOR Signaling RT2 Profiler PCR Array and the Mouse Cytokines & Chemokines RT2 Profiler PCR Array. We utilized four biological replicates for each treatment group. Total RNA was isolated from the LG and reverse transcribed (3000 ng) to cDNA per the manufacturer’s protocols using the RNeasy plus Universal Mini Kit and RT2 First strand kit, respectively. This cDNA was then added to the RT2 SYBR Green qPCR Master Mix and 10 μl of this mix was added to each well within a 384-well plate containing the genes. Quantitative real time PCR was then performed using the Applied Biosystems 7900 HT real time PCR system. Ct values were obtained from the ABI SDS 2.3 software followed by calculation of fold changes using the web-based analysis software from SA Biosciences. The relative gene expression of each gene for the treatment groups was calculated relative to the PBS control group using five housekeeping genes as internal controls. Data have been represented as either fold up- or down-regulation. Ingenuity ® Pathway analysis was used to identify biological functions relevant to the entire dataset.
2.11 Measurement of CATS Activity
LG were collected from anesthetized NOD or BALB/c mice treated as above. Isolated LG were placed in 2.0 ml tubes with zirconium beads. 450 μL of CATS lysis buffer was added to each tube and the tissue was homogenized using a BeadBug ™ Homogenizer (Benchmark Scientific, Inc. Edison, NJ). The homogenate was clarified by centrifugation at 10,000 g at 4 °C for 10 min and clarified supernatant was analyzed immediately according to the manufacturer’s instructions. The protein concentration of samples was calculated using the NanoDrop ™ spectrophotometer (NanoDrop, Wilmington DE). 20 μg of LG lysate or 4 μL of tears were diluted to make a final volume of 100 μL. 2 μL of substrate was added to each well with and without CATS inhibitor for each sample and the reaction was incubated at 37°C for 1 h. CATS activity was also measured in tears using comparable procedures. % of CATS activity was calculated for each treatment by dividing CATS activity from individual groups relative to CATS activity from NOD mice treated with PBS.
2.12 Reverse Transcription and Real-Time Polymerase Chain Reaction (PCR) for CATS in mRNA extracted from LG
mRNA was extracted from LG of control and treated NOD and BALB/c mice using the RNeasy plus Universal Mini Kit (Qiagen, Valencia, CA) according to manufacturer’s protocol. cDNA was prepared using the Reverse Transcription Kit. The real time PCR was then done for CATSusing SDHA and GAPDH as internal controls. The recorded data was then analyzed using the ΔΔCt method. The change ratio for a specific gene was obtained by calculating ΔCt = Ct(CATS) - Ct (internal control), ΔCt (PBS)- ΔCt (FSI-Rapa or free Rapa) = ΔΔCt. Finally, relative expression was calculated using the formula 2−ΔΔCt.
2.13 Statistical analyses
All experiments were repeated at least four times. One-way ANOVA was used to compare means obtained in CATS activity and gene expression analyses and for comparison of mean percentage lymphocytic infiltration. Differences in gene expression in mouse LG following experimental treatments in mTOR and cytokine/chemokine pathways were assessed using a Student’s t-test. A right tailed Fisher’s exact test was used to calculate p-values for Ingenuity pathway analysis data. In all cases, significance was considered at p<0.05.
3. Results
3.1 Characterization of FKBP-ELP fusion protein polymers
The two fusion constructs were purified from E. coli with yields of 80-100 mg/L. The purity and molecular weights of the fusion protein polymers were determined using SDS-PAGE analysis (Table 1). Purified fusion protein polymers were analyzed using DLS to determine the hydrodynamic radii (Rh) at physiological temperatures. The Rh of FKBP-V48 and FSI (25 μM each) at 37°C were found to be 3.6 nm and 24 nm respectively. These features of FSI were characteristic of the SI core previously shown to form a nanoparticle [25]. The critical micelle temperature (CMT) for FSI (25 μM) was found to be 24.5 °C (Table 1).
Table 1.
Physical properties of FKBP-ELP fusion polymers.
| Label | a Amino Acid Sequence | Molecular Weight (kDa) | b Purity (%) | CMT (°C) | c Tt, bulk (°C) | d Rh at 37 °C (nm) |
|---|---|---|---|---|---|---|
| FKBP-V48 | FKBP-G(VPGVG)48 Y | 31.7 | 95.82 | - | 42 | 3.6 |
| FSI | FKBP-G(VPGSG)48(VPGIG)48 Y | 51.5 | 97.71 | 24.5 | 54.4 | 24 |
FKBP amino acid sequence: MGVQVETISPGDGRTFPKRGQTCVVHYTGMLEDGKKFDSSRDRNKPFKFMLGKQEVIRGWEEGVAQ MSVGQRAKLTISPDYAYGATGHPGIIPPHATLVFDVELLKLE
ITC purified samples (20 μg/ μl) mixed with SDS loading buffer, denatured, and characterized using copper chloride densitometry.
Phase transition temperature determined by analyzing turbidity profiles of samples (25 μM) at 350 nm on a UV-vis spectrophotometer.
Hydrodynamic radii (Rh) of samples (25 μM) determined by dynamic light scattering (n = 3).
3.2 Rate of release of Rapa from FKBP12ELPs using dialysis
Before evaluating the therapeutic efficacy of Rapa in animal studies, its release rate from the FSI nanoparticle was characterized in comparison to its monomeric counterpart, FKBP-V48. Rapa release from FSI exhibited a two-phase decay with an initial burst release of 2.2h half-life and a much longer terminal half-life of 62.5h that seemed ideal for retaining the drug on the FSI nanoparticles in vivo. On the contrary, Rapa release from FKBP-V48 displayed a single-phase decay with a much faster terminal half-life of 13.1 h (Figure 2).
Figure 2. FSI nanoparticles release Rapa with a longer terminal half-life compared to a soluble FKBP ELP fusion protein.
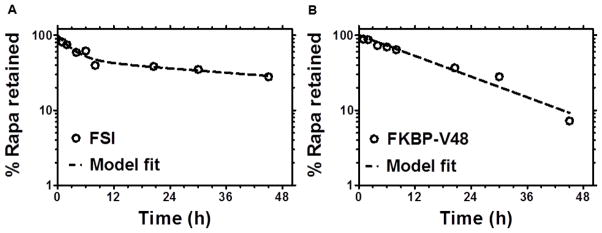
The release rate of Rapa loaded in FKBP-V48(125 μM)and FSI (200 μM) was determined by dialysis in water at 30 °C. A. Release from FSI nanoparticles above the CMT. Release follows a two-phase decay model with half-life initial = 2.2 ± 1.1 h and half-life terminal = 62.5 ± 36.1 h. B. Release from soluble FKBP-V48 below the transition temperature. In contrast to FSI nanoparticles, release from FKBP-V48 follows a single-phase decay with a shorter half-life terminal = 13.1 ± 2.0 h. (mean ± 95 % CI)
3.3 Pharmacokinetics model of rapa my cinclearance is significantly altered by FSI nanoparticles
Detailed pharmacokinetic evaluation of our formulations was carried out in BALB/c mice. Figure 3 depicts the Rapa plasma concentration versus time profile demonstrating a rapid decline in concentration in the free Rapa and FKBP-V48 Rapa. In contrast, Rapa encapsulated in the FSI formulation followed an initial rapid fall in concentration followed by a slower release over time indicating biexponential clearance behavior. Several pharmacokinetic parameters among the three formulations have been compared in Table 2. Key features include increase in the initial concentration Co and prolongation of terminal half-life with the FSI nanoparticles as compared to the other two formulations. Surprisingly, we observed a decrease in the plasma AUC and volume of distribution and an increase in clearance with FSI, which may result in lower exposure of the kidneys and explain the lower observation of reduced nephrotoxicity (Figure 7), a major limiting factor in Rapa treatment. Due to its slower terminal rate of release (Figure 2), induction of a biexponential drug clearance model (Figure 3), and potential avoidance of renal filtration due to its larger hydrodynamic radius (Table 1), the FSI nanoparticle formulation was selected over FKBP-V48 for further evaluation as a therapeutic agent.
Figure 3. FSI Nanoparticles induce biexponential pharmacokinetic clearance of Rapa.

Pharmacokinetic profiles of Rapa were assessed after intravenous administration in BALB/c mice, quantified from plasma samples at an equivalent dose of 0.42 mg/kg BW, and fit with either a biexponential or monoexponential curve (Table 2). A. The FSI nanoparticle data fit a biexponential equation with distribution, terminal half-lives of 0.36 hr, 8.8 hrs respectively. B. Free Rapa data followed a monoexponential equation with a 5.1 hr half-life. C. FKBP-V48 also followed a monoexponential equation with a 5.6 hr half-life. Most notably, only the FSI nanoparticle profiles were better fit by a two compartment PK model, which suggests they promote rapid in vivo tissue distribution of drug on the carrier followed by release back into circulation. This is associated with a 45 % decrease in the relative plasma bioavailability for FSI compared to free drug.
Figure 7. Tail vein administration of Free Rapa produces a higher level of injection site toxicity.

A. normal tail, B. bruised tail, C. tail with edema, D. necrotic tail. E. Table showing the % of mice in each experimental group with each condition. N = 22–25 for each treatment group except vehicle where N = 5. F. Kidney toxicity was measured as a function of the number of vacuolated renal tubules. As can be seen in the figure above, FSI Rapa did not cause any significant toxic changes compared to PBS and vehicle controls but significantly reduced kidney damage relative to the free drug. N = 4 for each group except vehicle where N = 3. ***P < 0.0001
3.4 Effect of FSI-Rapa treatment on lymphocytic infiltration of the LG
The major histopathological finding of SjS in the LG is dacryoadenitis, seen as lymphocytic infiltration of the LG; this inflammation enhances the destruction of the acini, causing secretory malfunction. This manifests in patients in the form of severe dry eyes, as their ability to produce the constitutive and reflex tears necessary for maintaining the ocular surface is lost [6]. To evaluate the effect of FSI-Rapa administration on lymphocytic infiltration, three groups of 12-week old male NOD mice were treated with FSI-Rapa, free Rapa and PBS, respectively with an untreated group acting as the control group. For comparison, LGs from untreated sex-matched BALB/c mice that do not exhibit dacryoadenitis were processed as above. As can be seen in Figure 4a, BALB/c LGs did not display any lymphocytic infiltration; however, the control and PBS-treated NOD mice showed extensive lymphocytic infiltration in the LG, which is indicated by deep purple patches representative of the nuclei of the infiltrating lymphocytes located in foci. In contrast, we observed a significant reduction of infiltrating immune cells in the LGs from the drug treated groups (Figure 4a). Moreover, image analysis of the percentage of area infiltrated by the lymphocytes demonstrated no visible difference between the control and PBS-treated groups; however, there was clear evidence of lymphocytic depletion in the LG of mice administered with FSI-Rapa and free Rapa (Figure 4b). FSI-Rapa caused a ~50 % reduction in the infiltrated area relative to the control (p=5*10−5) and PBS-treated mice (p = 0.0009) after just 3 injections within a week. Further more, free Rapa treatment demonstrated a similar decrease when compared to the control (p =0.001) and PBS-treated mice (p = 0.01). These results show that Rapa alone or associated with the ELP has a potentially favorable therapeutic effect on an in vivo model of SjS; further more, this is the first report demonstrating this effect on a model of SjS with any Rapa formulation.
Figure 4. Free Rapa or FSI-Rapa reduce lymphocyte infiltration in the LG of NOD mice.

LG were obtained from mice and evaluated for tissue histology using H&E staining. A. Normal control BALB/c mice at 12 weeks show no signs of infiltration; however, NOD mice from each treatment group show areas of purple nuclear staining, which indicate foci of infiltrating lymphocytes. Free Rapa and FSI-Rapa reduce lymphocytic foci relative to control NOD and PBS treated NOD mice. Scale bar represents 500 μm. B. Image analysis was used to quantify % of the tissue section represented by lymphocytic foci. * P = 0.003, **P = 5 x 10⁻⁵, ***P = 0.01, ****P = 0.0009.
3.5 FSI-Rapa and free Rapa treatments generate overlapping but not identical inflammatory gene responses
To determine the molecular changes in the inflammatory responses following drug treatments, we carried out gene expression profiling in the LGs of NOD mice treated with FSI-Rapa and free Rapa relative to PBS-treated mice (n=6 for each group). RNA was isolated immediately following LG isolation and a mouse cytokine and chemokine PCR array consisting of 84 key genes was performed. Quantitative gene expression values for the entire array can be found in Supplementary Table 1. The significance criteria were set to a fold change greater than 1.5 and p-value less than 0.05; with these criteria, an altered expression in 40 of the 84 genes in the FSI-Rapa treated mice was seen, but only 18 genes of the 84 genes were affected in the mice with the free Rapa treatment. Of the 40 genes differentially expressed with FSI-Rapa, most of the genes were downregulated (34) and the rest were upregulated. In case of the free drug, only 3 out of 18 genes were upregulated. A total of 15 genes were identified as having a common differential expression between the two different treatment groups with mostly decreased expression of these genes (13). The Venn diagram (Figure 5a) depicts the genes regulated by the individual treatments as well as the overlapping genes modulated by both the treatments. Supplementary table 1 provides the quantitative change for each gene. Overall, there was a general decrease in expression brought about by the FSI-Rapa treatment that seemed more potent than that elicited by Rapa alone.
Figure 5. FSI-Rapa nanoparticles increase the number of differentially transcribed cytokines and mTOR genes in the LG.
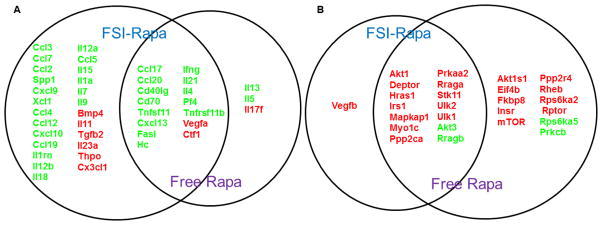
Overlap and distribution of genes in the cytokine and chemokine pathway (A, N=6), and mTOR pathway (B, N=4) significantly affected by both FSI-Rapa and Free Rapa treatments relative to the control PBS treatment in lysates obtained from NOD mice LG (P < 0.05). Green represents downregulation whereas red denotes upregulation. Notably, free drug upregulates MTOR itself, which FSI-Rapa does not. In addition, FSI-Rapa differentially regulates a larger number of cytokines than free Rapa, which suggests a more potent immunomodulatory effect mediated by FSI nanoparticles.
3.6 Altered mTOR-related gene expression post FSI-Rapa treatment
To evaluate the effects of our treatments on mTOR, we ran the RT2 mTOR-signaling array on LGs obtained from drug-treated mice (n=4 per group). This array consisted of 84 genes that are positive and negative modulators of mTOR, as well as its downstream effectors (Supplementary Table 2). The assay was performed and criteria for significance established as in the cytokine and chemokine array. 15 of the 84 genes were affected by FSI-Rapa treatment, of which 13 genes showed an increased expression and the other two were downregulated (Supplementary Table 2 and Figure 5b). However, when the mice were treated with the free drug, we found that 25 out of the 84 genes met our criteria wherein ~80 % of the genes were upregulated (23) and the rest showed downregulation. Figure 5b represents the genes commonly regulated by both the FSI-Rapa and the free Rapa treatments. Surprisingly the MTOR gene which is a target of the Rapa-FKBP12 complex, is upregulated by free Rapa, suggesting a compensatory effect that may reduce efficacy and lead to resistance to Rapa treatment; resistance mechanisms to mTOR inhibitors are reviewed by Carew et al [30]. The upregulation of MTOR is not seen with the FSI formulation, which may indicate a potentially more successful treatment with the drug carrier in the long term.
3.7 Biological Functional Analysis
We used Ingenuity Pathway Analysis (IPA) to determine the biological functions significantly modified by our drug treatments due to the expression changes in the inflammatory and mTOR-related genes. IPA predicts a decrease or increase in a particular biological process on the basis of the downregulation or upregulation of the genes involved in the study. Not surprisingly, either the FSI-Rapa or free Rapa treatment or both significantly altered a number of functions; the ones of special interest for this study are listed in Tables 3 and 4. As expected, there was a decrease in gene expression in genes implicated in in lymphocyte migration, which corroborates our earlier data depicting decreased lymphocytic infiltration with the drug treatments. There was also a significant reduction in inflammatory responses as predicted by IPA. On the contrary, a lesser degree of functional change was observed in the mTOR pathway analysis given that the number of genes affected was significantly lower than that in the cytokine and chemokine array. To our surprise, FSI-Rapa treatment decreased several relevant functions such as cell apoptosis and necrosis whereas free Rapa treatment was only involved in increased cell survival (Table 4). More than simply enhancing the effect of Rapa, these data suggest that FSI may actually modify the in vivo mechanism of action of Rapa.
Table 3.
Biological functions associated with cytokine expression changes
| Category | Functions | FSI_Rapa/PBS | Free Rapa/PBS | Prediction of change in function | P-value |
|---|---|---|---|---|---|
| Cellular movement/Immune cell trafficking | Leukocyte migration | 32 out of 48 genes responsible for decrease in this function affected | 35 out of 48 genes responsible for decrease in this function affected | Decrease | 5.57E–48 |
| Inflammatory response | Inflammatory response | 24 out of 39 genes responsible for decrease in this function affected | 24 out of 39 genes responsible for decrease in this function affected | Decrease | 6.55E–41 |
| Cellular movement/Immune cell trafficking/Hematological system development and function/Inflammatory response | Chemotaxis of mononuclear leukocytes | 17 out of 35 genes responsible for decrease in this function affected | 17 out of 35 genes responsible for decrease in this function affected | Decrease | 1.04E–38 |
| Cellular movement/Immune cell trafficking/Hematological system development and function | Migration of mononuclear leukocytes | 20 out of 30 genes responsible for decrease in this function affected | ------------ | Decrease | 4.53E–37 |
| Cellular movement/Immune cell trafficking/Hematological system development and function | Lymphocyte migration | 19 out of 29 genes responsible for decrease in this function affected | ------------ | Decrease | 1.50E–35 |
| Cellular movement/Immune cell trafficking/Hematological system development and function | Cell movement of myeloid cells | ------------ | 24 out of 40 genes responsible for decrease in this function affected | Decrease | 6.60E–46 |
| Cellular growth | Proliferation of hematopoietic cells | ------------ | 15 out of 24 genes responsible for decrease in this function affected | Decrease | 2.46E–28 |
Table 4.
Biological functions affected due to changes in mTOR genes
| Category | Functional Annotation | FSI-Rapa/PBS | Free Rapa/PBS | Prediction of change in function | P-value |
|---|---|---|---|---|---|
| Cell Death and survival | Cell death | 12 out of 19 genes responsible for decrease in this function affected | -------------- | Decrease | 7.44E–08 |
| Cell Death and Survival | Apoptosis | 14 out of 19 genes responsible for decrease in function affected | -------------- | Decrease | 1.03E–08 |
| Cell Death and Survival | Cell Survival | -------------- | 7 out of 10 genes responsible for increase in function affected | Increase | 1.36E–05 |
| Cell death and survival | Necrosis | 11 out of 17 genes responsible for decrease in this function affected | -------------- | Decrease | 6.35E–08 |
3.8 Superiority of FSI-Rapa over the free drug in reducing CATS protease activity
In an earlier study, we have reported a significant increase in CATS gene expression, protein abundance and enzymatic activity associated with dacryoadenitis in the LGs of NOD mice [3]. Results from another study in a different SjS mouse model also suggested its role in the development of sialoadenitis [9]. To investigate the effects of FSI-Rapa on CATS, we measured changes in gene expression levels and enzymatic activity of this protease in the LG of NOD mice after drug treatments. The mRNA expression was significantly reduced by 50 % relative to PBS-treated mice after FSI-Rapa treatment. A significant difference was also observed between FSI-Rapa and free Rapa, which did not reduce CATS expression(Figure 6a). We next analyzed CATS activity in lysates produced from the LG and also observed a profound decrease in activity of the FSI-Rapa treated mice but not the Rapa-treated mice in comparison to the PBS-treated mice (Figure 6b). This change in activity correlates well with the altered gene expression levels between these mice. Protein abundance was not measured in this study, but was shown to correlate well with gene expression and enzyme activity in lacrimal gland lysates in a previous study [3] We also detected significantly lowered levels of activity in mouse tears from FSI-Rapa but not Rapa-treated mice in comparison to PBS-treated mice(Figure 6c). It is of significant interest that the strongly immunomodulatory drug, Rapa, did not have any significant effect on either CATS levels or activity when given in the free form; however, when it was delivered in an ELP FSI nanoparticle, it seemed to exert a meaningful therapeutic effect. Additionally, we were able to confirm that NOD mouse CATS levels in LG and tears were markedly increased relative to age-matched BALB/c control mice, indicative of disease state (data not shown).
Figure 6. FSI-Rapa suppresses transcription and expression of CATS better than free Rapa.

The effect of FSI-Rapa on CATS, a biomarker of LG autoimmune dacryoadenitis, was evaluated in NOD mice. A. RT-PCR was used to measure mRNA expression levels of CATS in LG following 7-day treatment with Free Rapa, FSI-Rapa, and PBS. Bars represent mean + SD from n=15, *** indicates a P-value < 0.001 and **indicates a P-value < 0.01 by one-way ANOVA with Tukey’s multiple comparison test. B. LG lysates were prepared after tear collection and used to measure CATS activity as described in Methods. The graph represents % of CATS activity calculated by dividing activity within treatment group by activity in NOD mice treated only with PBS. Bars represent mean + SD from N=4 and each n was derived from 4 mice pooled, **indicates a P-value < 0.01 by one-way ANOVA with Tukey’s multiple comparison test. C. Tear fluid was collected following stimulation with CCH. Tears from 3 mice were pooled and the entire portion was used for measuring CATS levels. FSI-Rapa significantly reduced the activity in tears relative to the control PBS. One-way ANOVA with Tukey’s multiple comparison test was used to calculate the significance and *indicates a P-value < 0.01.
3.9 FSI-Rapa tail vein injections cause less injection site and kidney toxicity
Figure 7 shows the effect of the tail vein IV injections on NOD mice tails. We identified 4 different types of injection site phenotypes after injection protocols: normal, bruised, edematous and necrotic. The tails of FSI-Rapa treated mice rarely showed any signs of damage with only 4 % bruised post injection (Figure 7e). However, when free Rapa was injected into the tails, there was a staggering increase to 70 % edematous tails (Figure 7c), with 26 % bruised tails (Figure 7b) and a small amount (4 %) ending up as necrotic tails(Figure 7d). 40 % of tails injected with the vehicle used for free Rapa injections had edematous tails, with the rest belonging to the normal category. All the PBS- treated tails appeared healthy (Figure 7a). In aggregate, FSI-Rapa treatment appeared to elicit lower injection site toxicity than either free Rapa or vehicle. To test the hypothesis that FSI encapsulation can modulate renal toxicity, histological assessment of kidney sections evaluated number of tubules per field by a trained expert blind to the groups. There was a low level of kidney damage observed in untreated and vehicle (60 % ethanol) treated NOD mice with 1.5–2.0 tubules with vacuoles per field on average. Consistent with the known renal toxicity of Rapa, free drug significantly increased the kidney tubule vacuolization observed (7.8 tubules with vacuoles per field). However, encapsulation of Rapa in FSI reduced this kidney toxicity (3.2 tubules with vacuoles per field), which represents a significant (p<0.0001), quantifiable reduction in the nephrotoxicity (Figure 7f).
4. Discussion
SjS is one of the most common autoimmune diseases in the US, affecting >4 million Americans [31]. Currently available treatments consist mostly of a combination of immunomodulatory drugs and palliative treatments for dry eye and dry mouth symptoms. These measures are not always effective and often have extensive side effects, which is why development of new treatments directed more towards the mechanisms of the disease combined with drug delivery systems with the potential to more effectively bring drug to the affected glands, is of the highest importance. This study demonstrates the efficacy of Rapa in suppression of autoimmune dacryoadenitis, characteristic of SjS in a mouse disease model. Moreover, this study then utilizes a novel protein polymer-based delivery system to enhance the effectiveness of Rapa in treatment, resulting in more potent inhibition of CATS biomarker expression and secretion and changes in gene expression and reduced toxicity.
These findings were facilitated by an emerging class of drug carriers generated through biosynthesis of protein polymer nanoparticles (Figure 1). These protein polymer nanoparticles are composed from an ELP diblock copolymer fused with FKBP12. This approach was recently reported to block the growth of an mTOR dependent breast cancer xenograft; further more, FSI nanoparticles promote drug-specific encapsulation and sustained release [26]. There are three key rationales for exploring FSI nanoparticles for Rapa delivery: i) their increased hydrodynamic radius makes them unsuitable for renal filtration (Table 1), thus possibly reducing nephrotoxicity; ii) by high-density incorporation of FKBP12 at their surface, FSI nanoparticles can cooperatively bind drug and slow its rate of release (Figure 2); and iii) as substrates for intracellular and extracellular proteolysis, they have a built-in mechanism for non-toxic drug release inside or near lymphocytes [22]. This manuscript clearly confirms that the assembly of nanoparticles increases the hydrodynamic radius, since the hydrodynamic radius of FSI was 6.7 times larger than FKBP-V48 (Table 1). The greater radius of FSI indicates the formation of a nanoparticle, which is maintained at physiological temperatures and therapeutic concentrations. This study directly tested the hypothesis that the assembly of FKBP12 at the surface of FSI nanoparticles slows the rate of release, which was confirmed by showing that the terminal release rate of FSI nanoparticles was 4.8 times slower than for disassembled FKBP-V48 (Figure 2). These results are consistent with a prior study that extensively characterized Rapa release from nanoparticles with and without the FKBP12 domain [26]. The mechanism for this delayed release may reflect more effective encapsulation of Rapa into the hydrophobic nanoparticle core in addition to the potential co-operativity of binding to a dense brush of FKBP12. In contrast, FKBP-V48 does not form a nanoparticle with either a core or a dense coating of FKBP12, and thus the terminal release rate appears comparatively fast. Both the fusion protein polymers showed high Rapa loading efficiency immediately after encapsulation; however, only FSI retained consistent Rapa levels after the initial burst release. Thus, from these findings, FSI provides a more sustained release profile, which may better facilitate its ability to retain drug during circulation in vivo.
Having demonstrated the potential for stronger interaction between Rapa and the FSI nanoparticles, a PK study was next performed to verify that the FSI formulation can influence the pharmacokinetic profile in vivo (Figure 3).Rapa delivered in FSI nanoparticles adopted a completely different PK profile in comparison with either free Rapa or the soluble FKBP-V48 control. The FSI nanoparticles followed a two-compartment behavior, which is consistent with a more rapid tissue distribution of the nanoparticles compared with the free drug. The net effect of this shift was a 45 % decrease of the relative bioavailability of FSI-Rapa with comparison to the free drug. Coupled with a greater hydrodynamic radius that may restrict renal filtration, a reduction in plasma bioavailability could explain why the FSI formulation is better tolerated than free drug (Figure 7). What is most surprising is that this PK shift is also associated with an improvement in signs of Rapa therapy with regards to LG lymphocytes (Figure 4), on target changes in gene transcription (Figure 5), and suppression of the CATS tear biomarker for SjS (Figure 6). The exact mechanism behind this exciting improvement in therapy and the target cells involved (acinar cells, immune cells, both) will be explored by future studies.
SjS is characterized by immune cell infiltration and inflammation of the exocrine glands caused by a dysfunction in the regulation of T-, B- and dendritic cells [32]. Although the triggering factors of this immune cell dysfunction and homing to exocrine tissue are poorly understood, the mechanisms regulating T-, B- and dendritic cell function can be targeted for treatment. Here, histological analysis of the LGs clearly demonstrated, in contrast to the PBS and control group LG tissues, a significant suppression of lymphocytic infiltration in mice treated with Rapa and FSI-Rapa as indicated by the reduction in inflammatory nodes. This effect is quite important since severe lymphocytic infiltration in the LG is responsible for their atrophy and ultimate destruction, which in turn is associated with decreased reflex tearing and damage to the ocular surface due to tear insufficiency. Although this effect of Rapa cannot be clearly explained, it is probably related to the ability of this drug to inhibit T-lymphocyte activation as shown in a mouse model of Systemic Lupus Erythematosus (SLE) [33], an autoimmune disease closely related to SjS.
The gene expression analysis of proinflammatory cytokines and mTOR pathway mediators both support this hypothesis. In an earlier study, we demonstrated a significant increase in the mRNA expression of proinflammatory cytokines in the LG of NOD mice suggesting their role in the progression of SjS-like disease [3]. Another study has proclaimed a similar effect on the expression of inflammatory cytokines in salivary glands promoting the same theory [34]. In the present study, we noted a marked decrease in the gene expression of many inflammatory cytokines and chemokines in the NOD mice LGs treated with both FSI-Rapa and free drug, with a higher number of cytokines affected with the FSI-Rapa treatment. IPA analysis of these gene expression changes revealed involvement of many genes in decreasing lymphocytic migration, which would possibly explain the amelioration of lymphocytic infiltration in these treatment groups.
Rapa inhibits mTOR after forming a complex with FKBP12. Gene expression analysis of mTOR pathway mediators revealed that the MTOR gene itself is upregulated in the LG of mice treated with free drug but not FSI-Rapa, indicating that the latter might overcome compensatory effects induced by the former, which might provide further explanation as to why more cytokines are affected by the FSI formulation than the free drug. Among the most notable modifications by these treatments were ULK1 and ULK2, genes involved in the regulation of autophagy, which recently has been suggested to be an important factor in in the development of some autoimmune diseases, among them SLE [35]. Autophagy is also involved in a number of immunological processes including inflammatory regulation [36]. Therefore, the activation of autophagy may contribute to the efficacy of Rapa in treatment of SjS and other autoimmune diseases.
Previous studies in our laboratory LGs have demonstrated increased CATS gene expression, protein abundance and activity in the developmental progression of SjS in NOD mice. Also, in the same study, detection of elevated CATS activity in tears of NOD mice suggested a possible role of this protease in corneal stromal damage and hyperactivation of innervating nerves, which in turn would feedback to cause further loss of LG secretory function [3]. Here, we report a Rapa-mediated decrease in the proteolytic activity not only in the LG lysates but also in the tear fluid of the NOD mice. In correlation with the reduced activity of this protease, FSI-Rapa treatment also caused a statistically significant decrease in mRNA expression levels; however, there was not a prominent change in gene expression in mice LG treated with the free drug. The inhibition of CATS in SG of another mouse model of SjS has shown to reduce autoantigen presentation followed by autoimmunity blockage. Therefore, it is possible that we could suppress autoimmunity in the LG of our disease mouse model by therapeutically reducing CATS levels in their LG with FSI-Rapa treatment. Along this line, we hypothesize that our proposed formulation has significant therapeutic potential in modulating this autoimmune disease.
In summary, our data describe the first attempt at systemic delivery of a potent immunosuppressive drug, Rapa, in a nanoparticle carrier to treat SjS-like disease in an autoimmune mouse model. Rapa when administered alone and in the carrier has shown positive therapeutic effects in NOD mice LG including a suppression of lymphocytic infiltration and CATS, a proposed potential tear biomarker in SjS. Further more when Rapa is delivered in the carrier, the toxic side effects of the drug that have limited its treatment potential are reduced. Additional long term goals include the possibility to engineer the FSI-Rapa particle with targeting motifs to the LG or other tissues to enhance cell-specific drug uptake which may further increases its therapeutic potential, as has previously been demonstrated for a targeting nanoparticle with the same ELP back-bone [37]. Taken together, all the findings described in this paper suggest a possible therapeutic role of Rapa in SjS and show that effect on the LG can be enhanced and its toxic side effects reduced by administering the drug in the nanoparticle form.
Supplementary Material
Acknowledgments
The authors would like to thank Frances Yarber, Hua Pei, Zhen Meng and Anuja Raut for their contributions to this paper. This work was supported by the University of Southern California, NIH grants RO1EY017293-04S1 and RO1EY011386 to S.H.A, R21EB012281 to J.A.M. and P30 CA014089 to the Norris Comprehensive Cancer Center, the Translational Research Laboratory at the School of Pharmacy, and the American Cancer Society IRG-58-007-48. Histology services were provided by the Cell and Tissue Imaging Core of the USC Research Center for Liver Diseases (supported by P30 DK48522) and the Doheny Eye Institute, Advanced Imaging Core.
Abbreviations
- Rapa
Rapamycin
- SjS
Sjögren’s syndrome
- ELP
Elastin like-Polypeptide
- FSI
FKBP-S48I48
- CATS
Cathepsin S
- NOD
Non obese diabetic mouse
- LG
Lacrimal Gland
- mTOR
mammalian target of Rapamycin
- SG
Salivary gland
- CMT
Critical micelle temperature
- Tt
Transition temperature
- ITC
Inverse transition cycling
- FKBP12
FK-506 binding protein
- i.p
Intraperitoneal
- IFN γ
Interferon gamma
- CCH
Carbachol
- Rh
Hydrodynamic radii
- DLS
Dynamic light scattering
Footnotes
Publisher's Disclaimer: This is a PDF file of an unedited manuscript that has been accepted for publication. As a service to our customers we are providing this early version of the manuscript. The manuscript will undergo copyediting, typesetting, and review of the resulting proof before it is published in its final citable form. Please note that during the production process errors may be discovered which could affect the content, and all legal disclaimers that apply to the journal pertain.
References
- 1.Lemp MA. Dry eye (Kerato conjunctivitis Sicca), rheumatoid arthritis, and Sjogren’s syndrome. Am J Ophthalmol. 2005;140(5):898–9. doi: 10.1016/j.ajo.2005.06.031. [DOI] [PubMed] [Google Scholar]
- 2.da Costa SR, et al. Male NOD mouse external lacrimal glands exhibit profound changes in the exocytotic pathway early in postnatal development. Exp Eye Res. 2006;82(1):33–45. doi: 10.1016/j.exer.2005.04.019. [DOI] [PMC free article] [PubMed] [Google Scholar]
- 3.Li X, et al. Increased expression of cathepsins and obesity-induced proinflammatory cytokines in lacrimal glands of male NOD mouse. Invest Ophthalmol Vis Sci. 2010;51(10):5019–29. doi: 10.1167/iovs.09-4523. [DOI] [PMC free article] [PubMed] [Google Scholar]
- 4.Lee BH, Tudares MA, Nguyen CQ. Sjogren’s syndrome: an old tale with a new twist. Arch Immunol Ther Exp (Warsz) 2009;57(1):57–66. doi: 10.1007/s00005-009-0002-4. [DOI] [PMC free article] [PubMed] [Google Scholar]
- 5.Bayetto K, Logan RM. Sjogren’s syndrome: a review of aetiology, pathogenesis, diagnosis and management. Aust Dent J. 2010;55(Suppl 1):39–47. doi: 10.1111/j.1834-7819.2010.01197.x. [DOI] [PubMed] [Google Scholar]
- 6.Schenke-Layland K, et al. Increased degradation of extracellular matrix structures of lacrimal glands implicated in the pathogenesis of Sjogren’s syndrome. Matrix Biol. 2008;27(1):53–66. doi: 10.1016/j.matbio.2007.07.005. [DOI] [PMC free article] [PubMed] [Google Scholar]
- 7.Riese RJ, et al. Cathepsin S activity regulates antigen presentation and immunity. J Clin Invest. 1998;101(11):2351–63. doi: 10.1172/JCI1158. [DOI] [PMC free article] [PubMed] [Google Scholar]
- 8.Shi GP, et al. Cathepsin S required for normal MHC class II peptide loading and germinal center development. Immunity. 1999;10(2):197–206. doi: 10.1016/s1074-7613(00)80020-5. [DOI] [PubMed] [Google Scholar]
- 9.Saegusa K, et al. Cathepsin S inhibitor prevents autoantigen presentation and autoimmunity. J Clin Invest. 2002;110(3):361–9. doi: 10.1172/JCI14682. [DOI] [PMC free article] [PubMed] [Google Scholar]
- 10.Ramos-Casals M, et al. Treatment of primary Sjogren syndrome: a systematic review. JAMA. 2010;304(4):452–60. doi: 10.1001/jama.2010.1014. [DOI] [PubMed] [Google Scholar]
- 11.Akpek EK, et al. Treatment of Sjogren’s syndrome-associated dry eye an evidence-based review. Ophthalmology. 2011;118(7):1242–52. doi: 10.1016/j.ophtha.2010.12.016. [DOI] [PubMed] [Google Scholar]
- 12.Campistol JM, et al. mTOR inhibitor-associated dermatologic and mucosal problems. Clin Transplant. 2010;24(2):149–56. doi: 10.1111/j.1399-0012.2010.01232.x. [DOI] [PubMed] [Google Scholar]
- 13.Kahan B. Toxicity spectrum of inhibitors of mammalian target of rapamycin in organ transplantation: etiology, pathogenesis and treatment. Expert Opin Drug Saf. 2011;10(5):727–49. doi: 10.1517/14740338.2011.579898. [DOI] [PubMed] [Google Scholar]
- 14.Mayer DF, Kushwaha SS. Transplant immunosuppressant agents and their role in autoimmune rheumatic diseases. Curr Opin Rheumatol. 2003;15(3):219–25. doi: 10.1097/00002281-200305000-00008. [DOI] [PubMed] [Google Scholar]
- 15.Neuhaus O, Kieseier BC, Hartung HP. Immunosuppressive agents in multiple sclerosis. Neurotherapeutics. 2007;4(4):654–60. doi: 10.1016/j.nurt.2007.08.003. [DOI] [PMC free article] [PubMed] [Google Scholar]
- 16.Simamora P, Alvarez JM, Yalkowsky SH. Solubilization of rapamycin. Int J Pharm. 2001;213(1–2):25–9. doi: 10.1016/s0378-5173(00)00617-7. [DOI] [PubMed] [Google Scholar]
- 17.Yatscoff RW, et al. Rapamycin: distribution, pharmacokinetics, and therapeutic range investigations. Ther Drug Monit. 1995;17(6):666–71. doi: 10.1097/00007691-199512000-00020. [DOI] [PubMed] [Google Scholar]
- 18.Woo HN, et al. Preclinical evaluation of injectable sirolimus formulated with polymeric nanoparticle for cancer therapy. Int J Nanomedicine. 2012;7:2197–208. doi: 10.2147/IJN.S29480. [DOI] [PMC free article] [PubMed] [Google Scholar]
- 19.Oliveira RR, et al. Magnetic nanoparticles and rapamycin encapsulated into polymeric nanocarriers. J Biomed Nanotechnol. 2012;8(2):193–201. doi: 10.1166/jbn.2012.1384. [DOI] [PubMed] [Google Scholar]
- 20.Benjamin D, et al. Rapamycin passes the torch: a new generation of mTOR inhibitors. Nat Rev Drug Discov. 2011;10(11):868–80. doi: 10.1038/nrd3531. [DOI] [PubMed] [Google Scholar]
- 21.Jung CH, et al. mTOR regulation of autophagy. FEBS Letters. 2010;584(7):1287–1295. doi: 10.1016/j.febslet.2010.01.017. [DOI] [PMC free article] [PubMed] [Google Scholar]
- 22.Shah M, et al. Biodegradation of elastin-like polypeptide nanoparticles. Protein Sci. 2012;21(6):743–50. doi: 10.1002/pro.2063. [DOI] [PMC free article] [PubMed] [Google Scholar]
- 23.Pastuszka MK, et al. A tunable and reversible platform for the intracellular formation of genetically engineered protein microdomains. Biomacromolecules. 2012;13(11):3439–44. doi: 10.1021/bm301090x. [DOI] [PMC free article] [PubMed] [Google Scholar]
- 24.Meyer DE, Chilkoti A. Genetically encoded synthesis of protein-based polymers with precisely specified molecular weight and sequence by recursive directional ligation: examples from the elastin-like polypeptide system. Biomacromolecules. 2002;3(2):357–67. doi: 10.1021/bm015630n. [DOI] [PubMed] [Google Scholar]
- 25.Sun G, et al. Design and cellular internalization of genetically engineered polypeptide nanoparticles displaying adenovirus knob domain. J Control Release. 2011;155(2):218–26. doi: 10.1016/j.jconrel.2011.06.010. [DOI] [PMC free article] [PubMed] [Google Scholar]
- 26.Shi P, et al. Elastin-based protein polymer nanoparticles carrying drug at both corona and core suppress tumor growth in vivo. J Control Release. 2013 doi: 10.1016/j.jconrel.2013.05.013. [DOI] [PMC free article] [PubMed] [Google Scholar]
- 27.Dhandhukia J, et al. Switchable Elastin-Like Polypeptides that Respond to Chemical Inducers of Dimerization. Biomacromolecules. 2013 doi: 10.1021/bm301558q. [DOI] [PMC free article] [PubMed] [Google Scholar]
- 28.Aluri S, et al. Elastin-like peptide amphiphiles form nanofibers with tunable length. Biomacromolecules. 2012;13(9):2645–54. doi: 10.1021/bm300472y. [DOI] [PMC free article] [PubMed] [Google Scholar]
- 29.Wu K, et al. Altered expression of genes functioning in lipid homeostasis is associated with lipid deposition in NOD mouse lacrimal gland. Exp Eye Res. 2009;89(3):319–32. doi: 10.1016/j.exer.2009.03.020. [DOI] [PMC free article] [PubMed] [Google Scholar]
- 30.Carew JS, Kelly KR, Nawrocki ST. Mechanisms of mTOR inhibitor resistance in cancer therapy. Target Oncol. 2011;6(1):17–27. doi: 10.1007/s11523-011-0167-8. [DOI] [PubMed] [Google Scholar]
- 31.Fox RI, Kang HI. Pathogenesis of Sjogren’s syndrome. Rheum Dis Clin North Am. 1992;18(3):517–38. [PubMed] [Google Scholar]
- 32.Katsifis GE, Moutsopoulos NM, Wahl SM. T lymphocytes in Sjogren’s syndrome: contributors to and regulators of pathophysiology. Clin Rev Allergy Immunol. 2007;32(3):252–64. doi: 10.1007/s12016-007-8011-8. [DOI] [PubMed] [Google Scholar]
- 33.Carlson RP, et al. Effects of orally administered rapamycin in animal models of arthritis and other autoimmune diseases. Ann N Y Acad Sci. 1993;685:86–113. doi: 10.1111/j.1749-6632.1993.tb35855.x. [DOI] [PubMed] [Google Scholar]
- 34.Hayashi T. Dysfunction of lacrimal and salivary glands in Sjogren’s syndrome: nonimmunologic injury in preinflammatory phase and mouse model. J Biomed Biotechnol. 2011;2011:407031. doi: 10.1155/2011/407031. [DOI] [PMC free article] [PubMed] [Google Scholar]
- 35.Fernandez D, Perl A. mTOR signaling: a central pathway to pathogenesis in systemic lupus erythematosus? Discov Med. 2010;9(46):173–8. [PMC free article] [PubMed] [Google Scholar]
- 36.Pierdominici M, et al. Role of autophagy in immunity and autoimmunity, with a special focus on systemic lupus erythematosus. FASEB J. 2012;26(4):1400–12. doi: 10.1096/fj.11-194175. [DOI] [PubMed] [Google Scholar]
- 37.Sun G, et al. Design and cellular internalization of genetically engineered polypeptide nanoparticles displaying adenovirus knob domain. J Control Release. 2011;155(2):218–26. doi: 10.1016/j.jconrel.2011.06.010. [DOI] [PMC free article] [PubMed] [Google Scholar]
Associated Data
This section collects any data citations, data availability statements, or supplementary materials included in this article.