

Abstract
The formation of hepatocyte Mallory-Denk bodies (MDBs), which are aggregates of keratins 8 and 18 (K8/K18), ubiquitin, and the ubiquitin-binding protein p62, has a genetic predisposition component in humans and mice. We tested the hypothesis that metabolomic profiling of the MDB-susceptible C57BL and the MDB-resistant C3H mouse strains can illuminate MDB-associated pathways. Using both targeted and unbiased metabolomic analyses we demonstrated significant differences in intermediates of purine metabolism. Further analysis revealed that C3H and C57BL livers differ significantly in the mRNA level, protein expression, and enzymatic activity of the adenosine-generating enzyme ecto-5′-nucleotidase (CD73), which was significantly lower in C57BL livers. CD73 mRNA levels were also dramatically decreased in human liver biopsies from hepatitis C and non-alcoholic fatty liver disease patients. Feeding mice with a diet containing the MDB-inducing agent 3,5-diethoxycarbonyl-1,4-dihydrocollidine (DDC) significantly decreased CD73 protein and activity in C57BL livers and resulted in loss of plasma membrane CD73 expression and activity in isolated mouse hepatocytes. To further examine the role of CD73 in MDB formation in vivo, we fed wild-type and CD73−/− mice a DDC-containing diet. Liver enlargement, p62 induction, and disappearance of the K8/K18 cytoskeleton were attenuated in CD73−/− compared to wild-type livers. MDB formation, as assessed by biochemical and immunofluorescence detection of keratin and ubiquitin complexes, was also absent in CD73−/− mice. CONCLUSION: Purine metabolism and CD73 expression are linked to susceptibility to MDB formation in livers of different mouse strains. The expression of the adenosine-generating enzyme CD73 contributes to experimental MDB induction and is highly regulated in MDB-associated liver injury in mice and in chronic human liver disease.
Keywords: metabolomics, purines, adenosine, protein aggregation
Mallory-Denk bodies (MDBs) are intracellular aggregates of hepatocytes that contain the cytoskeletal intermediate filament proteins keratins 8 and 18 (K8/K18) as their major components, in addition to ubiquitin, and the ubiquitin-binding protein p62 (1). Crosslinking of keratins, particularly K8, by transglutaminase-2 (TG2) is critical for MDB formation (2, 3). MDBs are frequently observed alongside hepatocyte ballooning and loss of the cytoplasmic K8/K18 intermediate filament network (4). The livers of patients with alcoholic and non-alcoholic steatohepatitis most frequently display MDBs as part of their pathology (5), where MDB presence correlates with less favorable outcomes (6, 7). MDBs are also observed in the context of hepatocellular carcinoma, viral hepatitis, and some forms of drug-induced liver injury (1, 8). However, MDBs are not observed in all patients with the same liver disease (9, 10) and increases in their formation over time are associated with decompensation and progression to cirrhosis in patients with hepatitis C virus (HCV) infection (11). Identification of the factors that regulate or contribute to MDB formation may yield important insights into the general role of protein aggregation in liver disease pathogenesis.
Different strains of mice exhibit varying susceptibility to experimental MDB induction upon administration of the porphyrogenic compound 3,5-diethoxycarbonyl-1,4-dihydrocollidine (DDC) (12), a long-standing model reflective of the major biochemical and ultrastructural features of human MDBs (1). These strain differences are a useful paradigm for uncovering contributing factors to protein aggregation in hepatocytes, beyond the already known roles for protein misfolding and proteasomal inhibition (13, 14). Comparison of MDB-susceptible (C57BL) to MDB-resistant (C3H) mice at the proteomic level revealed major differences in the energy metabolizing and oxidative stress-sensitive enzymes glyceraldehyde-3-phosphate dehydrogenase (GAPDH) and nucleoside diphosphate kinase (NDPK) (15). Given the critical housekeeping functions of GAPDH in glycolysis and NDPK in nucleotide metabolism, we hypothesized that these two strains also exhibit differences in their liver metabolomes that may ultimately affect their response to liver injury caused by DDC.
In the present study we performed both targeted and unbiased metabolomic analyses to compare C3H and C57BL mouse livers, which ultimately led us to identify ecto-5′-nucleotidase (CD73) as a modulator of MDB formation in mouse liver. CD73 is a glycosyl phosphatidylinositol-linked membrane bound glycoprotein that catalyzes the phosphohydrolysis of adenosine 5′-monophosphate (AMP) to form adenosine (16). As the major source of extracellular adenosine, CD73 controls important physiological responses in inflammation, epithelial transport, tissue barrier function, and hypoxia, among others (16, 17). Based on in vivo data using CD73−/− mice, it was previously demonstrated that CD73 contributes to ethanol-induced liver steatosis (18) and thioacetamide- or carbon tetrachloride-induced liver fibrosis (19). Using ex vivo and in vivo approaches, we demonstrate that C3H and C57BL mice have differences in the expression and regulation of CD73 during liver injury and that CD73 contributes to MDB formation in mice.
Experimental Procedures
Antibodies
rat anti-CD73 (R&D Systems) for immunoblot; anti-CD73 (TY/23; BD Bioscience) for immunofluoresence staining; anti-K8 Troma I (Developmental Studies Hybridoma Bank); anti-K8/K18 rabbit antibody 8592 for immunofluorescence staining of mouse K8/K18 (20); anti-DDK (Flag) (Origene); mouse anti-Ub and goat anti-p62 (Santa Cruz Biotechnology); rabbit anti-transglutaminase-2 (Thermo Scientific) and rabbit anti-EEA1, -PDI, -RCAS1, and -LAMP1 (Cell Signaling) for immunostaining of organelle markers.
Quantitative PCR
RNA extraction, quantitative real time PCR, and data analysis were performed as described (15) using human and mouse gene-specific primers (Supplementary Table 1).
Human and animal liver experiments
The human liver specimens were biopsies from HCV and NAFLD patients collected at the University of Michigan under an approved Human Subjects protocol. Information on the pathology findings is provided in Supplementary Table 2. MDB induction experiments in C3H/He (C3H) and C57BL/6J (C57BL) mice were done as described (12). CD73−/− mice in a C57BL background (21) were provided by Dr. Linda Thompson (Oklahoma Medical Research Foundation). Age- and sex-matched wild-type (WT) C57BL and CD73−/− mice were used (2 control and 9 DDC-fed [4 animals for 3 weeks and 5 animals for 3 months]) in the DDC experiment that was performed as described (12). For metabolomic analysis (3 mice/strain), the mice were fasted for 5 hours, after which they were sacrificed and their livers rapidly excised and snap-frozen. The left liver lobe from each mouse was used in the metabolomic analysis (see below). All mice received humane care and their use was approved by and performed in accordance with the University Committee on Use and Care of Animals at the University of Michigan.
Metabolomics
The metabolomic analysis was performed at the Michigan Regional Comprehensive Metabolomics Resource Core. Pulverized mouse liver tissues were extracted with a methanol, acetone, and acetonitrile mixture (1:1:1). For liquid chromatography/mass spectrometry (LC/MS) analysis of metabolites, the samples were separated using an Agilent 1200 analytical HPLC on a Luna NH2 HILIC column followed by injection into the mass spectrometer (Agilent 6410 series triple quadrupole with electrospray ionization source), which was operated in negative mode. Data were processed by MassHunter workstation software, version B.04.
Preparation of tissue lysates and immunoblotting
Total liver homogenates were prepared by homogenizing tissues in 2X sample buffer (4% SDS, 10% 2-mercaptoethanol, 20% glycerol, 0.004% bromophenol blue, 0.125 M Tris-HCl, pH 6.8). Total lysates were used in immunoblots for TG2, p62, K8, and ubiquitin. For RIPA lysates (used in CD73 immunoblot and enzyme activity) the livers were homogenized in ice-cold RIPA buffer [150 mM sodium chloride, 1% NP-40, 0.5% sodium deoxycholate, 0.1% SDS (sodium dodecyl sulphate), 50 mM Tris, (pH 8)] with protease inhibitors. Lysates were resolved on gradient 4–20% SDS-PAGE gels, then transferred onto polyvinylidene difluoride membranes, which were subsequently blocked (5% milk in PBS, 0.1%-Tween-20) and incubated with the designated antibodies.
Biochemical measurement of CD73 enzymatic activity
CD73 activity was measured in mouse liver RIPA lysates using a kit (BQ Kits, San Diego, CA). The assay was based on a four-reaction sequence beginning with hydrolysis of 5′-inosine monophosphate to form inosine and ending with generation of a quinone dye from hydrogen peroxide (byproduct of uric acid synthesis), which was monitored spectophotometrically in a time-dependent manner. The assay’s specificity for CD73 under our experimental conditions was verified using CD73−/− liver lysate controls (Figure 4A).
Figure 4. Comparison of biochemical markers of liver injury in DDC-treated WT and CD73−/− mice.

A. Measurement of CD73 activity in livers from untreated and DDC-treated (3 months) WT and CD73−/− mice. B. CD73−/− mice had lower liver/body weight ratio after 3 months of DDC treatment relative to WT mice. ***P<0.001; Two-way ANOVA. C. Immunoblot analysis of p62 (MDB component) and transglutaminase-2 (TG2) in total liver lysates of WT and CD73−/− mice. D. Immunoblots of K8 and ubiquitin (Ub) from total liver lysates of WT and CD73−/− mice showing the presence of high molecular mass (HMM) K8 and Ub complexes in WT, but not CD73−/− mice after DDC treatment for 3 months.
CD73 enzyme histochemistry
CD73 activity in fixed hepatocytes and tissue sections (6μm) was done using a modified version of a published protocol (22). The cells and tissue sections were fixed in 10% neutral buffered formalin for 5 min at 4°C, rinsed in 0.1M Tris-maleate (TM) buffer, pH 7.2 then incubated in reaction medium (1h at 37°C). Reaction medium was prepared by first dissolving magnesium chloride (10mM) and lead nitrate (3.6mM) in TM buffer at 50°C until the solution became clear, then cooled to 37°C. Tissue non-specific alkaline phosphatase inhibitor (levamisole; 5mM) and substrate (AMP; 1mM) were added prior to the incubation. After incubation the reactions were stopped by several rinses with water, followed by 1min incubation in sodium sulfide (1% w/vol) and mounting in Prolong Gold reagent with DAPI.
Immunofluorescence staining and confocal imaging
After acetone fixation (10 min, −20°C), 6μm-thick tissue sections were stained as described (15). CD73 cDNA in pCMV6-Entry vector was purchased from Origene Technologies (Rockville, MD). Primary hepatocytes were isolated and transfected as described previously (15). Hepatocytes were transfected with CD73 for 24hr followed by a 24hr treatment with DDC (100μM), then fixed in methanol (10 min, −20°C) prior to immunostaining.
Results
Metabolomic analysis of livers from C3H and C57BL mice
We initially performed a targeted analysis for metabolic intermediates of glycolysis, tricarboxylic (TCA) cycle, and nucleotide metabolism in untreated C3H and C57BL mice (Table 1). Of the 21 metabolites assayed, adenosine triphosphate (ATP) and guanosine monophosphate (GMP) showed statistically significant differences (P<0.05). We also performed an unbiased analysis, which revealed differences in several amino acids, carbohydrates, vitamins, and lipids (Supplementary Table 3) in addition to nucleotide intermediates. Significant differences in the nucleobase adenine (C3H<C57BL) and the nucleoside inosine (C3H>C57BL) were observed (Figure 1A). Based on these findings we focused on the ATP branch of the purine metabolism pathway (Figure 1B) for further validation and mechanistic analysis.
Table 1.
Metabolomic comparison of nucleotides, glycolysis and TCA intermediates in C3H and C57BL livers
| C3H | C57BL | P value | |
|---|---|---|---|
| Metabolite | (nmol/mg liver tissue) | ||
| LAC | 4.7±0.2 | 3.4 ±0.9 | 0.23 |
| MAL | 0.0012 ±0.0002 | 0.0014 ±0.0003 | 0.56 |
| FUM | 0.12 ±0.06 | 0.16 ±0.03 | 0.56 |
| F6P/G6P | 0.20 ±0.01 | 0.20 ±0.02 | 1.00 |
| CIT/ICIT | 0.16 ±0.004 | 0.14 ±0.02 | 0.35 |
| Pyr | 0.21 ±0.01 | 0.19 ±0.02 | 0.43 |
| 2PG/3PG | 0.026 ±0.003 | 0.019 ±0.003 | 0.15 |
| aCoA | 0.021 ±0.006 | 0.020 ±0.004 | 0.91 |
| PEP | 0.0065 ±0.002 | 0.0032 ±0.0006 | 0.21 |
| FBP | 0.024 ±0.02 | 0.0056 ±0.004 | 0.32 |
| FAD | 0.068 ±0.002 | 0.068 ±0.002 | 0.87 |
| NAD | 0.32 ±0.004 | 0.36 ±0.02 | 0.16I |
| NADH | 0.32 ±0.01 | 0.37 ±0.02 | 0.08 |
| NADP | 0.052 ±0.005 | 0.056 ±0.003 | 0.46 |
| NADPH | 0.34 ±0.3 | 0.42 ±0.4 | 0.87 |
| AMP | 2.26 ±0.009 | 2.6 ±0.15 | 0.08 |
| ADP | 0.56 ±0.02 | 0.58 ±0.02 | 0.64 |
| ATP | 0.12 ±0.003 | 0.10 ±0.003* | 0.02 |
| GMP | 0.33 ±0.005 | 0.45 ±0.03* | 0.01 |
| GDP | 0.097 ±0.05 | 0.037 ±0.02 | 0.28 |
| GTP | 0.011 ±0.009 | 0.0037 ±0.003 | 0.46 |
Figure 1. Differences in substrates and enzymes of the purine metabolism pathway in C3H and C57BL livers.

A. Measurement of nucleotide metabolism intermediates using unbiased metabolomic analysis of the same C3H and C57BL livers as in Table 1 (n=3 livers/strain). *P<0.05, two-way ANOVA. B. Purine nucleotide metabolites and the corresponding enzymes involved in their synthesis and metabolism. The ecto-apyrase CD39 converts extracellular ATP to adenosine monophosphate (AMP), which is in turn converted to extracellular adenosine by the ecto-5′-nucleotidase CD73. Intracellular adenosine is converted to either adenine by purine nucleotide phosphorylase (PNP) or to inosine by adenosine deaminase (ADA). Adenine phosphoribosyltransferase (APRT) regenates AMP from adenine. PNP generates hypoxanthine from inosine, while xanthine oxidase (XO) generates xanthine and uric acid. C. Comparison of the mRNA levels purine nucleotide metabolism enzymes. C57BL liver mRNA values are expressed as fold change relative to C3H livers. *P<0.05,***P<0.001; unpaired t-test (C3H vs C57BL). DE. Measurement of CD73 mRNA levels in human HCV and NAFLD liver biopsies. Reference genes IFNG and CXCL10 (HCV) and FABP4 and COL1A1 (NAFLD) are shown as positive controls. Values are expressed as fold change (log scale) over normal liver biopsies (2 controls).
We asked whether the two strains have differences in the expression of enzymes involved in purine nucleotide synthesis, metabolism, and salvage. Although there are numerous enzymes that can exert control over these pathways, the major ones are depicted in the simplified schematic shown in Figure 1B. Comparison of mRNA levels showed significantly lower levels of CD73 and PNP in C57BL livers (Figure 1C). Since CD73 is upstream of PNP and its mRNA in C57BL livers is only 25% of C3H livers, we chose to study it in more detail. Importantly, we found a striking decrease (<20% of contro) in CD73 mRNA in human liver biopsies from patients with fibrosis due to hepatitis C (HCV) infection or non-alcoholic fatty liver disease (NAFLD) (Figure 1D–E). This was in stark contrast to the increases in reference genes: interferon-gamma (IFNG) and C-X-C motif chemokine 10 (CXCL10) in HCV (23) and fatty acid binding protein and collagen 1a1 in NAFLD (24).
CD73 mRNA and protein are markedly higher in C3H compared to C57BL livers
Quantitative CD73 mRNA assessment revealed dramatically lower levels in C57BL livers (Figure 2A), which was reflected in isolated hepatocytes (Figure 2B) and paralleled by the protein levels in C57BL (but not C3H) livers, as assessed by immunoblot of liver lysates (Figure 2C) and immunofluorescence analysis of liver sections (Figure 2D). Further, DDC diminished the CD73 activity in C3H and C57BL livers as measured by enzyme histochemistry and compared to CD73−/− livers as a control (Figure 2E). Prominent porphyria was evident in both strains after DDC treatment (Figure 2E; dark deposits highlighted by arrows). The increase in CD73 mRNA in C3H DDC livers without an increase at the protein/activity levels may be related to translational control or antibody reactivity masking.
Figure 2. Significantly decreased expression and activity of CD73 in C57BL mouse liver after DDC treatment.

A. Measurement of CD73 mRNA in C3H and C57BL livers from untreated (control) and DDC-treated (3 months) mice. Values are expressed as fold difference from C3H control livers. **P<0.01; ***P<0.001; two-way ANOVA. B. Measurement of CD73 mRNA in isolated hepatocytes from C3H and C57BL mice. ***P<0.001; unpaired t-test. C. CD73 Immunoblot of liver lysates from C3H and C57BL livers from untreated (control) and DDC-treated (3 months) mice. Relative expression values are averaged for the 3 control and 4 DDC livers per strain and normalized to C3H control livers. D. Immunofluorescence detection of CD73 protein (green) with DAPI nuclei (blue) in C3H and C57BL livers from control and DDC-treated (3 months) mice. Scale bar=50μm. E. AMPase activity in control and DDC-treated (3 months) C3H and C57BL livers. A loss of CD73 enzymatic activity and protoporphyrin accumulation (arrows highlight porphyrin deposits) are observed after DDC treatment. The CD73−/− AMPase activity is shown together with the corresponding DAPI-stained nuclei as a negative control. Scale bar=100μm.
CD73 protein expression was lost in isolated hepatocytes as early as 1 hour post-isolation (Figure 3A) and it was still absent at 48 hours post-isolation (not shown), regardless of the mouse strain. Therefore, to study the effects of DDC on CD73 ex vivo, we transfected C57BL hepatocytes with the cDNA of flag-tagged mouse CD73. After transfection we detected a CD73 monomer (~68kD); and a dimer (~140 kD) (Figure 3B), as expected, since endogenous CD73 exists as a dimer on the plasma membrane (25). The ectopically-expressed CD73 exhibited both plasma membrane and intracellular localization under normal conditions (Figure 3C, left panel) and was enzymatically-active (Figure 3D). However, upon DDC treatment CD73 was lost from the plasma membrane and accumulated in intracellular granules (Figure 3C, right panel). Co-staining with different organelle markers revealed partial co-localization with resident proteins of the endoplasmic reticulum, Golgi, and early endosomes, but not lysozomes (Supplementary Figure 1), suggesting that the ability of CD73 to proceed along the secretory pathway may be compromised in the presence of DDC. Further, there was a complete loss of hepatocyte CD73 activity after DDC treatment (Figure 3E), reflecting the in vivo data.
Figure 3. DDC modulates CD73 localization in primary mouse hepatocytes.

A. Immunofluorescence detection of endogenous CD73 protein (red), which is largely lost in freshly-isolated hepatocytes (1hr post-isolation). Blue=DAPI-stained nuclei. Scale bar=50μm. B. Flag immunoblot detection of CD73 monomer (68kD) and dimer (~140 kD) after expression of flag-tagged mouse CD73 in hepatocytes using. C. Loss of plasma membrane CD73 (green) after DDC treatment (100μM for 24 hr) of primary hepatocytes. Blue=DAPI-stained nuclei. Scale bars=20μm. D. AMPase activity in control and Flag-CD73-transfected hepatocytes showing that over-expressed CD73 is enzymatically-active. Blue=DAPI-stained nuclei. Lower-right two panels represent a magnified view of the area demarcated by a white dotted line in the lower-left panel. Arrows point out plasma membrane-associated AMPase activity. Scale bar=200μm. E. AMPase activity in Flag-CD73-transfected hepatocytes that were treated with DMSO vehicle or 100μM DDC for 24h showing DDC-induced inhibition of CD73 enzymatic activity. Blue=DAPI-stained nuclei. Scale bar=200μm.
Comparison of DDC-induced MDB formation in wild-type and CD73−/− mice
We assessed the effect of 3 week and 3 month DDC feeding in WT C57BL (referred to as WT hereafter) and CD73−/− (in C57BL background) mice. DDC decreased CD73 activity in WT mice by ~60% as measured in the detergent-soluble liver fractions using a biochemical approach, described in Methods (Figure 4A). Serum ALT levels after DDC were similarly elevated in WT and CD73−/− mice (Supplementary Figure 2A). WT mice exhibited a time-dependent increase in their liver/body weight ratios (Figure 4B), a well-established effect of DDC feeding that is due to a combination of factors, such as hepatocyte ballooning, ductular reaction, and porphyria (3, 26). Although liver enlargement also occurred in DDC-treated CD73−/− mice, it was significantly less than WT mice after 3 months of DDC feeding (Figure 4B). There were lower levels of the ubiquitin-binding (and MDB component) protein p62 in CD73−/− livers after 3 months of DDC feeding (Figure 4C). We found no evidence of CD73 and p62 co-localization in DDC-treated livers (Supplementary Figure 2B). Transglutaminase-2 was significantly upregulated in both WT and CD73−/− mice (Figure 4C) in response to injury. The limited p62 induction in CD73−/− livers after DDC feeding suggested that they may exhibit fewer MDBs compared to WT mice. This was confirmed biochemically (Figure 4D) by immunoblot analysis for high-molecular-mass K8 and ubiquitin complexes that migrate near the top of the gel and represent crosslinked K8 and ubiquitin-containing species (3). These complexes were present in WT, but largely absent from CD73−/− livers (Figure 4D).
Ballooning degeneration in hepatocytes occurs with concomitant loss of the K8/K18 cytoskeleton (4). There were no significant differences in K8/K18 between untreated CD73−/− mice compared to untreated WT mice (Supplementary Figure 2C). On the other hand, after DDC treatment there is a significant loss of the K8/K18 filament network in WT livers, but not in CD73−/− livers (Figure 5A). Histological analysis showed that, while both WT and CD73−/− mice displayed a significant response to DDC, including porphyria, hypertrophy and bile stasis, there was significantly more cellular ballooning and steatosis present in the WT compared to the KO livers (Figure 5B and Supplementary Figure 2D). Further, MDBs were only seen in the WT livers (Figure 5B, arrows). Since only large MDBs are seen by H&E staining (1), we asked whether the CD73−/− livers form smaller MDBs, only seen after immunofluorescence analysis of keratin and ubiquitin-containing aggregates. As shown by the representative data in Figure 6, such aggregates were only present in WT, but not CD73−/− livers (Figure 6). Combined, these data demonstrate that CD73 is an important mouse strain-related modulator of MDB formation.
Figure 5. Comparison of DDC-induced liver injury in WT and CD73−/− mice.
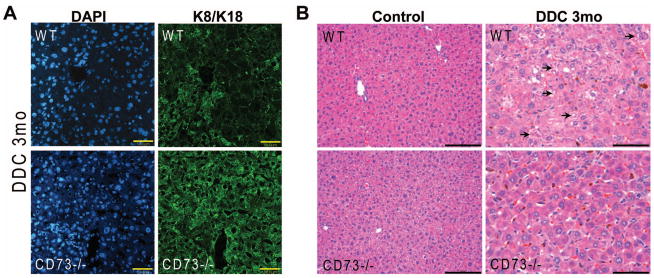
A. Immunofluorescence staining for K8/K18 (green) and DAPI nuclei (blue) shows that the K8/K18 filament network is preserved in CD73−/− mouse livers relative to WT livers after DDC treatment for 3 months. Scale bars=50μm. B. Hematoxylin and eosin staining shows more prominent steatosis, cellular ballooning, and MDBs (marked by arrows) in WT relative to CD73−/− mice. Results are representative from 3 separate WT and 4 CD73−/− mouse livers. Scale bars=100μm (control); 50μm (DDC).
Figure 6. Immunofluorescence analysis of MDBs in livers from WT and CD73−/− mice.

Freshly frozen tissue sections from control and DDC-treated (3 months) WT and C57BL mice were stained with antibodies against K8/K18 (red) and ubiquitin (green). MDBs (marked by arrows) are only present in WT livers after DDC treatment. Shown are representative results from three separate WT and four CD73−/− mouse livers.
Discussion
We initiated our present study with a global approach to examine differences in metabolic pathways between MDB-susceptible and MDB-resistant mice. The results from the metabolomic assessment led us to focus on the purine metabolism pathway, from which we identified the ectonucleotidase CD73 as a promoting factor for MDB formation in mice.
Our findings coincide with recent studies highlighting a role for CD73 in liver pathophysiology. In mouse models of liver fibrosis triggered by thioacetamide or carbon tetrachloride (CCl4), the absence of CD73 is protective (19). On the other hand, it was previously shown that CCl4-induced liver damage and concanavalin A-induced liver injury and release of pro-inflammatory cytokines were exacerbated in adenosine receptor 2A-deficient mice (27). In further support of a pro-fibrogenic role of CD73 in mouse liver, CD73 is transcriptionally upregulated in activated hepatic stellate cells during myofibroblast differentiation (28). However, in our present findings we show that CD73 mRNA is dramatically decreased in fibrotic human livers (regardless of etiology or fibrosis severity). Potential CD73 expression changes during various stages of human disease progression that are not always reflected in experimental models and presence of other factors, such as inflammation and steatosis, may be behind these observations. CD73 activity and adenosine receptor activation have also been implicated in ethanol-induced hepatic steatosis in mice (18). Specifically, CD73−/− mice are protected from developing fatty liver (18). Given that MDBs are commonly observed in steatohepatitis (1, 14), our findings that CD73−/− mice have less steatosis and are protected from MDBs align with these previous studies.
While our data demonstrate a role for CD73 in MDB formation, the use of the full body CD73 knockout does not allow us to discern whether this involves a hepatocyte-intrinsic mechanism or is influenced by CD73 on other cells (e.g. immune, endothelial). CD73 is expressed on multiple cell types, including leukocytes, myofibroblasts, endothelial, and epithelial cells (16, 28). A previous study using ferritin immunoelectron microscopy compared the expression and plasma membrane distribution of CD73 in endothelial cells and hepatocytes in rat liver (29). This study found that the bile canalicular surface of hepatocytes had approximately 4-fold higher density of CD73 relative to the sinusoidal surface (29), which might be expected for a glycosyl phosphatidylinositol-anchored protein (17). Relative to hepatocytes, endothelial cells were estimated to have approximately 60% fewer CD73 molecules (29).
Given the direct effects of DDC on CD73 localization, we posit that at least some of the in vivo findings are directly attributable to hepatocyte CD73. A previous study estimated that only 48% of hepatocyte CD73 activity is on the cell surface, in contrast to 75–79% of the CD73 activity in adipocytes and lymphocyte being accounted for by the cell surface-localized enzyme (30). The intracellular CD73 fraction is membrane associated and enzymatically active, but latent (available to substrate only upon cell breakage) and the exact organelle compartments that host intracellular CD73 are unclear (30). There is dynamic cycling of the intracellular CD73 pool to the plasma membrane, but only a small fraction (~3%) of it is thought to be lysosomal (31). If and how the cellular distribution of CD73 in hepatocytes affects intracellular protein aggregation remains to be investigated.
Protein aggregation is a common disease mechanism for multiple organ pathologies and is characterized by protein misfolding and proteasomal inhibition. Uncovering molecular modulators that regulate protein aggregation will not only provide insight into potential tissue- and cell-type specific pathways, but may also shed light on individual susceptibility to intracellular inclusions. To our knowledge, this is the first report that alterations in purine metabolism and CD73 activity act as modulators of protein aggregation. Given the widespread expression and functional significance of CD73 (16), these findings may hold true in other tissues and cell types. Furthermore, our findings point to dramatic differences in CD73 mRNA and protein levels between two different mouse strains. It would be relevant to determine if differences in CD73 expression are also present in genetically-diverse human populations and if CD73 contributes to human MDB formation or susceptibility to liver disease.
Supplementary Material
Supplementary Figure 1. CD73 localization in hepatocytes after DDC treatment. Immunofluorescence analysis of Flag-CD73 (green) and different organelle markers (red) in DDC-treated hepatocytes.
Supplementary Figure 2. A. Serum analysis for ALT levels in control and DDC-treated WT and CD73−/− mice. B. Liver sections from C3H mice after 3 months DDC treatment were stained with antibodies to CD73 (green) and p62 (red). There is no significant co-localization between the two signals. Scale bars=50μm. C. Liver sections from WT and CD73−/− mice were stained with the designated antibodies. The K8/K18 filament organization is similar between WT and CD73−/− mice under basal conditions. Scale bar=50μm. D. Extensive porphyria (dark brown deposits marked by arrows) is observed in WT and CD73−/− mice after DDC treatment. Also shown is K8/K18 immunofluorescence (red) of the sections. Scale bar=100μm.
Acknowledgments
The authors thank Dr. Linda Thompson for critical reading of the manuscript.
Financial Support: National Institutes of Health grants R01 DK52951 (M.B.O.) and K01 DK093776 (N.T.S.). This work utilized Core Services supported by grants DK089503 and DK034933 to the University of Michigan.
Abbreviations
- AMP
adenosine monophosphate
- DDC
3,5-diethoxycarbonyl-1,4-dihydrocollidine
- K8
keratin 8
- MDB
Mallory-Denk body
- qPCR
quantitative real time PCR
- TG2
transglutaminase-2
References
- 1.Zatloukal K, French SW, Stumptner C, Strnad P, Harada M, Toivola DM, Cadrin M, et al. From Mallory to Mallory-Denk bodies: what, how and why? Exp Cell Res. 2007;313:2033–2049. doi: 10.1016/j.yexcr.2007.04.024. [DOI] [PubMed] [Google Scholar]
- 2.Zatloukal K, Fesus L, Denk H, Tarcsa E, Spurej G, Bock G. High amount of epsilon-(gamma-glutamyl)lysine cross-links in Mallory bodies. Lab Invest. 1992;66:774–777. [PubMed] [Google Scholar]
- 3.Strnad P, Harada M, Siegel M, Terkeltaub RA, Graham RM, Khosla C, Omary MB. Transglutaminase 2 regulates mallory body inclusion formation and injury-associated liver enlargement. Gastroenterology. 2007;132:1515–1526. doi: 10.1053/j.gastro.2007.02.020. [DOI] [PubMed] [Google Scholar]
- 4.Lackner C, Gogg-Kamerer M, Zatloukal K, Stumptner C, Brunt EM, Denk H. Ballooned hepatocytes in steatohepatitis: the value of keratin immunohistochemistry for diagnosis. J Hepatol. 2008;48:821–828. doi: 10.1016/j.jhep.2008.01.026. [DOI] [PubMed] [Google Scholar]
- 5.Kleiner DE, Brunt EM. Nonalcoholic fatty liver disease: pathologic patterns and biopsy evaluation in clinical research. Semin Liver Dis. 2012;32:3–13. doi: 10.1055/s-0032-1306421. [DOI] [PubMed] [Google Scholar]
- 6.Cortez-Pinto H, Baptista A, Camilo ME, De Moura MC. Nonalcoholic steatohepatitis--a long-term follow-up study: comparison with alcoholic hepatitis in ambulatory and hospitalized patients. Dig Dis Sci. 2003;48:1909–1913. doi: 10.1023/a:1026152415917. [DOI] [PubMed] [Google Scholar]
- 7.Gramlich T, Kleiner DE, McCullough AJ, Matteoni CA, Boparai N, Younossi ZM. Pathologic features associated with fibrosis in nonalcoholic fatty liver disease. Hum Pathol. 2004;35:196–199. doi: 10.1016/j.humpath.2003.09.018. [DOI] [PubMed] [Google Scholar]
- 8.Molnar A, Haybaeck J, Lackner C, Strnad P. The cytoskeleton in nonalcoholic steatohepatitis: 100 years old but still youthful. Expert Rev Gastroenterol Hepatol. 2011;5:167–177. doi: 10.1586/egh.11.5. [DOI] [PubMed] [Google Scholar]
- 9.Gerber MA, Orr W, Denk H, Schaffner F, Popper H. Hepatocellular hyalin in cholestasis and cirrhosis: its diagnostic significance. Gastroenterology. 1973;64:89–98. [PubMed] [Google Scholar]
- 10.Fleming KA, McGee JO. Alcohol induced liver disease. J Clin Pathol. 1984;37:721–733. doi: 10.1136/jcp.37.7.721. [DOI] [PMC free article] [PubMed] [Google Scholar]
- 11.Rakoski MO, Brown MB, Fontana RJ, Bonkovsky HL, Brunt EM, Goodman ZD, Lok AS, et al. Mallory-Denk bodies are associated with outcomes and histologic features in patients with chronic hepatitis C. Clin Gastroenterol Hepatol. 2011;9:902–909. e901. doi: 10.1016/j.cgh.2011.07.006. [DOI] [PMC free article] [PubMed] [Google Scholar]
- 12.Hanada S, Strnad P, Brunt EM, Omary MB. The genetic background modulates susceptibility to mouse liver Mallory-Denk body formation and liver injury. Hepatology. 2008;48:943–952. doi: 10.1002/hep.22436. [DOI] [PubMed] [Google Scholar]
- 13.Omary MB, Ku NO, Strnad P, Hanada S. Toward unraveling the complexity of simple epithelial keratins in human disease. J Clin Invest. 2009;119:1794–1805. doi: 10.1172/JCI37762. [DOI] [PMC free article] [PubMed] [Google Scholar]
- 14.Strnad P, Zatloukal K, Stumptner C, Kulaksiz H, Denk H. Mallory-Denk-bodies: lessons from keratin-containing hepatic inclusion bodies. Biochim Biophys Acta. 2008;1782:764–774. doi: 10.1016/j.bbadis.2008.08.008. [DOI] [PubMed] [Google Scholar]
- 15.Snider NT, Weerasinghe SV, Singla A, Leonard JM, Hanada S, Andrews PC, Lok AS, et al. Energy determinants GAPDH and NDPK act as genetic modifiers for hepatocyte inclusion formation. J Cell Biol. 2011;195:217–229. doi: 10.1083/jcb.201102142. [DOI] [PMC free article] [PubMed] [Google Scholar]
- 16.Colgan SP, Eltzschig HK, Eckle T, Thompson LF. Physiological roles for ecto-5′-nucleotidase (CD73) Purinergic Signal. 2006;2:351–360. doi: 10.1007/s11302-005-5302-5. [DOI] [PMC free article] [PubMed] [Google Scholar]
- 17.Resta R, Yamashita Y, Thompson LF. Ecto-enzyme and signaling functions of lymphocyte CD73. Immunol Rev. 1998;161:95–109. doi: 10.1111/j.1600-065x.1998.tb01574.x. [DOI] [PubMed] [Google Scholar]
- 18.Peng Z, Borea PA, Varani K, Wilder T, Yee H, Chiriboga L, Blackburn MR, et al. Adenosine signaling contributes to ethanol-induced fatty liver in mice. J Clin Invest. 2009;119:582–594. doi: 10.1172/JCI37409. [DOI] [PMC free article] [PubMed] [Google Scholar]
- 19.Peng Z, Fernandez P, Wilder T, Yee H, Chiriboga L, Chan ES, Cronstein BN. Ecto-5′-nucleotidase (CD73) -mediated extracellular adenosine production plays a critical role in hepatic fibrosis. FASEB J. 2008;22:2263–2272. doi: 10.1096/fj.07-100685. [DOI] [PubMed] [Google Scholar]
- 20.Ku NO, Michie S, Oshima RG, Omary MB. Chronic hepatitis, hepatocyte fragility, and increased soluble phosphoglycokeratins in transgenic mice expressing a keratin 18 conserved arginine mutant. J Cell Biol. 1995;131:1303–1314. doi: 10.1083/jcb.131.5.1303. [DOI] [PMC free article] [PubMed] [Google Scholar]
- 21.Thompson LF, Eltzschig HK, Ibla JC, Van De Wiele CJ, Resta R, Morote-Garcia JC, Colgan SP. Crucial role for ecto-5′-nucleotidase (CD73) in vascular leakage during hypoxia. J Exp Med. 2004;200:1395–1405. doi: 10.1084/jem.20040915. [DOI] [PMC free article] [PubMed] [Google Scholar]
- 22.Frederiks WM, Marx F. A quantitative histochemical study of 5′-nucleotidase activity in rat liver using the lead salt method and polyvinyl alcohol. Histochem J. 1988;20:207–214. doi: 10.1007/BF01747465. [DOI] [PubMed] [Google Scholar]
- 23.Bieche I, Asselah T, Laurendeau I, Vidaud D, Degot C, Paradis V, Bedossa P, et al. Molecular profiling of early stage liver fibrosis in patients with chronic hepatitis C virus infection. Virology. 2005;332:130–144. doi: 10.1016/j.virol.2004.11.009. [DOI] [PubMed] [Google Scholar]
- 24.Greco D, Kotronen A, Westerbacka J, Puig O, Arkkila P, Kiviluoto T, Laitinen S, et al. Gene expression in human NAFLD. Am J Physiol Gastrointest Liver Physiol. 2008;294:G1281–1287. doi: 10.1152/ajpgi.00074.2008. [DOI] [PubMed] [Google Scholar]
- 25.Heuts DP, Weissenborn MJ, Olkhov RV, Shaw AM, Gummadova J, Levy C, Scrutton NS. Crystal structure of a soluble form of human CD73 with ecto-5′-nucleotidase activity. Chembiochem. 2012;13:2384–2391. doi: 10.1002/cbic.201200426. [DOI] [PubMed] [Google Scholar]
- 26.Hanada S, Snider NT, Brunt EM, Hollenberg PF, Omary MB. Gender dimorphic formation of mouse Mallory-Denk bodies and the role of xenobiotic metabolism and oxidative stress. Gastroenterology. 2010;138:1607–1617. doi: 10.1053/j.gastro.2009.12.055. [DOI] [PMC free article] [PubMed] [Google Scholar]
- 27.Ohta A, Sitkovsky M. Role of G-protein-coupled adenosine receptors in downregulation of inflammation and protection from tissue damage. Nature. 2001;414:916–920. doi: 10.1038/414916a. [DOI] [PubMed] [Google Scholar]
- 28.Fausther M, Sheung N, Saiman Y, Bansal MB, Dranoff JA. Activated hepatic stellate cells upregulate transcription of ecto-5′-nucleotidase/CD73 via specific SP1 and SMAD promoter elements. Am J Physiol Gastrointest Liver Physiol. 2012;303:G904–914. doi: 10.1152/ajpgi.00015.2012. [DOI] [PMC free article] [PubMed] [Google Scholar]
- 29.Matsuura S, Eto S, Kato K, Tashiro Y. Ferritin immunoelectron microscopic localization of 5′-nucleotidase on rat liver cell surface. J Cell Biol. 1984;99:166–173. doi: 10.1083/jcb.99.1.166. [DOI] [PMC free article] [PubMed] [Google Scholar]
- 30.Stanley KK, Edwards MR, Luzio JP. Subcellular distribution and movement of 5′-nucleotidase in rat cells. Biochem J. 1980;186:59–69. doi: 10.1042/bj1860059. [DOI] [PMC free article] [PubMed] [Google Scholar]
- 31.Maguire GA, Luzio JP. The presence and orientation of ecto-5′-nucleotidase in rat liver lysosomes. FEBS Lett. 1985;180:122–126. doi: 10.1016/0014-5793(85)80244-1. [DOI] [PubMed] [Google Scholar]
Associated Data
This section collects any data citations, data availability statements, or supplementary materials included in this article.
Supplementary Materials
Supplementary Figure 1. CD73 localization in hepatocytes after DDC treatment. Immunofluorescence analysis of Flag-CD73 (green) and different organelle markers (red) in DDC-treated hepatocytes.
Supplementary Figure 2. A. Serum analysis for ALT levels in control and DDC-treated WT and CD73−/− mice. B. Liver sections from C3H mice after 3 months DDC treatment were stained with antibodies to CD73 (green) and p62 (red). There is no significant co-localization between the two signals. Scale bars=50μm. C. Liver sections from WT and CD73−/− mice were stained with the designated antibodies. The K8/K18 filament organization is similar between WT and CD73−/− mice under basal conditions. Scale bar=50μm. D. Extensive porphyria (dark brown deposits marked by arrows) is observed in WT and CD73−/− mice after DDC treatment. Also shown is K8/K18 immunofluorescence (red) of the sections. Scale bar=100μm.