

Abstract
We wished to determine whether decreases in N-acetyl aspartate (NAA) and increases in myoinositol (mI) concentrations as a ratio of creatine (Cr) occurred in the dorsolateral prefrontal cortex (DLPFC) of pediatric offspring of parents with bipolar disorder (BD) and a healthy comparison group (HC) over a 5 year period using proton magnetic resonance spectroscopy (1H-MRS). Sixty-four youth (9–18 years old) of parents with BD (36 with established BD, and 28 offspring with symptoms subsyndromal to mania) and 28 HCs were examined for group differences in NAA/Cr and mI/Cr in the DLPFC at baseline and follow-up at either 8, 10, 12, 52, 104, 156, 208, or 260 weeks. No significant group differences were found in metabolite concentrations at baseline or over time. At baseline, BD offspring had trends for higher mI/Cr concentrations in the right DLPFC than the HC group. mI/Cr concentrations increased with age, but no statistically significant group differences were found between groups on follow up. It may be the case that with intervention, youth at risk for BD are normalizing otherwise potentially aberrant neurochemical trajectories in the dorsolateral prefrontal cortex. A longer period of follow up may be required before observing any group differences.
Keywords: N-acetylaspartate, myoinositol, bipolar, offspring, longitudinal
1. Introduction
Cross-sectional studies using proton magnetic resonance spectroscopy (1H-MRS) in children, adolescents and adults with bipolar disorder (BD) have demonstrated relative decreases in N-acetyl aspartate (NAA) and increases in myoinositol (mI) compared to healthy controls in the dorsolateral prefrontal cortex (DLPFC), a region of the brain known to be involved in a variety of cognitive functions including emotion regulation (Caetano et al., 2011; Cecil et al., 2003; Chang et al., 2003; Gallelli et al. 2005; Frey et al., 2005; Patel et al., 2006; Yildez-Yesiloglu and Ankerst, 2006). However, these findings are inconsistent, and sensitive to mood state (Patel et al., 2008a) and other illness related features such as rapid cycling (Michael et al., 2009). Moreover, it remains unclear whether these neurochemical changes occur prior to the onset of mania, representing potential early risk factors for the development or progression of BD (McGrath et al., 2006).
A longitudinal study design that involves repeated observations of the same individuals over time permits investigation of certain predictors of disease. This approach is particularly useful in a disorder that is chronic and episodic, with variable intervals and combinations of high and low moods. One prior study of nine adults with BD prospectively examined neurochemical levels in the basal ganglia, anterior cingulate, and prefrontal cortices, and found differential neurochemical distributions in these regions during hypomanic versus euthymic mood states (Malhi et al., 2007). Another more recent study examined lactate concentrations in the anterior cingulate and parieto-occipital cortices longitudinally across manic followed by euthymic mood states in fifteen adults with bipolar I disorder (Brady et al., 2012). In seven of these adults with BD who returned for follow-up on average 21 months later during euthymia, lactate levels were found to be comparable to healthy controls during mania but significantly reduced during euthymia, suggesting mood-state associated perturbations in brain energy metabolism. In combination, these studies underscore the importance of a longitudinal approach in the context of a long-term phasic illness. However, such studies in adults cannot exclude the possibility that state-dependent changes in neurometabolites are due to the neurochemical effects of chronic mood symptoms or prolonged exposure to medications. Moreover, neither went beyond examination of two mood states or preceded illness onset to determine whether alterations in neurometabolites might be present before the first manic episode and represent a vulnerability factor that plays a role in the development of BD. Such a finding would be critical not only in elucidating antecedents of the onset of BD, but in developing effective approaches to the prevention of this disorder as well.
It is clear that in order to determine the earliest biological risk factors for the development of BD, neurometabolites need to be assessed in individuals before they experience their first mood episode. Children at familial risk for BD who have a biological parent with BD but themselves have not yet experienced a full spontaneous manic episode are particularly good candidates for this type of study. Unfortunately, prior cross-sectional MRS studies of youth at familial risk for BD (“bipolar offspring”) have shown conflicting results that might be better understood if neurochemical sampling was done at several time points in individuals at risk for BD. For example, NAA, which is a healthy nerve cell marker putatively involved in maintaining fluid balance, energy production, and myelin formation in the brain, has been observed to be decreased in the DLPFC in pediatric high-risk offspring with mania (Chang et al., 2003), suggesting neurodegenerative changes coincident with the presence of mania. However, further comparisons of NAA levels in bilateral DLPFC in high-risk offspring, either without or with recent onset mania, found no statistically significant decrements in NAA, suggesting that decrements of NAA in the DLPFC may not be seen until many years after a manic episode (Gallelli et al., 2005). Another study involving mood symptomatic offspring of parents with BD demonstrated increased orbitofrontal mI, which is a marker for cellular metabolism and related second messenger signaling pathways (Cecil et al., 2003). However, abnormalities in mI or other metabolite concentrations have not been replicated in other studies of symptomatic offspring at high-risk for BD (Gallelli et al., 2005; Hajek et al., 2008). Diagnostic and developmental heterogeneity, mood state at the time of scan, partial volumes of grey and white matter in the region of interest, and other demographic variables may account for inconsistencies across studies. These conflicting results may also be due to the use of lower than 3T field strength magnets, type 2 error from using small sample sizes, or not permitting a long enough interval between measurements to observe significant change.
In the current study, we sought to understand whether specific neurochemical factors predicted the progression of mood symptomatology, in a cohort with a high familial predisposition for BD. Using a prospective group comparison design, we examined concentrations of NAA and mI as a ratio of creatine-phosphocreatine (Cr) in the right and left dorsolateral prefrontal cortex (DLPFC) by 1H-MRS in sixty-four symptomatic bipolar offspring and twenty-eight healthy offspring of psychiatrically well parents over a five year period coincident with clinical follow up for progression of mood symptoms. Based on prior studies, we hypothesized that symptomatic bipolar offspring would demonstrate larger decreases in NAA/Cr and increases in mI/Cr in the DLPFC than healthy comparison subjects over time. Mood state versus trait related changes were assessed by associating metabolite changes to a clinical change variable assessing manic and depressive mood states at baseline and at follow-up.
2. Methods
2.1 Subjects
The university panel of medical research in human subjects approved this research protocol. After complete description of the study to the subjects and their parents, written informed consent was obtained from the parents, and written assent was obtained from the children. Sixty-four children, 9–18 years old, having a parent with either bipolar I or II disorder (N= 36 with fully syndromal mania, “BD,” and N=28 with subsyndromal symptoms but no mania, “SS”), were recruited from ongoing studies of high-risk offspring in a pediatric bipolar disorders program and from the community. Control children of parents without any DSM-IV Axis I disorder with comparable age, Tanner stage, race, sex, socioeconomic status and handedness were recruited for study participation from community advertisements and local schools (HC, N=28). All participants were evaluated for psychiatric disorders by semi-structured interviews during each scan time point either at 8, 10, 12, 52, 104, 156, 208, or 260 weeks. The Structured Clinical Interview for DSM-IV (SCID-P) (First et al., 1996), was administered to all parents by raters blind to diagnostic group and with established symptom and diagnostic inter-rater reliability (kappa>0.9). All children were evaluated for lifetime psychiatric diagnoses using the Affective and Psychotic Modules of the Washington University in St. Louis Kiddie-Schedule for Affective Disorders and Schizophrenia (WASH-U KSADS) (Geller et al., 1996) and the Kiddie Schedule of Affective Disorders and Schizophrenia Present and Lifetime version (KSADS-PL) (Kaufman et al., 1997), administered separately to parents and children by raters blind to diagnostic group and with established symptom and diagnostic reliability (kappa>0.9) (Gallelli et al., 2005). Diagnostic decisions were ultimately made by a child psychiatrist (K.C.) by personal interview or by discussion with a masters-level research assistant. Current and lifetime diagnoses, onsets and offsets of manic and hypomanic episodes were established using DSM-IV criteria. Parents with BD were euthymic at the time of their own and their child’s interview.
Longitudinal clinical assessments with serial WASH-U KSADS interviews at each scan time point yielded symptom severity measures in the high-risk cohort. In order to quantify clinical progression of manic, depressive, and overall symptomatology, a clinical change variable (CCV) was generated using DSM-IV criteria rated during the WASH-U KSADS interviews. This variable was calculated by summing the scores (0–6) of items from the mania and depression sections of the WASH-U KSADS completed at each scan time point, which comprise DSM-IV-TR criteria for mania and major depression, and then subtracting the follow-up score from the baseline score. Symptom ratings captured periods in which patients reported high levels of mania or depression during the six months prior to assessment.
In addition to a parental BD diagnosis, subjects included in the pediatric BD group (BD) required a diagnosis of bipolar I or II disorder by the WASH-U-KSADS. For inclusion in the subsyndromal group (SS), children met criteria for moderate mood dysfunction by a score of >10 on the Young Mania Rating Scale (YMRS) (Young et al., 1978) or a score of >29 on the Children’s Depressive Rating Scale-Revised (CDRS-R) (Poznanski et al., 1979), but did not meet symptom duration or severity criteria for a fully syndromal manic episode, either at the time of assessment or historically. Subjects in the SS group received a diagnosis of bipolar disorder–not otherwise specified (BD-NOS) if they were missing only one DSM-IV-TR criterion for mania or had all criteria but only had 2 to 4 days of episode duration (Birmaher et al., 2006; Chang et al., 2006) and did not have a concurrent diagnosis of major depression. The control group was comprised of healthy volunteers with no DSM-IV psychiatric diagnosis, psychotropic medication exposure, parent with any psychiatric diagnosis by SCID, and no first- or second-degree relative with BD as assessed by the Family History Research Diagnostic Criteria (Andreasen et al., 1977). All subjects were assessed and scanned in an outpatient setting. Psychostimulant medications were discontinued 24–48 hours before the scan, primarily due to a concurrent, separate fMRI study of attention. Other medications including mood-stabilizers, atypical antipsychotics, and antidepressants, were continued to avoid any risk of mood destabilization. Thorough medication histories were obtained and used for exploratory and covariate analyses of 1H-MRS findings.
2.2 Proton Magnetic Resonance Spectroscopy
After psychiatric diagnostic interviews, subjects were scanned by 1H-MRS at 8, 10, 12, 52, 104, 156, 208, or 260 weeks using a 3 Tesla GE MRI system with Echospeed gradients (General Electric Healthcare, Milwaukee, WI, USA) using a custom-built quadrature birdcage receiving head coil with a 50% advantage in signal-to-noise ratio (SNR) over that provided by the standard GE head coil. Eighteen axial slices (4 mm thick, 0.05 mm skip) parallel to the anterior-posterior commissure plane and covering the entire brain were acquired with a temporal resolution of 3 seconds using a T2-weighted gradient echo spiral pulse sequence (Fast Spin Echo, TR=3000 ms, TE= 30 ms, flip angle=89° and 1 interleave, FOV=220 mm, in-plane spatial resolution=3.125 mm, 256 × 192 matrix; acquired resolution = 5.0 × 0.9 × 1.2 mm3). This T2-weighted image was used to localize and prescribe a 2 × 2 × 2 cm voxel that was prescribed in the right and then left DLPFC, from the first axial slice above the lateral ventricles as described previously (Gallelli et al., 2005). The voxel was placed anywhere from 0 to 4 mm above the lateral ventricles, immediately anterior to a line drawn between the anterior aspects of the lateral ventricles, and as far lateral as possible while remaining in the cerebrum and visually maintaining approximately equal parts of gray and white matter (Fig. 1). An investigator blind to diagnosis visually inspected each voxel placement to ensure proper placement fully within the brain.
Figure 1.
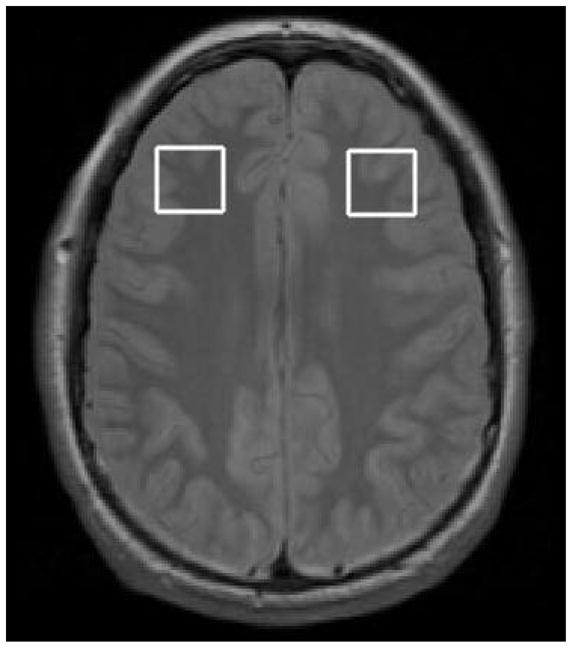
Voxel placement in the right and left dorsolateral prefrontal cortex.
Spectroscopic data were acquired within the 2×2×2 voxels that were placed in the bilateral DLPFC (Figure 1) according to the 124 × 256 × 256 anatomical image set using the following parameters: PRESS localization, TR/TE=2000/35ms, 5 mm slice thickness, 124 × 256 × 256 matrix. MRS scans used 32 averages, 1 kHz spectral bandwidth, 1 k data points, with water suppressed and unsuppressed frames, and a scan length of 1 min 44 seconds. A field strength of 3T made it possible to obtain adequate signal-to-noise with a relatively short acquisition time (Di Costanzo et al., 2007). To reduce field inhomogeneities, an automated high-order shimming method based on spiral acquisitions was used before acquiring MRS data. The fully automated PROBE/SV quantification tool (General Electric Medical Systems, Milwaukee, WI, USA) was used for data acquisition and LCModel version 6.20 (Provencher, 2001) was used to process the MRS data and produced NAA and mI relative to creatine (Cr) concentrations (see Figure 2 for representative spectra). All participants in our study fulfilled generally accepted standards for brain MRS at baseline and follow-up. Cramer-Rao spectral inclusion criteria were SD<15% for NAA and mI to replicate assumptions made by previous research measuring these neurochemicals in prefrontal regions in youths with and at risk for BD (Singh et al., 2010). In addition, creatine signal SNR values in water-suppressed spectra were set at a conservative threshold level of greater than 10 to be of acceptable quality. Finally, an experienced independent spectroscopist (D.S.) visually inspected water-suppressed metabolite spectrum for any artifacts such as large baseline distortions, broad metabolic peaks, insufficient removal of the water line, large phase errors, and signals originating from outside the voxel.
Figure 2.

Sample magnetic resonance spectrum in LCModel; ml = myoinositol; Cr = creatine,, NAA = N-acetyl aspartate
Voxel segmentation was carried out in each participant at baseline and follow-up on high-resolution T1-weighted spoiled grass gradient recalled (SPGR) 3D MRI sequences with the following parameters: TR=35 ms; TE=6 ms; flip angle=45°; 24 cm field of view; 124 slices in the coronal plane; 256 × 192 matrix with acquired resolution of 1.5 × 0.9 × 1.2 mm3 (Table 4). The images were reconstructed as a 124 × 256 × 256 matrix with a 1.5 × 0.9 × 0.9 mm3 spatial resolution. Coronal volume images were segmented into gray matter, white matter, and CSF utilizing a semi-automated software package, FSL version 3.2. A 2 × 2 × 2 cm voxel was prescribed on the left and right DLPFC of the first axial slice above the lateral ventricles, while maintaining roughly equal portions of gray and white matter. The segmented images were edited further by applying the voxel dimensions in the DLPFC used for MRS, providing the grey and white matter content of these voxels for each subject (Gallelli et al., 2005; Singh et al., 2010).
Table 4.
Percent voxel composition of Dorsolateral Prefrontal Cortex
| Bipolar (N=36), % (SD) | Subsyndromal (N=28), % (SD) | Control (N=28), % (SD) | |
|---|---|---|---|
| Left white baseline | 60.01 (10.14) | 60.56 (10.24) | 60.00 (10.14) |
| Left white follow-up | 60.58 (9.21) | 61.03 (5.93) | 60.58 (9.21) |
| Left grey baseline | 39.10 (9.64) | 38.16 (9.5) | 39.09 (9.65) |
| Left grey follow-up | 38.45 (8.78) | 37.80 (4.64) | 38.45 (8.78) |
| Right white baseline | 59.92 (11.60) | 61.78 (11.73) | 59.91 (11.6) |
| Right white follow-up | 55.56 (11.33) | 55.22 (10.8) | 55.55 (11.33) |
| Right grey baseline | 39.11 (11.35) | 37.76 (11.03) | 39.11 (11.35) |
| Right grey follow-up | 42.78 (10.02) | 42.69 (9.09) | 42.78 (10.02) |
| Left CSF baseline | .93 (1.09) | 1.17 (1.66) | .93 (1.09) |
| Left CSF follow-up | .95 (1.15) | .89 (1.52) | .95 (1.14) |
| Right CSF baseline | .97 (1.05) | .94 (1.03) | .97 (1.05) |
| Right CSF follow-up | 1.51 (1.56) | 1.63 (2.36) | 1.51 (1.56) |
CSF = cerebrospinal fluid; SD = standard deviation
2.3 Statistical Analysis
All statistical analyses were performed using Statistical Analysis System software, version 8.02 (SAS Institute, Cary, N.C.). Analyses of variance (ANOVA) and chi-square tests were used to compare demographic and clinical characteristics between groups. MRS data were first examined for normality using univariate analyses to conform to the assumptions of the parametric statistics employed (Shapiro-Wilks statistic, W>0.91; P>0.08). Differences between groups in NAA and mI relative to Cr concentrations in the right and left DLPFC were first considered as the baseline primary outcome measures, and were compared between groups using ANOVA with a significance threshold of P ≤ 0.025 to correct for comparisons in the right and left DLPFC. Left and right voxels were modeled independently and corrected for multiple comparisons because neurometabolite concentrations have demonstrated laterality differences in prior studies (Chang et al., 2003; Hajek et al. 2012, Caetano et al., 2011). Effect sizes for group differences in metabolite concentration were calculated to identify the largest difference between groups based on F-values obtained from the ANOVAs using the formula (f) = √(k−1)F/N, where (f)= effect size, k=number of groups, F=test statistic, N=total number of subjects. An effect size of (f)>0.25 is considered a medium effect and of potential clinical relevance (Cohen, 1977). Where a clinically relevant effect size was found, least-squares means tests were performed to determine which pairs of groups differed significantly in metabolite concentration.
Likelihood-based linear mixed model utilizing repeated measures was used to examine change in metabolite concentrations over individually varying time scores, or the actual age at each assessment point. This analysis was conducted to account for the effect of age because in this study the actual age at each assessment point varied substantially. Moreover, assessment points were variably spaced, and the number of measurement occasions also varied across subjects. These variably spaced measurement occasions were observed equally among all three groups. Covariates in this analysis included time, age, and age of onset of illness. All cases with available data at baseline (N=92) were included in the analysis with the assumption that any follow up data (N=27) were missing for random reasons conditional on observed information (Little and Rubin, 2002).
Pearson correlations were performed to explore relations between metabolites and clinical scores for depression (CDRS-R), mania (YMRS), overall functioning (CGAS), CCV, and age of onset of mania and depression determined at baseline assessment. Because of these multiple comparisons, a Bonferroni-type correction was applied to adjust significance threshold to P< 0.006 (Right and Left DLPFC NAACr, mICr at baseline and follow up: p = 0.05/2×2×2) for these exploratory analyses. The presence of ADHD, ODD, and anxiety comorbidity, as well as the effects of mood state, and prior, current, and lifetime exposures to medications within the BD and SS groups were examined by repeating the primary ANOVA analysis after covarying for these factors.
3. Results
3.1 Cohort
The HC group was approximately two years younger than the BD and SS groups. Thus, analyses of between group metabolite differences were covaried for age. There were no statistically significant group differences in gender, socioeconomic status, or intellectual quotient (IQ) among the three groups (Table 1). The majority of the bipolar offspring had a mother with bipolar disorder (78% in the BD group, 61% in the SS group), although paternal bipolarity was also represented (19% in the BD group and 39% in the SS group). There was only one family (3%) with both parents having bipolar disorder, and the subject was in the BD group.
Table 1.
Demographic and Clinical Characteristics of Study Participants
| Bipolar Offspring BD | Subsyndromal Offspring SS | Healthy Controls HC | |
|---|---|---|---|
|
| |||
| N | 36 | 28 | 28 |
|
| |||
| Mean baseline age, years (SD)* | 14.29 (3.0) | 14.10 (2.8) | 12.17 (2.6) |
|
| |||
| Mean age at follow up, years (SD)* | 16.71 (2.8) | 16.98 (2.8) | 14.02 (3.3) |
|
| |||
| Gender, (%) female | 10 (28) | 8 (29) | 8 (29) |
|
| |||
| Socioeconomic Status, mean (SD) | 4.03 (0.90) | 4.07 (0.86) | 4.05 (0.85) |
|
| |||
| Mean Baseline IQ (SD)* | 106.0 (12.6) | 114.4 (9.9) | 110.9 (20.5) |
|
| |||
| Parent Diagnosis of Bipolar Offspring | |||
| Dad with Bipolar Diagnosis | 7 (19) | 11 (39) | 0 (0) |
| Mom with Bipolar Diagnosis | 28 (78) | 17 (61) | 0 (0) |
| Both with Bipolar Diagnosis | 1 (3) | 0 (0) | 0 (0) |
| Neither parent with Any Diagnosis | 0 (0) | (0) | 28 (100) |
|
| |||
| Participants scanned once, N (%) | 12 (33%) | 8 (29%) | 9 (32%) |
|
| |||
| Participants scanned twice, N (%) | 19 (53%) | 13 (46%) | 12 (43%) |
|
| |||
| Participants scanned >2 times, N (%) | 5 (14%) | 7 (25%) | 7 (25%) |
|
| |||
| Number of Participants with a diagnostic change at follow-up, N (%) | 4 (11) | 7 (25) | 1 (4) |
BD = high-risk offspring with bipolar disorder; SS = high-risk offspring with subsyndromal symptoms; HC = healthy controls; SD = standard deviation; SES = socioeconomic status;
significant group difference at p < 0.05.
At baseline evaluation, 94% (n=34) of the BD group had a diagnosis of bipolar I disorder and 6% (n=2) a diagnosis of bipolar II disorder. Other non-mood diagnoses in the BD group included attention deficit/hyperactivity disorder (ADHD) (78%), oppositional defiant disorder (ODD) (50%), and anxiety disorders (31%). At variable interval follow-up, mood and ADHD diagnoses remained stable in the BD group, with a marginal drop in ODD (by 8%) and anxiety disorders (3%). In the SS group at baseline, mood diagnoses included major depressive disorder (MDD) (N= 6, 21%), cyclothymia (N=1, 3.6%), and BD-NOS (N=7, 25%). Non-mood diagnoses in the SS group at baseline were ADHD (82%), ODD (25%), and anxiety disorders (29%). At follow-up, four (14%) additional participants among the SS group developed MDD, two (7%) developed BD-NOS, and there were marginal drops in ODD (7%) and anxiety disorder (8%) diagnoses. Finally, one (4%) HC participant converted to a diagnosis of depression at follow-up and was removed from subsequent analyses.
YMRS scores were comparable in the BD (mean = 15.3 ± 9.8) and SS (mean = 14.7 ± 4.2, P =0.80) groups at baseline but significantly lower in the SS group at follow up (BD group mean = 13.7 ± 8.2; SS group mean = 8.2 ± 5.3, P = 0.03). Baseline CDRS-R scores were higher in the BD group (mean = 45.3 ± 12.1) compared to the SS group (mean = 29.6 ± 7.7, P = 0.004), and at follow up were not statistically different (BD group mean = 27.1 ± 7.0; SS group mean = 27.1 ± 8.3, P = 1.0). Overall level of functioning represented by CGAS scores was not significantly different between groups at baseline (t(25)=1.26, P=0.22) but was significantly higher in the SS group relative to the BD group (t(19)=2.10, P= 0.04) at follow-up. Although subjects were not in a manic or depressive episode at the time of the scan, the mood symptom scores suggest a predominance of depressive symptoms in the BD group at baseline with a more modest symptom burden in both the BD and SS group at follow up. This is reflected in the change in manic, depressive, and overall illness (CCV) scores summarized in Table 2. Finally, mean age at onset of manic and depressive syndromal and subsyndromal symptoms did not significantly differ between the BD and SS groups.
Table 2.
Clinical Characteristics of Offspring of Parents with Bipolar Disorder
| Variable | Offspring with Bipolar Disorder N=36 | Subsyndromal Offspring (SS) N=28 | ||
|---|---|---|---|---|
| Baseline | Follow-up | Baseline | Follow-up | |
| Mean YMRS Score (SD)b | 15.3 (9.8) | 13.7 (8.2) | 14.7 (4.2) | 8.2 (5.3) |
| Mean CDRS-R Score (SD)a | 45.3 (12.1) | 27.1 (7.0) | 29.6 (7.7) | 27.1 (8.3) |
| Mean CGAS (SD)b | 52.1 (8.5) | 56.7 (9.0) | 56.2 (7.9) | 67.9 (13.4) |
| Diagnosis: | ||||
| BD I | 34 (94) | 34 (94) | 0 (0) | 1 (4) |
| BD II | 2 (6) | 2 (6) | 0 (0) | 0 (0) |
| MDD | 0 (0) | 0 (0) | 6 (21) | 10 (36) |
| BDNOS | 0 (0) | 0 (0) | 7 (25) | 9 (32) |
| Cyclothymia | 0 (0) | 0 (0) | 1 (4) | 1 (4) |
| ADHD | 28 (78) | 28 (78) | 23 (82) | 23 (82) |
| ODD | 18 (50) | 15 (42) | 7 (25) | 5 (18) |
| Anxiety Disorders* | 11 (31) | 10 (28) | 8 (29) | 6 (21) |
| Mean Clinical Change in Depressiona | 50.5 (15.6) | 49.0 (17.8) | 39.5 (11.6) | 42.8 (19.1) |
| Mean Clinical Change in Maniaa,b | 51.6 (7.5) | 48.4 (12.2) | 39.2 (8.3) | 34.5 (13.0) |
| Mean Overall Clinical Changea | 102.1 (19.7) | 97.2 (29.2) (18.8) | 77.4 | 76.5 (26.8) |
| Mean Age of Onset of Mania symptoms | 12.15 (3.2) | - | - | 14.38 (2.3) |
| Mean Age of Onset of Depression | 12.48 (2.7) | - | 12.50 (2.7) | - |
| Psychotropic medications at time of MRS, n (%) | ||||
| Any medication | 33 (92) | 35 (97) | 22 (79) | 27 (96) |
| Atypical Antipsychotics | 17 (47) | 19 (53) | 7 (25) | 9 (32) |
| SSRI Antidepressants | 23 (64) | 25 (69) | 9 (32) | 10 (36) |
| Atypical Antidepressants** | 13 (36) | 14 (39) | 13 (46) | 13 (46) |
| Stimulants | 22 (61) | 22 (61) | 14 (50) | 14 (50) |
| Lithium | 11 (33) | 14 (39) | 3 (11) | 3 (11) |
| Valproate | 17 (47) | 22 (61) | 7 (25) | 18 (64) |
| Mood Stabilizers*** | 20 (56) | 26 (72) | 7 (25) | 16 (57) |
BD = high-risk offspring with bipolar disorder; SS = high-risk offspring with subsyndromal symptoms; HC = healthy controls; SD = standard deviation; YMRS = Young Mania Rating Scale; CDRS-R = Childhood Depression Rating Scale-Revised; Anxiety disorder = separation anxiety disorder, generalized anxiety disorder, social phobia, obsessive-compulsive disorder, or post-traumatic stress disorder; ADHD = attention-deficit/hyperactivity disorder; ODD = oppositional defiant disorder, SSRI = Selective serotonin reuptake inhibitors
Anxiety Disorders including: Generalized anxiety, Separation Anxiety, Specific Phobias, and Obsessive compulsive disorder
Atypical antidepressants including: Buproprion, Mirtazapine, Trazadone, Venlafaxine, ***Mood stabilizers other than Valproate including: Carbamazepine, Gabapentin, Lamotrigine, Oxcarbazepine, Tiagabin, and Topiramate.
Significant between group differences at baseline
Significant between group differences at follow-up
Thirty-three (92%) subjects in the BD group had previously taken psychotropic medications at baseline. Sixty-one percent of these subjects had significant past exposure (more than 2 months) to stimulants; 64% to selective serotonin reuptake inhibitors (SSRIs), 36% to atypical antidepressants; 47% to antipsychotics, 33% with exposure to lithium, 47% with exposure to valproate, and 56% to other mood stabilizers. At the time of follow-up, all but one (97%) BD participant had been exposed to medication, with increased exposures to atypical antipsychotics (53%), SSRIs (69%), atypical antidepressants (39%), lithium (39%), valproate (61%), and mood stabilizers (72%). Stimulant treatment appeared stable on follow up.
Twenty-two (79%) subjects in the SS group were taking psychotropic medications at the baseline visit. Fifty percent were exposed to stimulants, 32% to SSRIs, 46% to atypical antidepressants, 25% to antipsychotics, 11% to lithium, 25% to valproate, and 25% to other mood stabilizers. At follow-up, the percentages of subjects in the SS group being actively treated with medication were as follows: 50% with stimulants; 36% with SSRIs, 46% with atypical antidepressants; 32% with atypical antipsychotics, 11% with lithium, 64% with valproate, and 57% with other mood stabilizers. Overall, medication exposure increased by 17% on follow-up of the SS group.
No significant correlations between baseline YMRS, CDRS-R, CGAS scores, CV, or age at onset of mania or depression and metabolite concentrations were found within the BD and SS groups after correcting for multiple comparisons (all p’s>0.05). Presence of medication, an ADHD, ODD, or anxiety diagnosis, or mood state did not significantly change group differences in metabolite concentrations.
3.2 Longitudinal Spectroscopy Results
Age adjusted 1H-MRS quantification in bilateral DLPFC in bipolar versus healthy control offspring at baseline and follow-up is summarized in Table 3. Based upon mixed effects modeling of longitudinal data, there was high overall significance for the models indicating age at each assessment (χ2=35.53, df=1, p<0.0001) was likely to predict NAA/Cr and mI/Cr concentrations. Models analyzed with PROC MIXED using age as a continuous time variable showed trends for mI/Cr concentrations to be increased across BD offspring and HC groups in the bilateral DLPFC (t=2.10, df=157, p=0.037), but no statistically significant group (t=0.64, df=55, p=0.53), or age x group interactions were found (t=0.24, df=157, p=0.81). NAA/Cr concentrations did not demonstrate any statistically significant decreases with age (t=0.02, df=55, p=0.98), across BD and HC groups (t=0.11, df=55, p=0.91), or in age by group interaction (t=−0.55, df=160, p=0.58). No statistically significant group differences in NAA/Cr or mI/Cr were found in either the right or left DLPFC separately (lowest p value, Right DLPFC mI/Cr, p=0.18).
Table 3.
Age adjusted 1H-MRS Quantification in Bipolar versus Healthy Control Offspring in the Dorsolateral Prefrontal Cortex at Baseline and Follow-Up
| Metabolite Ratio | BD Mean (SD) | SS Mean (SD) | HC Mean (SD) | F Statistic | P | Effect Size, f |
|---|---|---|---|---|---|---|
| Maximum N | 36 | 28 | 28 | |||
| Baseline Left NAA/Cr | 1.63 (0.14) | 1.62 (0.13) | 1.62 (0.12) | 0.14 | 0.87 | 0.06 |
| Baseline Right NAA/Cr | 1.68 (0.12) | 1.67 (0.13) | 1.70 (0.10) | 0.45 | 0.64 | 0.10 |
| Baseline Left mI/Cr | 0.48 (0.06) | 0.51 (0.06) | 0.50 (0.06) | 1.13 | 0.33 | 0.13 |
| Baseline Right mI/Cr | 0.48 (0.06) | 0.49 (0.06) | 0.46 (0.03) | 1.54 | 0.22 | 0.18 |
| Follow-up Left NAA/Cr | 1.65 (0.17) | 1.59 (0.11) | 1.68 (0.13) | 3.71 | 0.03 | 0.28 |
| Follow-up Right NAA/Cr | 1.69 (0.14) | 1.66 (0.12) | 1.71 (0.14) | 0.49 | 0.62 | 0.10 |
| Follow-up Left mI/Cr | 0.54 (0.07) | 0.49 (0.06) | 0.51 (0.05) | 2.42 | 0.10 | 0.23 |
| Follow-up Right mI/Cr | 0.52 (0.06) | 0.50 (0.08) | 0.49 (0.06) | 1.07 | 0.35 | 0.15 |
Absolute concentrations to tissue water using LCModel; SS=Offspring of Parents with Bipolar Disorder with Subsyndromal Symptoms; HC=Healthy Controls; SD = Standard Deviation; NAA = N-Acetyl Aspartate, mI = Myoinositol, Cr = Creatine
No significant correlations were found using univariate analyses between metabolite concentrations and follow-up YMRS, CDRS-R, CGAS scores, clinical change variables, or age at onset of mania or depression within the BD and SS groups after correcting for multiple comparisons (all Ps >0.05). Similarly, there were no correlations noted between changes in these clinical and neurochemical measures from baseline to follow-up.
Segmentation of the right and left DLPFC voxels showed no significant group differences or group x time interactions in either grey or white matter tissue or in the cerebrospinal fluid (all Ps>0.05) (Table 4).
4. Discussion
The present study was designed to prospectively compare the neurometabolite levels of N-acetyl aspartate and myoinositol as a ratio of creatine in the dorsolateral prefrontal cortex in pediatric offspring of bipolar parents and a healthy comparison group (HC) over a 5-year period using proton magnetic resonance spectroscopy. Longitudinal analyses of DLPFC did not find any statistically significant group differences over time in the prefrontal neurometabolites NAA or mI in ratio with creatine. This lack of significant findings may have been due to within or between group variance in neurochemical concentrations with each group. However, post hoc Levene’s tests for homogeneity found variance to be relatively stable within and between groups. Additional time points for follow up may aid in further differentiation of healthy versus psychopathological neurochemical concentrations.
To our knowledge, this is the first longitudinal examination of neurochemical concentrations in youth with and at high-risk for BD. Our results are surprising considering that youth with a family history of BD commonly progress in mood symptom severity over time (Axelson et al., 2011), suggesting the likelihood of detecting neurobiological change in these youth. Malhi et al.’s (2007) study of adults with BD found that hypomanic and euthymic individuals with BD appeared to have lower mean NAA, mI, and choline metabolite levels in prefrontal regions than in the basal ganglia as compared to controls. The only longitudinal result reported in this study was that choline levels increased with time in the basal ganglia and decreased with time in the prefrontal cortex. However, group by time interactions were not reported. This study was also limited by a small sample size, low magnet field strength (1.5T), and confounded by medication exposure. In our study, we were able to examine a larger group of familial bipolar youth much closer to their illness onset, and on a 3T magnet. It remains a challenge to disentangle variable medication exposure from primary neurochemical outcome measures in our analysis, as has previously been reported (Chang et al., 2010). Future MRS studies examining healthy unaffected youth offspring prior to the onset of symptoms or medication exposure would add to the important investigation of trait versus state related neurochemical changes associated with BD. One prior comparison of neurometabolites in the medial prefrontal cortex between unaffected and affected relatives of patients with BD yielded nonsignificant differences (Hajek et al., 2008).
There are mixed results with previous attempts to directly examine relations between MRS findings and symptomatic change in adults and youth with BD by investigating neurochemical markers pre- and post-medication exposure (Davanzo et al., 2003; Brambilla et al., 2004; Patel et al., 2006; Patel et al., 2008b; Hajek et al., 2012). Both prefrontal NAA and mI change in concentration in response to lithium treatment in pediatric populations (Davanzo et al., 2003; Patel et al., 2008b). Specifically, Davanzo et al. (2003) found that after 1 week of acute lithium treatment, baseline elevations of mI/creatine ratios (mI/Cr) in the anterior cingulate cortex in 11 youth with bipolar disorder decreased, and this decrement was significant for lithium responders versus non-responders. However, Patel and colleagues (2006) observed that in 12–18 year old youth with bipolar depression, lithium did not have any acute (1 week) or chronic (42 days) effects in changing mI levels in the medial and lateral prefrontal cortices. In a different study, Patel and colleagues (2008b) did find that 42 days after lithium administration, a sample of 12–18 year olds with bipolar disorder demonstrated reductions in NAA concentration in the ventral but not lateral prefrontal cortex. In this study, there was a time-by-remission-status interaction of NAA concentrations in the right ventrolateral prefrontal cortex, such that youth who remitted developed decreased mean NAA concentration from day 7 to day 42 whereas nonremitters showed an increase in mean NAA concentration during that same period. The authors speculated that higher lithium levels earlier in the treatment course might have resulted in lithium-induced increases in prefrontal metabolism (Patel et al., 2008b). In adults, chronic lithium exposure has been shown to nonselectively increase NAA concentrations in prefrontal, temporal, parietal, and occipital regions (Moore et al., 2000) thereby perhaps increasing neuronal viability and function. Conversely, substantial illness burden combined with limited lifetime lithium exposure has been associated with significantly lower prefrontal NAA levels (Hajek et al., 2012). Some of these findings suggest that by modulating neurometabolite levels involved in neuronal cell fluid balance (NAA) and second-messenger systems (mI), lithium exerts its action either by fluid shifts or through intracellular calcium signaling pathways.
The effects of neurometabolite changes in the prefrontal cortex have been examined after treatment with other medications, including divalproex (Chang et al., 2009; Strawn et al., 2012) and the atypical antipsychotics olanzapine (DelBello et al., 2006) and quetiapine (Chang et al., 2012). Although there were no statistically significant differences in pre- or post divalproex NAA to Cr (NAA/Cr) ratios, there was a large effect size (d=0.94) for a decrease in right DLPFC NAA/Cr after treatment with divalproex (Chang et al., 2009). Lower baseline concentrations of the excitatory neurotransmitter glutamate as a ratio to glutamine in the left ventrolateral prefrontal cortex may also be associated with successful treatment of mania with divalproex (Strawn et al., 2012). Adolescents with first episode mania who achieved remission with olanzapine, demonstrated increases in ventral prefrontal NAA as compared to nonremitting patients, who showed decreases in prefrontal NAA concentrations (DelBello et al., 2006). In contrast, quetiapine responders had significantly lower posttreatment ACC mI values than did nonresponders (3.27±.71 vs. 4.23±.70; p=0.004), but this effect was not seen at baseline (Chang et al., 2012). As our current study followed individuals naturalistically, the impact of these medications on neurochemical distributions over time could not be easily examined. An integration of neurochemical data with brain structural and functional MRI data may enhance our understanding of the basic mechanisms by which certain medications may be acting to attenuate symptoms of bipolar disorder, or provide complementary evidence that longer follow up may be needed between neuroimaging assessments to determine the true impact of illness processes on brain function (Chang et al., 2009).
Changes in metabolite concentrations have not been replicated in other studies of offspring or relatives at high-risk for bipolar disorder (Gallelli et al., 2005; Hajek et al., 2008) or in youth with severe mood dysregulation (Dickstein et al., 2008). Diagnostic and developmental heterogeneity, mood state at the time of scan, partial volumes of gray and white matter in the regions of interest, and other demographic variables may account for differences across studies.
Sample heterogeneity in pubertal status, co-occurring diagnoses, medication exposure, and an insufficient sample size to examine the effects of these variables limit this analysis. More time than a five year follow up, increased frequency of diagnostic conversions in this cohort, and increased frequency of measurements may be required to determine if there are differences between groups and if disease progression is related to neurometabolite changes over time. Moreover, the relation between neurometabolites and time may be nonlinear and might require alternative modeling approaches. Youth in the healthy control group were, on average, two years younger than the other two groups. We attempted a variety of different approaches including age matching and stratification to address this difference, but these yielded similar results to those we presented. Importantly, our longitudinal analysis used mixed effects modeling explicitly treating subjects’ actual age as time (instead of covarying or controlling for the baseline age), which provided the most valid results for this age range and given sufficient data from both the control and bipolar offspring groups. In addition, voxel placement was approximated longitudinally but not reliably in the identical location across scans. Reproducibility of spectroscopic data is well known to be a challenge (Li et al., 2002), with no well established standards by which to ensure that spectroscopic information is obtained from the same region, particularly since many of the youth examined in this fashion underwent significant developmental maturation of their brains between baseline and follow-up. For this reason, we relied on anatomical landmarks to approximate placement in the same relative regions across time. Finally, absolute concentrations versus ratios of metabolites were not calculable due to lack of time for acquisition of water suppressed and unsuppressed scans. Thus, metabolite ratios could be influenced by changes in Cr over time, affecting the results. However, we did not find statistically significant group differences in creatine either at baseline or follow-up assessments, or in our previous studies (Singh et al., 2010; Singh et al., 2011). As MRS technology evolves, our understanding of neurochemical substrates of bipolar illness will further refine to be able to draw more definitive conclusions regarding specific neurometabolite markers.
Our study found no MRS-detectable changes in neurometabolites over time that differentiate youth with familial risk for BD from healthy controls. A longer period of follow-up with correlations to mood state are warranted, as the current results may have been confounded by severity or polarity of illness, or medication exposure. It is also possible that biological changes related to disease progression may be too subtle to detect in the developing brain, where many structural and functional processes are undergoing maturation. In youth with BD, portions of the prefrontal cortex, including the DLPFC, amygdala, and hippocampus have all been vulnerable to volume loss, perhaps due to neurotoxic effects of mood dysregulation (e.g., from excessive myoinositol levels) (Adleman et al., 2012; see Singh et al., 2012 for review). Moreover, other imaging modalities have also suggested some evidence for developmental and progressive neurophysiological alterations in bipolar disorder (Schneider et al., 2012). These data as well as literature in adults with BD point to a neurodegenerative model of bipolar illness that has created an imperative for investigation and early intervention to prevent neuronal loss and to regenerate neural tissue to restore function. Following youth with and at risk for BD into adulthood will aid in determining if changes in NAA, mI and other nerve cell markers at baseline or over time are accounting for a significant progression of symptoms associated with BD.
Acknowledgments
The authors gratefully acknowledge the support of the National Institute of Mental Health (K23 MH064460), the National Alliance for Research on Schizophrenia and Depression (NARSAD), the Hahn Family, and the Klingenstein Third Generation Foundation. GlaxoSmithKline and Abbott Laboratories provided funding for approximately one third of the scans of the BP and HC subjects.
Footnotes
Publisher's Disclaimer: This is a PDF file of an unedited manuscript that has been accepted for publication. As a service to our customers we are providing this early version of the manuscript. The manuscript will undergo copyediting, typesetting, and review of the resulting proof before it is published in its final citable form. Please note that during the production process errors may be discovered which could affect the content, and all legal disclaimers that apply to the journal pertain.
References
- Adleman NE, Fromm SJ, Razdan V, Kayser R, Dickstein DP, Brotman MA, Pine DS, Leibenluft E. Cross-sectional and longitudinal abnormalities in brain structure in children with severe mood dysregulation or bipolar disorder. Journal of Child Psychology and Psychiatry. 2012 Jun 1; doi: 10.1111/j.1469-7610.2012.02568.x. [DOI] [PMC free article] [PubMed] [Google Scholar]
- Axelson DA, Birmaher B, Strober MA, Goldstein BI, Ha W, Gill MK, Goldstein TR, Yen S, Hower H, Hunt JI, Liao F, Iyengar S, Dickstein D, Kim E, Ryan ND, Frankel E, Keller MB. Course of subthreshold bipolar disorder in youth: diagnostic progression from bipolar disorder not otherwise specified. Journal of the American Academy of Child and Adolescent Psychiatry. 2011;50:1001–1016. e3. doi: 10.1016/j.jaac.2011.07.005. [DOI] [PMC free article] [PubMed] [Google Scholar]
- Brady RO, Jr, Cooper A, Jensen JE, Tandon N, Cohen B, Renshaw P, Keshavan M, Öngür D. A longitudinal pilot proton MRS investigation of the manic and euthymic states of bipolar disorder. Transl Psychiatry. 2012;2:e160. doi: 10.1038/tp.2012.84. [DOI] [PMC free article] [PubMed] [Google Scholar]
- Brambilla P, Stanley JA, Sassi RB, Nicoletti MA, Mallinger AG, Keshavan MS, Soares JC. 1H MRS study of dorsolateral prefrontal cortex in healthy individuals before and after lithium administration. Neuropsychopharmacology. 2004;29:1918–1924. doi: 10.1038/sj.npp.1300520. [DOI] [PubMed] [Google Scholar]
- Caetano SC, Olvera RL, Hatch JP, Sanches M, Chen HH, Nicoletti M, Stanley JA, Fonseca M, Hunter K, Lafer B, Pliszka SR, Soares JC. Lower N-acetyl-aspartate levels in prefrontal cortices in pediatric bipolar disorder: a 1H magnetic resonance spectroscopy study. J Am Acad Child Adolesc Psychiatry. 2011;50:85–94. doi: 10.1016/j.jaac.2010.10.007. [DOI] [PubMed] [Google Scholar]
- Chang K, Adleman N, Dienes K, Barnea-Goraly N, Reiss A, Ketter T. Decreased N-acetylaspartate in children with familial bipolar disorder. Biological Psychiatry. 2003;53:1059–1065. doi: 10.1016/s0006-3223(02)01744-4. [DOI] [PubMed] [Google Scholar]
- Chang K, Saxena K, Howe M. An open-label study of lamotrigine adjunct or monotherapy for the treatment of adolescents with bipolar depression. Journal of the American Academy of Child and Adolescent Psychiatry. 2006;45:298–304. doi: 10.1097/01.chi.0000194566.86160.a3. [DOI] [PubMed] [Google Scholar]
- Chang K, Karchemskiy A, Kelley R, Howe M, Garrett A, Adleman N, Reiss A. Effect of divalproex on brain morphometry, chemistry, and function in youth at high-risk for bipolar disorder: a pilot study. Journal of Child and Adolescent Psychopharmacology. 2009;19:51–59. doi: 10.1089/cap.2008.060. [DOI] [PMC free article] [PubMed] [Google Scholar]
- Chang KD, Saxena K, Howe M, Simeonova D. Psychotropic medication exposure and age at onset of bipolar disorder in offspring of parents with bipolar disorder. Journal of Child and Adolescent Psychopharmacology. 2010;20:25–32. doi: 10.1089/cap.2009.0036. [DOI] [PMC free article] [PubMed] [Google Scholar]
- Chang K, Delbello M, Chu WJ, Garrett A, Kelley R, Mills N, Howe M, Bryan H, Adler C, Eliassen J, Spielman D, Strakowski SM. Neurometabolite effects of response to quetiapine and placebo in adolescents with bipolar depression. J Child Adolesc Psychopharmacol. 2012;22:261–268. doi: 10.1089/cap.2011.0153. [DOI] [PMC free article] [PubMed] [Google Scholar]
- Cecil KM, DelBello MP, Sellars MC, Strakowski SM. Proton magnetic resonance spectroscopy of the frontal lobe and cerebellar vermis in children with a mood disorder and a familial risk for bipolar disorders. Journal of Child and Adolescent Psychopharmacology. 2003;13:545–555. doi: 10.1089/104454603322724931. [DOI] [PubMed] [Google Scholar]
- Dager SR, Friedman SD, Parow A, Demopulos C, Stoll AL, Lyoo IK, Dunner DL, Renshaw PF. Brain metabolic alterations in medication-free patients with bipolar disorder. Archives of General Psychiatry. 2004;61:450–458. doi: 10.1001/archpsyc.61.5.450. [DOI] [PubMed] [Google Scholar]
- Davanzo P, Yue K, Thomas MA, Belin T, Mintz J, Venkatraman TN, Santoro E, Barnett S, McCracken J. Proton magnetic resonance spectroscopy of bipolar disorder versus intermittent explosive disorder in children and adolescents. American Journal of Psychiatry. 2003;160:1442–1452. doi: 10.1176/appi.ajp.160.8.1442. [DOI] [PubMed] [Google Scholar]
- Frey BN, Folgierini M, Nicoletti M, Machado-Vieira R, Stanley JA, Soares JC, Kapczinski F. A proton magnetic resonance spectroscopy investigation of the dorsolateral prefrontal cortex in acute mania. Human Psychopharmacology. 2005;20:133–139. doi: 10.1002/hup.671. [DOI] [PubMed] [Google Scholar]
- Gallelli KA, Wagner CM, Karchemskiy A, Howe M, Spielman D, Reiss A, Chang KD. N-acetylaspartate levels in bipolar offspring with and at high-risk for bipolar disorder. Bipolar Disorders. 2005;7:589–597. doi: 10.1111/j.1399-5618.2005.00266.x. [DOI] [PubMed] [Google Scholar]
- Hajek T, Bernier D, Slaney C, Propper L, Schmidt M, Carrey N, MacQueen G, Duffy A, Alda M. A comparison of affected and unaffected relatives of patients with bipolar disorder using proton magnetic resonance spectroscopy. Journal of Psychiatry and Neuroscience. 2008;33:531–540. [PMC free article] [PubMed] [Google Scholar]
- Hajek T, Bauer M, Pfennig A, Cullis J, Ploch J, O’Donovan C, Bohner G, Klingebiel R, Young LT, Macqueen GM, Alda M. Large positive effect of lithium on prefrontal cortex N-acetylaspartate in patients with bipolar disorder: 2-centre study. J Psychiatry Neurosci. 2012;37:185–192. doi: 10.1503/jpn.110097. [DOI] [PMC free article] [PubMed] [Google Scholar]
- Li BS, Babb JS, Soher BJ, Maudsley AA, Gonen O. Reproducibility of 3D proton spectroscopy in the human brain. Magn Reson Med. 2002;47:439–446. doi: 10.1002/mrm.10081. [DOI] [PubMed] [Google Scholar]
- Little RJA, Rubin DB. Statistical analysis with missing data. Wiley; New York: 2002. [Google Scholar]
- Malhi GS, Ivanovski B, Wen W, Lagopoulos J, Moss K, Sachdev P. Measuring mania metabolites: a longitudinal proton spectroscopy study of hypomania. Acta Psychiatrica Scandanavica Supplement. 2007;434:57–66. doi: 10.1111/j.1600-0447.2007.01060.x. [DOI] [PubMed] [Google Scholar]
- Michael N, Erfurth A, Pfleiderer B. Elevated metabolites within dorsolateral prefrontal cortex in rapid cycling bipolar disorder. Psychiatry Res. 2009;172:78–81. doi: 10.1016/j.pscychresns.2009.01.002. [DOI] [PubMed] [Google Scholar]
- Moore CM, Biederman J, Wozniak J, Mick E, Aleardi M, Wardrop M, Dougherty M, Harpold T, Hammerness P, Randall E, Lyoo IK, Renshaw PF. Mania, glutamate/glutamine and risperidone in pediatric bipolar disorder: a proton magnetic resonance spectroscopy study of the anterior cingulate cortex. Journal of Affective Disorders. 2007;99(1–3):19–25. doi: 10.1016/j.jad.2006.08.023. [DOI] [PMC free article] [PubMed] [Google Scholar]
- Moore GJ, Bebchuk JM, Parrish JK, Faulk MW, Arfken CL, Strahl-Bevacqua J, Manji HK. Temporal dissociation between lithium-induced changes in frontal lobe myo-inositol and clinical response in manic-depressive illness. American Journal of Psychiatry. 1999;156:190–908. doi: 10.1176/ajp.156.12.1902. [DOI] [PubMed] [Google Scholar]
- Patel NC, DelBello MP, Cecil KM, Adler CM, Bryan HS, Stanford KE, Strakowski SM. Lithium treatment effects on Myo-inositol in adolescents with bipolar depression. Biological Psychiatry. 2006;60:998–1004. doi: 10.1016/j.biopsych.2006.07.029. [DOI] [PMC free article] [PubMed] [Google Scholar]
- Patel NC, Cecil KM, Strakowski SM, Adler CM, DelBello MP. Neurochemical alterations in adolescent bipolar depression: a proton magnetic resonance spectroscopy pilot study of the prefrontal cortex. Journal of Child and Adolescent Psychopharmacology. 2008a;18:623–627. doi: 10.1089/cap.2007.151. [DOI] [PMC free article] [PubMed] [Google Scholar]
- Patel NC, DelBello MP, Cecil KM, Stanford KE, Adler CM, Strakowski SM. Temporal change in N-acetyl-aspartate concentrations in adolescents with bipolar depression treated with lithium. Journal of Child and Adolescent Psychopharmacology. 2008b;18:132–139. doi: 10.1089/cap.2007.0088. [DOI] [PubMed] [Google Scholar]
- Pavuluri MN, Birmaher B, Naylor MW. Pediatric bipolar disorder: a review of the past 10 years. Journal of the American Academy of Child and Adolescent Psychiatry. 2005;44:846–871. doi: 10.1097/01.chi.0000170554.23422.c1. [DOI] [PubMed] [Google Scholar]
- Schneider MR, Delbello MP, McNamara RK, Strakowski SM, Adler CM. Neuroprogression in bipolar disorder. Bipolar Disorders. 2012;14:356–374. doi: 10.1111/j.1399-5618.2012.01024.x. [DOI] [PubMed] [Google Scholar]
- Singh MK, Spielman D, Adleman N, Alegria D, Howe M, Reiss A, Chang KD. Brain Glutamatergic Characteristics of Pediatric Offspring of Parents with Bipolar Disorder. Psychiatry Res. 2010;182:165–171. doi: 10.1016/j.pscychresns.2010.01.003. [DOI] [PMC free article] [PubMed] [Google Scholar]
- Singh MK, Spielman D, Libby A, Adams E, Acquaye T, Howe M, Kelley R, Reiss A, Chang KD. Neurochemical Deficits in the Cerebellar Vermis in Child Offspring of Parents with Bipolar Disorder. Bipolar Disord. 2011;13:189–197. doi: 10.1111/j.1399-5618.2011.00902.x. [DOI] [PMC free article] [PubMed] [Google Scholar]
- Singh MK, DelBello MP, Chang KD. Neuroimaging studies of bipolar disorder in youth. In: Strakowski SM, editor. The Bipolar Brain. Oxford University Press; New York: 2012. pp. 103–123. [Google Scholar]
- Stork C, Renshaw PF. Mitochondrial dysfunction in bipolar disorder: evidence from magnetic resonance spectroscopy research. Molecular Psychiatry. 2005;10:900–919. doi: 10.1038/sj.mp.4001711. [DOI] [PubMed] [Google Scholar]
- Strawn JR, Patel NC, Chu WJ, Lee JH, Adler CM, Kim MJ, Bryan HS, Alfieri DC, Welge JA, Blom TJ, Nandagopal JJ, Strakowski SM, DelBello MP. Glutamatergic effects of divalproex in adolescents with mania: a proton magnetic resonance spectroscopy study. J Am Acad Child Adolesc Psychiatry. 2012;51:642–651. doi: 10.1016/j.jaac.2012.03.009. [DOI] [PMC free article] [PubMed] [Google Scholar]
- Yildiz-Yesiloglu A, Ankerst DP. Prog. Neuro-Psychopharmacol. Biological Psychiatry. 2006;30:969–995. doi: 10.1016/j.pnpbp.2006.03.012. [DOI] [PubMed] [Google Scholar]
- Yoon SJ, Lyoo IK, Haws C, Kim TS, Cohen BM, Renshaw PF. Decreased glutamate/glutamine levels may mediate cytidine’s efficacy in treating bipolar depression: a longitudinal proton magnetic resonance spectroscopy study. Neuropsychopharmacology. 2009;34:1810–1818. doi: 10.1038/npp.2009.2. [DOI] [PubMed] [Google Scholar]