

Abstract
In this study, we performed an in-depth characterization of the male pediatric infant urinary proteome by parallel proteomic analysis of normal healthy adult (n =6) and infant (n =6) males and comparison to available published data. A total of 1584 protein groups were identified. Of these, 708 proteins were identified in samples from both cohorts. Although present in both cohorts, 136 of these common proteins were significantly enriched in urine from adults and 94 proteins were significantly enriched in urine from infants. Using Gene Ontology, we found that the infant-enriched or specific subproteome (743 proteins) had an overrepresentation of proteins that are involved in translation and transcription, cellular growth and metabolic processes. In contrast, the adult enriched or specific subproteome (364 proteins) showed an overexpression of proteins involved in immune response and cell adhesion. This study demonstrates that the non-diseased male urinary proteome is quantitatively affected by age, has age-specific subproteomes, and identifies a common subproteome with no age-dependent abundance variations. These findings highlight the importance of age-matching in urinary proteomics.
Keywords: Pediatric Urinary Proteome, Urinary Proteomics, Mass Spectrometry, Spectral Counting
Introduction
Urine is a valuable body fluid for clinical proteomics [1, 2]. It has the following advantages: i) readily available in large amounts; ii) can be obtained noninvasively; iii) can be repeatedly prospectively sampled from the same individual for longitudinal studies; iv) it is relatively stable[3] and v) it is less complex in comparison to other systemic body fluids, such as blood-derived body fluids[3]. The urinary proteome is comprised of proteins from ultrafiltration of plasma by the kidneys, in addition to the local secretion and/or shedding of proteins from the genitourinary tract[4], suggesting it may reflect local and/or distal proteomic changes. Furthermore, the content of the urinary proteome can be significantly affected by normal physiologic and environmental variations [1, 2]. Therefore, a detailed examination of the non-diseased, i.e. “normal” population will advance the understanding of the normal variations of the urinary proteome.
Research to define the non-diseased adult urinary proteome has been ongoing for the past decade and the number of the identified proteins has constantly increased. The vast majority of previous efforts have focused on the adult urinary proteome. Adachi et al. defined one of the most comprehensive catalogues of the adult urinary proteome with more than 1500 proteins identified in the urine from 10 healthy adult donors[5]. Marimuthu and colleagues recently found over 600 new proteins in urine by using substantial sample fractionation [6].
While there have been significant efforts to characterize the adult urinary proteome, there have been comparatively few efforts to characterize the pediatric urinary proteome outside of biomarker discovery studies [7, 8]. To date, there have been no studies that determine if the pediatric urinary proteome is distinct from the adult urinary proteome. In rodents, we previously demonstrated that the urinary proteome changes drastically with normal postnatal maturation [9]. In this study we perform an in-depth analysis of the normal male infant urinary proteome and then compare it to normal healthy adult males and the current reported literature. This analysis identifies proteins that are enriched in or specific to infant urine, and proteins that are present independent of age. We identified three distinct subproteomes: 1) infant subproteome, 2) adult subproteome, and 3) common subproteome. Using spectral counting, we identified a subset of proteins in the common subproteome to be enriched or diminished based on age. To our knowledge, this is the first in-depth interrogation of the normal male infant urinary proteome and demonstrates that the non-diseased urinary proteome changes between infants and adults. This information is critical to future proteomic-based clinical studies on infant urine.
Experimental Section
Urine sample acquisition and storage
Urine samples and demographic data were obtained from a urine specimen registry at Boston Children’s Hospital using an IRB approved protocol. For the adults, clean catch voided samples were obtained from six healthy adult males. All adult patients completed self-reported health questionnaires to determine eligibility. No patients had reported urologic or other major systemic abnormality. All infant urine samples were obtained via a sterile, 5 French (1.67 mm) pediatric feeding tube utilizing standardized protocols at Boston Children’s Hospital. The feeding tube is approximately 1/4 the diameter of a normal pediatric male urethra. This method is the current clinical gold standard for collecting a one-time urine sample in non-toilet trained pediatric patients, because it is atraumatic and sterile. Catheterized urine samples have the lowest risk of introduction of contamination from skin or skin flora bacteria, as opposed to other methods such as a bagged urine sample. Samples were obtained from six healthy infant males undergoing minor penile surgery. Detailed medical histories were obtained from the patient record to determine eligibility. All patients were full term babies, with no prenatal or postnatal abnormalities except for a minor distal penile cosmetic abnormality. Macroscopic urinalysis and culture were negative for all samples. Samples were centrifuged at 4000 × g for 60 minutes at 4°C to remove debris. Protein concentration was measured by spectrophotometry (BioRad, CA) and samples were divided into 100 μg aliquots and stored at −80°C for one time use. Table 1 details the demographic data of each individual per cohort.
Table 1.
The demographic information and number of proteins and peptides identified in each of the (A) adult and (B) infant samples. Cohort-wide numbers of unique proteins and peptides are also reported along with their % coefficient of variations (cv) and the mean ages of each cohort.
| Adult 1 | Adult 2 | Adult 3 | Adult 4 | Adult 5 | Adult 6 | Adult Total* | cv | |
|---|---|---|---|---|---|---|---|---|
|
|
||||||||
| Age (yrs) | 23 | 31 | 33 | 36 | 32 | 35 | 31.67 (mean) | -- |
| Proteins | 547 | 435 | 609 | 521 | 599 | 629 | 936 | 12.9 |
| Peptides | 3912 | 2934 | 4582 | 3786 | 4775 | 5628 | 10170 | 21.8 |
| Spectra | 13840 | 9889 | 16333 | 15888 | 21725 | 25159 | 102834 | |
| Infant 1 | Infant 2 | Infant 3 | Infant 4 | Infant 5 | Infant 6 | Infant Total* | cv | |
|---|---|---|---|---|---|---|---|---|
|
|
||||||||
| Age (yrs) | 0.8 | 0.6 | 1 5 | 2.1 | 0.5 | 0.7 | 1.03 (mean) | -- |
| Proteins | 640 | 572 | 878 | 483 | 644 | 693 | 1356 | 20.3 |
| Peptides | 5625 | 3956 | 7745 | 4164 | 5340 | 6315 | 17569 | 25.5 |
| Spectra | 19063 | 12760 | 33066 | 19079 | 14298 | 15355 | 113621 | |
Ethanol Precipitation
9 volumes of cold ethanol were added to each urine aliquot, centrifuged at 2500 × g for 25 minutes at 4°C. All of the supernatant except for ~200 μl was removed. The pellet was resuspended in the remaining supernatant, transferred to a 1.5 ml Eppendorf tube, and then dried in the vacuum centrifuge (Speedvac, Thermo Savant) at room temperature.
One dimensional gel electrophoresis (1-DE)
100 μg of protein were resuspended in 21 μl of 100 mM ammonium bicarbonate (NH4HCO3) and 8 μl 4X LDS sample buffer (Invitrogen). 1 μl of 1 M DTT was added prior to incubation for 50 minutes at 50°C to reduce the sample. Samples were alkylated with 2 μl of 40% acrylamide at room temperature for 10 minutes. Samples were heated at 70°C for 10 minutes and then all samples from one age group were loaded onto a single 4–12% Bis-Tris precast gel (Invitrogen). Gels were run at 100 V and stained overnight in colloidal blue as per manufacturer protocol (Invitrogen).
Each gel lane was cut into twenty-four similar sized pieces. Gel fractions were washed for 30 minutes in 200 mM NH4HCO3, pH 7.8 at 37°C. These fractions were then dehydrated by incubation for 30 minutes in 200 mM NH4HCO3, pH 7.8/ACN (4:6 v/v) at 37°C, followed by rehydration for 30 minutes in 50 mM NH4HCO3, pH 7.8 at 37°C. Following incubation in 100% acetonitrile for 2 minutes, 0.1 μg trypsin in 50 mM NH4HCO3, pH 7.8 was added to each sample. The proteolysis was performed overnight at 37°C. The supernatant was subsequently recovered into microcentrifuge tubes and a second peptide extraction from these gel pieces was carried out with 0.1% trifluoroacetic acid (TFA) in 60% ACN for 5 minutes. Peptide-containing liquid fractions were pooled, dried under vacuum and resuspended in 25 μl 0.5% formic acid/5% Acetonitrile.
LC-MS/MS
All LC-MS/MS analyses were performed on an LTQ-FT Ultra mass spectrometer (Thermo). The LC columns (15 cm × 100 μm ID) were packed in-house (Magic C18, 5 μm, 100 Å, Michrom BioResources, into PicoTips, New Objective, Woburn, MA). Samples were analyzed with a 60 minute linear gradient (0–35% acetonitrile with 0.2% formic acid) and data were acquired in a data dependent manner, in which MS/MS fragmentation is performed on the 6 most intense peaks of every full MS scan.
Database Searching and Validation
The 200 most intense fragment ions of each raw product ion spectrum were used for searches against the homo sapiens database (2012_05) using Protein Pilot. Default search settings were utilized. A fragment ion search tolerance of 0.8 Dalton (Da) was permitted. The peptide level score cutoff for each of the runs was adjusted to ensure a 1% false discovery rate throughout the experiments[10], and proteins were regrouped to ensure parsimony. All identified proteins required at least 2 or more unique peptides within in at least one of the samples studied.
Spectral Count Quantification
Spectral counts were used as a surrogate measure of protein abundances[11]. We implemented a data analysis method that accounts for variability between samples to normalize relative protein abundance. Briefly, the total number of tandem MS spectra matching peptides from a protein was divided by the total sum of the spectral count values in that sample. The normalized spectral counts for each protein were then compared across the infant and adult cohorts. Normalization is particularly important in urine due to a potentially high level of variation between individuals[12]. Statistically significant proteins were determined by QSPEC software, which uses a Bayesian statistical test to determine the significance of quantitative differences[13]. Results were filtered at a 1% FDR.
Gene Ontology Analysis
To investigate the cellular component and biological process of our urinary proteins, three lists were created: 1) infant subproteome and enriched proteins (742 total entries); 2) adult subproteome and enriched proteins (367 total entries); and 3) common subproteome without quantitative variations (478) total entries. These numbers are slightly different from the set of proteins which were uniquely identified below, as they also include cohort-enriched proteins. BiNGO software was used to find statistically over- and under-represented GO categories in our three urinary subproteome datasets[14]. The full UniprotKB database was utilized as a reference set. All GO terms that were significant within a protein list with p < 0.0001 (after Benjamini-Hochberg multiple testing correction) were selected as over or underrepresented and are reported in Supporting Information. Selected terms are presented in supplementary materials.
Results and Discussion
The urinary proteome can change with disease or because of normal physiologic variations. Normal variations are most likely due to diet, hydration, circadian rhythm, metabolic and catabolic processes, exercise, sex, disease and other environmental factors. Previous work on normal rat urine demonstrated that the urinary proteome undergoes significant changes from birth (0 days) to adulthood (> 30 days) [9]. During days 0 to 14 of life in the rat, proteins associated with cell proliferation and differentiation, cell adhesion, and tissue remodeling were prominent in the urine. These upregulated proteins may reflect normal systemic or urogenital track maturation, such as nephron development, which in the rodent (in contrast to humans) continues to occur after birth.
However, to date, no studies have specifically looked at the effect of age and maturation on the non-diseased human urinary proteome. In this study we performed an in-depth analysis of the normal infant urinary proteome to determine if age affects the normal proteome. We compared the urinary proteome of 6 healthy adult males (mean age: 31.7 years) to 6 healthy full-term infant males (mean age: 1.0 year). Better characterization of these two cohorts and the effect of age will improve our understanding of normal variation of the urinary proteome and future urine proteomic studies utilizing normal cohorts.
Identification of age-specific proteins
The SDS-PAGE patterns of urinary proteins from the infant and adult samples are shown in Figure 1 and suggest putative distinctive features in each proteome. Comparison of their proteomes by GeLC-MS demonstrated significant differences in the proteins identified in each age group. The number of identified proteins per sample is presented in Table 1. In total, 10,170 unique peptides were identified in the adult cohort that mapped to 936 non-redundant proteins. In the 6 infant samples, 17,569 unique peptides were identified, corresponding to 1,356 proteins. As shown in Figure 2A, we identified three datasets (adult, infant, and common) between the two age groups. A total of 708 proteins were commonly identified in both cohorts; 228 proteins were detected only in the adult samples; and 648 proteins were identified exclusively in infants in our study. The complete list of identified proteins and peptides are provided in Supporting Information.
Figure 1.
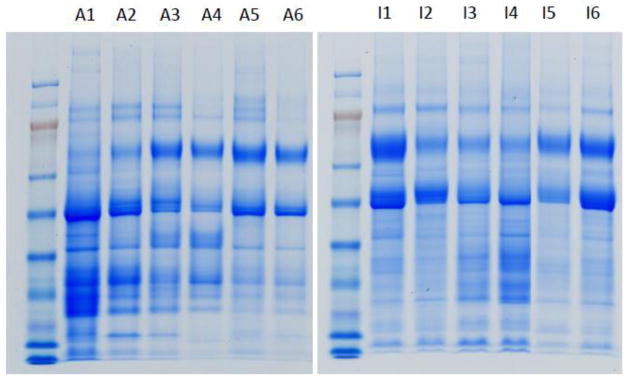
Urinary proteins of 6 adult (A1–A6) and 6 infant (I1–I6) samples separated by SDS-PAGE. The amount of protein loaded on each gel has been normalized to 30 μg.
Figure 2.
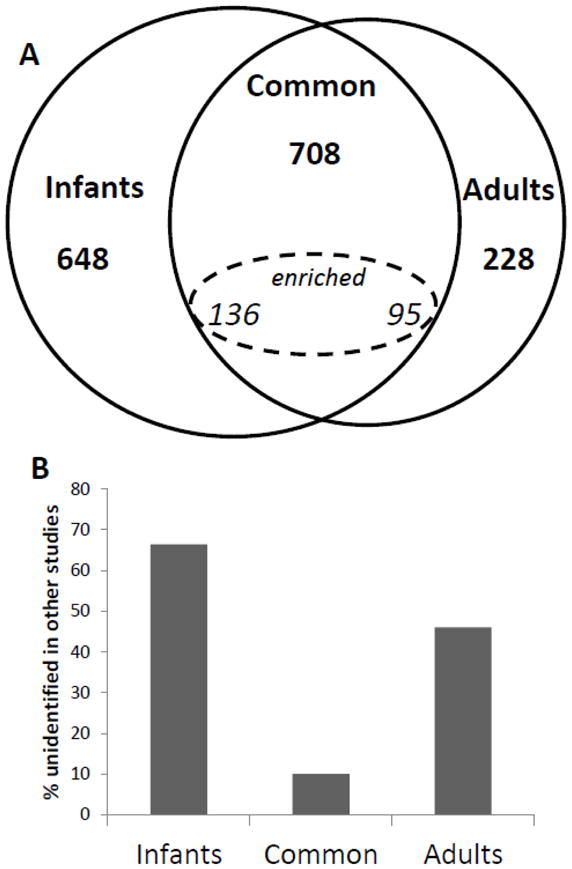
A. Venn diagram of the three urinary subproteomes in our study: adult subproteome, infant subproteome and common subproteome. The subset of commonly identified proteins which were quantitatively enriched in one cohort is also shown.
B. Fractions of adult, infant, and common subproteomes that were not identified in the healthy adult urinary proteomic literature. Sixty-six percent of the infant subproteome was not previously identified in previously published adult urinary proteomics studies.
To further curate the infant-specific dataset, we cross-validated these protein identifications with two other prominent contemporary proteomic studies [5, 6]. These studies interrogated the non-diseased adult urine proteome. When cross-validated with our data, 66% of the proteins identified in our infant-specific subproteome were not identified in these studies, whereas 47% of adult and only 10% of the common proteins were not identified in these studies (Figure 2B). Respectively, this corresponded to 430 infant, 71 common, and 108 Adult entries.
Although it is difficult to prove the absence of a protein in a proteomics experiment, several factors support the infant-specific status assigned in this study. First, a high degree of interpersonal variability supports the identification of unique proteins in a particular age cohort, as even a single identification in the opposite cohort would nullify a proteins status as “unique”. Second, although other studies have achieved comparable or greater depth of the urinary proteome, almost two thirds of the infant-specific proteins identified in this study were not identified in the other studies explored. Third, 64% of the cohort- specific proteins are identified in multiple individuals within a single cohort, further supporting their status as cohort-specific. Supplementary materials present data for the individual proteins separately for facile future reference. Overall, the median relative standard deviation was determined to be.
Considering these factors, the identification of infant-specific proteins posits compelling biological hypotheses for future studies. For example, additional studies on appropriately aged cohorts could identify proteins associated with puberty, or identify markers of normal maturation. Certainly, these data suggest that future studies of urinary biomarkers must be performed with appropriately age-matched controls.
Quantitation of the Common Urinary Proteome and Creation of Age-Specific Subproteomes
A large number of proteins were found in both adults and infants (708) and spectral counting analysis of these proteins indicated that certain common proteins exhibit higher levels of expression between the cohorts studied. The majority of these (478) demonstrated no significant difference in our spectral counting analysis (FDR = 1%). However, 94 proteins were enriched in infant urines and 136 proteins were enriched in adult urines after statistical testing and multiple hypothesis correction. All statistically significant proteins are presented in Table 2, along with their fold-changes.
Table 2.
Proteins identified with statistically significant quantitative values between the two cohorts. Protein accession, protein name, bayes factor, enriched cohort and fold change are listed.
| Accession | Name | Bayes Factor | Enriched Cohort | Fold Change |
|---|---|---|---|---|
| Q7Z3B1 | Neuronal growth regulator 1 | 8.3E+10 | Ad | 10.2 |
| P11279 | Lysosome-associated membrane glycoprotein 1 | 3.2E+07 | Ad | 9.4 |
| P19961 | Alpha-amylase 2B | 7.1E+09 | Ad | 8.9 |
| Q12794 | Hyaluronidase-1 | 9.7E+03 | Ad | 7.2 |
| O75594 | Peptidoglycan recognition protein 1 | 9.9E+05 | Ad | 7.1 |
| P05451 | Lithostathine-1-alpha | 8.7E+04 | Ad | 6.7 |
| Q14315 | Filamin-C | 2.0E+03 | Ad | 6.4 |
| P01859 | Ig gamma-2 chain C region | 1.5E+12 | Ad | 6.1 |
| Q15904 | V-type proton ATPase subunit S1 | 2.9E+03 | Ad | 6.1 |
| Q5IJ48 | Crumbs homolog 2 | 1.7E+02 | Ad | 6.0 |
| B9A064 | Immunoglobulin lambda-like polypeptide 5 | 2.3E+03 | Ad | 5.9 |
| P0C0L5 | Complement C4-B | 3.6E+04 | Ad | 5.9 |
| P01621 | Ig kappa chain V-III region NG9 (Fragment) | 1.5E+02 | Ad | 5.8 |
| Q9BYE9 | Cadherin-related family member 2 | 5.0E+09 | Ad | 5.7 |
| Q5D862 | Filaggrin-2 | 1.2E+05 | Ad | 5.6 |
| Q6P531 | Gamma-glutamyltransferase 6 | 8.5E+01 | Ad | 5.5 |
| P04746 | Pancreatic alpha-amylase | 6.9E+09 | Ad | 5.0 |
| P20138 | Myeloid cell surface antigen CD33 | 5.8E+03 | Ad | 4.9 |
| P19440 | Gamma-glutamyltranspeptidase 1 | 1.1E+06 | Ad | 4.9 |
| P01871 | Ig mu chain C region | 1.7E+03 | Ad | 4.8 |
| P22792 | Carboxypeptidase N subunit 2 | 2.2E+05 | Ad | 4.8 |
| Q9BXP8 | Pappalysin-2 | 5.7E+04 | Ad | 4.7 |
| Q9H6B4 | CXADR-like membrane protein | 6.6E+03 | Ad | 4.6 |
| Q92520 | Protein FAM3C | 1.8E+04 | Ad | 4.6 |
| Q9Y2E5 | Epididymis-specific alpha-mannosidase | 1.1E+04 | Ad | 4.6 |
| Q9HBB8 | Cadherin-related family member 5 | 3.0E+07 | Ad | 4.5 |
| P01619 | Ig kappa chain V-III region B6 | 4.3E+02 | Ad | 4.5 |
| P02788 | Lactotransferrin | 3.3E+03 | Ad | 4.4 |
| Q86UD1 | Out at first protein homolog | 6.6E+02 | Ad | 4.3 |
| P23142-4 | Isoform C of Fibulin-1 | 1.2E+03 | Ad | 4.3 |
| P00915 | Carbonic anhydrase 1 | 3.6E+02 | Ad | 4.2 |
| P31997 | Carcinoembryonic antigen-related cell adhesion molecule 8 | 5.8E+06 | Ad | 4.1 |
| Q8WZ42 | Titin | 9.3E+03 | Ad | 4.0 |
| P39060 | Collagen alpha-1(XVIII) chain | 3.7E+03 | Ad | 4.0 |
| P32004 | Neural cell adhesion molecule L1 | 2.5E+01 | Ad | 4.0 |
| P09603 | Macrophage colony-stimulating factor 1 | 1.2E+10 | Ad | 3.8 |
| P43121 | Cell surface glycoprotein MUC18 | 4.4E+02 | Ad | 3.7 |
| P19801 | Amiloride-sensitive amine oxidase [copper-containing] | 2.2E+05 | Ad | 3.7 |
| O94919 | Endonuclease domain-containing 1 protein | 1.5E+06 | Ad | 3.7 |
| Q15828 | Cystatin-M | 2.9E+03 | Ad | 3.6 |
| Q7Z794 | Keratin, type II cytoskeletal 1b | 1.9E+02 | Ad | 3.4 |
| P07858 | Cathepsin B | 1.2E+02 | Ad | 3.4 |
| P30626 | Sorcin | 8.4E+01 | Ad | 3.4 |
| Q9NPG4 | Protocadherin-12 | 1.2E+02 | Ad | 3.4 |
| P26992 | Ciliary neurotrophic factor receptor subunit alpha | 1.6E+04 | Ad | 3.4 |
| Q00796 | Sorbitol dehydrogenase | 1.6E+03 | Ad | 3.2 |
| P19652 | Alpha-1-acid glycoprotein 2 | 2.8E+02 | Ad | 3.2 |
| P03951 | Coagulation factor XI | 6.2E+01 | Ad | 3.2 |
| P08185 | Corticosteroid-binding globulin | 1.4E+02 | Ad | 3.1 |
| P12273 | Prolactin-inducible protein | 2.4E+02 | Ad | 3.1 |
| Q9NR99 | Matrix-remodeling-associated protein 5 | 1.2E+02 | Ad | 3.1 |
| P00790 | Pepsin A | 1.9E+02 | Ad | 3.0 |
| Q12860 | Contactin-1 | 1.0E+11 | Ad | 3.0 |
| P11597 | Cholesteryl ester transfer protein | 3.3E+02 | Ad | 2.9 |
| Q9UNN8 | Endothelial protein C receptor | 2.1E+08 | Ad | 2.9 |
| P30039 | Phenazine biosynthesis-like domain-containing protein | 1.8E+01 | Ad | 2.9 |
| Q12913 | Receptor-type tyrosine-protein phosphatase eta | 1.8E+04 | Ad | 2.8 |
| P41222 | Prostaglandin-H2 D-isomerase | 4.3E+17 | Ad | 2.7 |
| P01764 | Ig heavy chain V-III region VH26 | 9.8E+01 | Ad | 2.7 |
| Q92673 | Sortilin-related receptor | 4.6E+08 | Ad | 2.6 |
| Q96S96 | Phosphatidylethanolamine-binding protein 4 | 8.0E+01 | Ad | 2.6 |
| P05090 | Apolipoprotein D | 5.0E+16 | Ad | 2.6 |
| O75144 | ICOS ligand | 6.9E+04 | Ad | 2.5 |
| P02649 | Apolipoprotein E | 1.5E+04 | Ad | 2.5 |
| P02750 | Leucine-rich alpha-2-glycoprotein | 2.7E+02 | Ad | 2.5 |
| O14773 | Tripeptidyl-peptidase 1 | 2.0E+05 | Ad | 2.4 |
| P05362 | Intercellular adhesion molecule 1 | 2.4E+01 | Ad | 2.4 |
| P62158 | Calmodulin | 2.2E+01 | Ad | 2.4 |
| Q9HAT2 | Sialate O-acetylesterase | 4.1E+01 | Ad | 2.4 |
| Q86UN3 | Reticulon-4 receptor-like 2 | 6.3E+01 | Ad | 2.4 |
| P04180 | Phosphatidylcholine-sterol acyltransferase | 4.0E+01 | Ad | 2.4 |
| P12821 | Angiotensin-converting enzyme | 9.7E+02 | Ad | 2.4 |
| P01766 | Ig heavy chain V-III region BRO | 5.8E+02 | Ad | 2.4 |
| Q8NBJ4 | Golgi membrane protein 1 | 1.6E+06 | Ad | 2.3 |
| Q7Z4W1 | L-xylulose reductase | 2.1E+01 | Ad | 2.3 |
| P02763 | Alpha-1-acid glycoprotein 1 | 6.1E+04 | Ad | 2.3 |
| Q16651 | Prostasin | 2.2E+08 | Ad | 2.3 |
| P08195 | 4F2 cell-surface antigen heavy chain | 1.3E+07 | Ad | 2.3 |
| P02533 | Keratin, type I cytoskeletal 14 | 7.6E+01 | Ad | 2.2 |
| P08571 | Monocyte differentiation antigen CD14 | 2.5E+07 | Ad | 2.2 |
| P15309 | Prostatic acid phosphatase | 6.7E+09 | Ad | 2.2 |
| Q9UGT4 | Sushi domain-containing protein 2 | 7.8E+04 | Ad | 2.2 |
| P01834 | Ig kappa chain C region | 2.1E+18 | Ad | 2.1 |
| Q07075 | Glutamyl aminopeptidase | 7.6E+01 | Ad | 2.1 |
| P17900 | Ganglioside GM2 activator | 2.4E+01 | Ad | 2.0 |
| P13647 | Keratin, type II cytoskeletal 5 | 8.8E+04 | Ad | 2.0 |
| P07996 | Thrombospondin-1 | 1.3E+02 | Ad | 2.0 |
| Q9NZP8 | Complement C1r subcomponent-like protein | 3.4E+02 | Ad | 2.0 |
| O00241 | Signal-regulatory protein beta-1 | 3.3E+02 | Ad | 2.0 |
| P05543 | Thyroxine-binding globulin | 3.6E+05 | Ad | 2.0 |
| P10153 | Non-secretory ribonuclease | 4.3E+08 | Ad | 1.9 |
| Q16706 | Alpha-mannosidase 2 | 1.3E+03 | Ad | 1.9 |
| O75339 | Cartilage intermediate layer protein 1 | 1.9E+01 | Ad | 1.9 |
| P15586 | N-acetylglucosamine-6-sulfatase | 1.1E+04 | Ad | 1.9 |
| P07998 | Ribonuclease pancreatic | 2.1E+01 | Ad | 1.8 |
| P25311 | Zinc-alpha-2-glycoprotein | 1.0E+07 | Ad | 1.8 |
| P43251 | Biotinidase | 1.4E+04 | Ad | 1.8 |
| P08294 | Extracellular superoxide dismutase [Cu-Zn] | 1.3E+05 | Ad | 1.8 |
| Q6GTX8 | Leukocyte-associated immunoglobulin-like receptor 1 | 1.4E+03 | Ad | 1.8 |
| Q9HB40 | Retinoid-inducible serine carboxypeptidase | 5.4E+01 | Ad | 1.7 |
| Q8IV08 | Phospholipase D3 | 1.3E+03 | Ad | 1.7 |
| O95865 | N(G), N(G)-dimethylarginine dimethylaminohydrolase 2 | 5.2E+02 | Ad | 1.7 |
| O60494 | Cubilin | 7.6E+06 | Ad | 1.7 |
| P16070 | CD44 antigen | 9.7E+05 | Ad | 1.6 |
| Q9Y646 | Plasma glutamate carboxypeptidase | 1.3E+03 | Ad | 1.6 |
| Q6UX06 | Olfactomedin-4 | 2.6E+01 | Ad | 1.6 |
| O00187 | Mannan-binding lectin serine protease 2 | 6.1E+03 | Ad | 1.6 |
| P02766 | Transthyretin | 6.4E+01 | Ad | 1.6 |
| P04264 | Keratin, type II cytoskeletal 1 | 6.3E+10 | Ad | 1.6 |
| P04745 | Alpha-amylase 1 | 7.3E+01 | Ad | 1.6 |
| Q92820 | Gamma-glutamyl hydrolase | 3.5E+02 | Ad | 1.6 |
| Q7Z7M0 | Multiple epidermal growth factor-like domains protein 8 | 1.5E+03 | Ad | 1.6 |
| O00391 | Sulfhydryl oxidase 1 | 1.2E+03 | Ad | 1.6 |
| P19835 | Bile salt-activated lipase | 5.8E+02 | Ad | 1.6 |
| P55290 | Cadherin-13 | 2.4E+05 | Ad | 1.5 |
| Q03154 | Aminoacylase-1 | 2.1E+02 | Ad | 1.5 |
| P06280 | Alpha-galactosidase A | 4.7E+01 | Ad | 1.5 |
| Q96DA0 | Zymogen granule protein 16 homolog B | 6.2E+02 | Ad | 1.5 |
| P00450 | Ceruloplasmin | 3.9E+02 | Ad | 1.5 |
| O95336 | 6-phosphogluconolactonase | 6.9E+01 | Ad | 1.5 |
| P05062 | Fructose-bisphosphate aldolase B | 3.2E+01 | Ad | 1.5 |
| Q8WZ75 | Roundabout homolog 4 | 5.5E+02 | Ad | 1.5 |
| Q14393 | Growth arrest-specific protein 6 | 3.0E+01 | Ad | 1.5 |
| O00468 | Agrin | 6.3E+02 | Ad | 1.4 |
| P01011 | Alpha-1-antichymotrypsin | 1.5E+04 | Ad | 1.4 |
| P10619 | Lysosomal protective protein | 1.0E+02 | Ad | 1.4 |
| P27487 | Dipeptidyl peptidase 4 | 5.3E+01 | Ad | 1.4 |
| P98164 | Low-density lipoprotein receptor-related protein 2 | 7.4E+04 | Ad | 1.4 |
| P35527 | Keratin, type I cytoskeletal 9 | 3.1E+03 | Ad | 1.4 |
| P16870 | Carboxypeptidase E | 9.6E+01 | Ad | 1.4 |
| P08473 | Neprilysin | 4.3E+01 | Ad | 1.4 |
| P16278 | Beta-galactosidase | 2.6E+01 | Ad | 1.4 |
| P30530 | Tyrosine-protein kinase receptor UFO | 2.1E+02 | Ad | 1.4 |
| P10253 | Lysosomal alpha-glucosidase | 7.0E+03 | Ad | 1.3 |
| P05154 | Plasma serine protease inhibitor | 4.3E+01 | Ad | 1.2 |
| P58107 | Epiplakin | 2.2E+01 | Ad | 1.0 |
|
| ||||
| Q99715 | Collagen alpha-1(XII) chain | 1.5E+24 | Inf | 11.2 |
| P01133 | Pro-epidermal growth factor | 1.6E+08 | Inf | 9.8 |
| P08238 | Heat shock protein HSP 90-beta | 3.0E+05 | Inf | 9.1 |
| P14625 | Endoplasmin | 2.9E+06 | Inf | 8.5 |
| P07900-2 | Isoform 2 of Heat shock protein HSP 90-alpha | 3.7E+05 | Inf | 7.6 |
| P12429 | Annexin A3 | 4.5E+04 | Inf | 6.9 |
| P15428 | 15-hydroxyprostaglandin dehydrogenase [NAD+] | 9.4E+02 | Inf | 6.5 |
| P46940 | Ras GTPase-activating-like protein IQGAP1 | 1.6E+05 | Inf | 5.6 |
| P35237 | Serpin B6 | 4.1E+02 | Inf | 5.6 |
| P62805 | Histone H4 | 2.2E+04 | Inf | 5.3 |
| P15313 | V-type proton ATPase subunit B, kidney isoform | 1.1E+03 | Inf | 5.0 |
| P38606 | V-type proton ATPase catalytic subunit A | 3.9E+03 | Inf | 5.0 |
| P07384 | Calpain-1 catalytic subunit | 6.8E+01 | Inf | 4.9 |
| P01034 | Cystatin-C | 2.5E+06 | Inf | 4.9 |
| P21802 | Fibroblast growth factor receptor 2 | 1.2E+03 | Inf | 4.8 |
| Q9Y6W3 | Calpain-7 | 5.3E+02 | Inf | 4.6 |
| P68371 | Tubulin beta-2C chain | 1.4E+03 | Inf | 4.5 |
| P01042 | Kininogen-1 | 1.9E+03 | Inf | 4.5 |
| P29323 | Ephrin type-B receptor 2 | 8.5E+01 | Inf | 4.5 |
| Q00610 | Clathrin heavy chain 1 | 1.2E+03 | Inf | 4.4 |
| P08138 | Tumor necrosis factor receptor superfamily member 16 | 2.1E+03 | Inf | 4.4 |
| O43852 | Calumenin | 8.4E+02 | Inf | 4.4 |
| P13591 | Neural cell adhesion molecule 1 | 1.0E+03 | Inf | 4.4 |
| P48637 | Glutathione synthetase | 4.2E+02 | Inf | 4.4 |
| O43175 | D-3-phosphoglycerate dehydrogenase | 5.1E+01 | Inf | 4.0 |
| P25705 | ATP synthase subunit alpha, mitochondrial | 7.3E+02 | Inf | 4.0 |
| 014818 | Proteasome subunit alpha type-7 | 9.7E+01 | Inf | 3.9 |
| P62937 | Peptidyl-prolyl cis-trans isomerase A | 3.8E+08 | Inf | 3.9 |
| Q05707 | Collagen alpha-1(XIV) chain | 5.5E+06 | Inf | 3.8 |
| Q14204 | Cytoplasmic dynein 1 heavy chain 1 | 9.1E+02 | Inf | 3.8 |
| P05787 | Keratin, type II cytoskeletal 8 | 1.5E+02 | Inf | 3.7 |
| P08107 | Heat shock 70 kDa protein 1A/1B | 7.4E+02 | Inf | 3.5 |
| P04196 | Histidine-rich glycoprotein | 3.9E+01 | Inf | 3.3 |
| P12955 | Xaa-Pro dipeptidase | 6.6E+01 | Inf | 3.3 |
| P50502 | Hsc70-interacting protein | 4.0E+01 | Inf | 3.2 |
| P15121 | Aldose reductase | 5.7E+01 | Inf | 3.2 |
| Q14624 | Inter-alpha-trypsin inhibitor heavy chain H4 | 8.6E+07 | Inf | 3.2 |
| P00338 | L-lactate dehydrogenase A chain | 5.5E+06 | Inf | 3.2 |
| Q9Y5Z4 | Heme-binding protein 2 | 3.4E+01 | Inf | 3.2 |
| P31947 | 14-3-3 protein sigma | 3.6E+01 | Inf | 3.0 |
| Q8TF66-2 | Isoform 2 of Leucine-rich repeat-containing protein 15 | 1.0E+06 | Inf | 2.9 |
| Q8IUL8 | Cartilage intermediate layer protein 2 | 1.0E+09 | Inf | 2.8 |
| P11142 | Heat shock cognate 71 kDa protein | 4.1E+01 | Inf | 2.7 |
| P13798 | Acylamino-acid-releasing enzyme | 4.4E+01 | Inf | 2.6 |
| P10599 | Thioredoxin | 1.7E+01 | Inf | 2.6 |
| P05783 | Keratin, type I cytoskeletal 18 | 2.4E+01 | Inf | 2.6 |
| P00966 | Argininosuccinate synthase | 6.0E+06 | Inf | 2.5 |
| P13645 | Keratin, type I cytoskeletal 10 | 3.8E+01 | Inf | 2.5 |
| P13489 | Ribonuclease inhibitor | 2.7E+01 | Inf | 2.5 |
| O75874 | Isocitrate dehydrogenase [NADP] cytoplasmic | 1.2E+06 | Inf | 2.4 |
| P31431 | Syndecan-4 | 3.3E+02 | Inf | 2.4 |
| P27797 | Calreticulin | 1.9E+01 | Inf | 2.4 |
| Q07507 | Dermatopontin | 5.2E+05 | Inf | 2.4 |
| P00751 | Complement factor B | 2.9E+01 | Inf | 2.4 |
| P04406 | Glyceraldehyde-3-phosphate dehydrogenase | 3.6E+04 | Inf | 2.3 |
| P14618 | Pyruvate kinase isozymes M1/M2 | 1.2E+07 | Inf | 2.3 |
| O00299 | Chloride intracellular channel protein 1 | 8.3E+01 | Inf | 2.3 |
| Q15113 | Procollagen C-endopeptidase enhancer 1 | 1.8E+03 | Inf | 2.2 |
| Q9NZH0 | G-protein coupled receptor family C group 5 member B | 2.3E+05 | Inf | 2.1 |
| P04075 | Fructose-bisphosphate aldolase A | 3.9E+01 | Inf | 2.1 |
| P40121 | Macrophage-capping protein | 3.6E+01 | Inf | 2.1 |
| Q96KP4 | Cytosolic non-specific dipeptidase | 2.7E+04 | Inf | 2.0 |
| P02765 | Alpha-2-HS-glycoprotein | 5.9E+03 | Inf | 2.0 |
| P54793 | Arylsulfatase F | 2.2E+01 | Inf | 2.0 |
| P35579 | Myosin-9 | 1.8E+02 | Inf | 2.0 |
| Q13228 | Selenium-binding protein 1 | 7.7E+04 | Inf | 2.0 |
| P04792 | Heat shock protein beta-1 | 1.8E+02 | Inf | 2.0 |
| P09211 | Glutathione S-transferase P | 2.2E+05 | Inf | 1.9 |
| P22105 | Tenascin-X | 2.3E+01 | Inf | 1.9 |
| P02774 | Vitamin D-binding protein | 5.3E+04 | Inf | 1.9 |
| P23528 | Cofilin-1 | 1.4E+03 | Inf | 1.9 |
| P60174 | Triosephosphate isomerase | 6.1E+03 | Inf | 1.9 |
| P62258 | 14-3-3 protein epsilon | 1.3E+03 | Inf | 1.8 |
| Q9BRK5 | 45 kDa calcium-binding protein | 2.5E+03 | Inf | 1.8 |
| P00558 | Phosphoglycerate kinase 1 | 3.4E+04 | Inf | 1.7 |
| P06733 | Alpha-enolase | 9.2E+02 | Inf | 1.7 |
| P63104 | 14-3-3 protein zeta/delta | 3.5E+01 | Inf | 1.7 |
| Q9BRK3 | Matrix-remodeling-associated protein 8 | 1.5E+06 | Inf | 1.7 |
| P07911 | Uromodulin | 2.0E+17 | Inf | 1.7 |
| Q6UVK1 | Chondroitin sulfate proteoglycan 4 | 8.5E+07 | Inf | 1.6 |
| P12111 | Collagen alpha-3(VI) chain | 1.4E+03 | Inf | 1.6 |
| Q5VW32 | BRO1 domain-containing protein BROX | 1.0E+04 | Inf | 1.6 |
| Q99816 | Tumor susceptibility gene 101 protein | 5.2E+02 | Inf | 1.6 |
| P53990 | IST1 homolog | 7.0E+03 | Inf | 1.6 |
| P15311 | Ezrin | 2.1E+01 | Inf | 1.5 |
| P09467 | Fructose-1,6-bisphosphatase 1 | 4.0E+01 | Inf | 1.5 |
| P04004 | Vitronectin | 7.8E+02 | Inf | 1.5 |
| P07195 | L-lactate dehydrogenase B chain | 8.1E+02 | Inf | 1.5 |
| P02768 | Serum albumin | 1.7E+17 | Inf | 1.5 |
| P30086 | Phosphatidylethanolamine-binding protein 1 | 1.8E+01 | Inf | 1.4 |
| Q8NFZ8 | Cell adhesion molecule 4 | 1.7E+04 | Inf | 1.4 |
| Q99497 | Protein DJ-1 | 1.8E+01 | Inf | 1.4 |
| P06870 | Kallikrein-1 | 1.3E+02 | Inf | 1.4 |
| P12109 | Collagen alpha-1(VI) chain | 1.1E+05 | Inf | 1.3 |
The adult urine was enriched from 3 to 6-fold in several immune system proteins, including Ig gamma-2 chain C, Ig lambda-like polypeptide 5, macrophage colony-stimulating factor 1 and Ig mu chain C. Other adult urine-enriched proteins include proteins originating from the prostate (e.g. prostatic acid phosphatase and prostaglandin-H2 D-isomerase), selected adhesion proteins (Neuronal growth regulator 1, contactin-1, cadherin-2, cadherin-13 and attractin), and some selected circulating proteins from blood (thyroxin binding globulin, alpha-1 antichymotrypsin and ceruloplasmin). In particular, it is not surprising that the male infant has lower concentrations of proteins derived from the prostate considering the lack of maturation of the prostate at one year of age. However, it is too simplistic to say that all proteins which may be synthesized in the prostate are upregulated in adults. For example, epidermal growth factor (EGF) is expressed in the prostate, (among other tissues) however this protein is enriched in the infant cohort approximately 10 fold. This change we are observing in urine is potentially due to EGF being differentially expressed in other maturing tissues, such as the kidney.
The increase of certain adhesion proteins in adults is complicated by the fact that other adhesion proteins are increased in the infant, including dermatopontin (2.4 fold) tenascin-X (1.9 fold), vitronectin (1.5 fold) and cell adhesion molecule 4 (1.4 fold). Previous studies have shown that tenascin-X is present in higher levels in infant serum than adult serum [15]. Proteolysis of vitronectin yields somatomedin-B, a potent growth factor, which interacts with glycosaminoglycans and proteoglycans[16]. Therefore an infant-specific increase of vitronectin and EGF is possibly explained by an increase in cellular growth among this cohort.
This claim is also supported by the increase in several metabolic proteins in infant urine. These include pyruvate kinase isozymes M1/M2, Alpha-enolase, Fructose-biphosphate aldolase A phosphoglycerate kinase 1, fructose-1,6-biphosphate 1, Glyceraldehyde-3-phosphate dehydrogenase, and triosephosphate isomoerase. We postulate that these proteins are enriched in the urine due to increased metabolic activity in the infant cohort.
Cellular and functional characterization of the urinary proteomes based on age
GO characterization of the subproteomes was also performed. Three lists were generated from aggregate qualitative and quantitative proteomic analysis: Infant-specific and enriched proteins, Adult-specific and enriched proteins, and common quantitatively unchanged proteins.
The common and adult subproteomes were enriched in proteins from the extracellular region and plasma membrane, which was in agreement with earlier studies [5, 6]. In contrast, the infant urine-specific subproteome was associated with an increase in intracellular proteins.
GO annotations of the subproteomes also identified functionally enriched categories. Infant urine was enriched in cellular metabolic processes, suggesting an increase in cellular turnover and metabolism. A total of 31 monosaccharide metabolic process proteins were identified in the infant specific or enriched subproteome, while only 8 were expected based on the overall number in the proteome. Taken in concert with the quantitative enrichment of glucose catabolic proteins, a consistent pattern emerges, supporting a proposed increase in metabolism and cell cycle turnover in infants that is reflected in the urinary proteome.
In contrast to the infant, adult urines were enriched in several distinct functional categories. These included peptidase activity (31 entries, 10 expected) polysaccharide binding (14 entries, 2.5 expected), and iron ion homeostasis (6 entries, 0.6 expected). Both the common and the adult subproteomes were functionally enriched in innate and humoral immune response proteins.
To our knowledge, anti-bacterial proteins identified in our data include uromodulin (1.6-fold increase in the infant), lactoferrin (increase in the adult), and neutrophil-assosciated lipocalin (no quantitative change). Also, to our knowledge, the anti-lithiatic proteins include osteopontin (no change), bikunin (a chain of AMBP, no change), prothrombin (no change), Inter-alpha-trypsin inhibitor (no change for H1, H2, H5, H4 up in infants) and calgranulin (S100 proteins, also no change). This suggests that there are negligible differences in these proteins between these cohorts overall, although focused studies may potentially be useful to more fully explore this finding.
Protein Expression Origins
Ultimately, proteins arrive in the urine as a result of complex and varied processes. For example, variations in the urinary proteome could potentially result from an immaturity of infant glomerular and proximal tubular function. Although the pathway of a specific protein into the urine is not always definitive (e.g. blood filtration, renal specific excretion, or lower urinary tract excretion), specific proteins of known provenance are present at similar levels among each cohort. These include abundant circulating plasma proteins, namely Alpha-1-antitrypsin, Complement factor I, hemoglobin, and several others. As these proteins are abundant in plasma and present in each cohort the postulated mechanism of their arrival (e.g. incomplete plasma reabsorption) is likely occurring similarly in each cohort. Furthermore, an examination of the molecular weight distributions of identified proteins (a metric for protein reabsorption) suggests this is the case as there is no molecular weight bias observed between the two cohorts (Supporting Information).
Intracellular proteins are known to be transported into urine, in part, via the formation of urinary exosomes[17]. If there were cohort-specific differences in exosome formation, one might postulate that this is a potential route for intracellular proteins to be differentially expressed into infant urine. To explore possible differences in this regard, our data was compared to an online database, which was formed by the results of two proteomic exosome studies[17, 18]. Of our full set of 1584 proteins, 606 were also identified in the exosome database. Adult proteins had a 46% and infant proteins had a 41% overlap with the exosome data, suggesting there is a negligible qualitative difference for exosome expression globally. Quantitative results also showed negligible differences in exosomal proteins. A total of 354 proteins were identified in both cohorts and also in the exosomal data. Of these, 56 were enriched in the adult and 62 were enriched in the infant, while the majority of proteins (236) were quantitatively unchanged, suggesting very little global quantitative variation of exosomal proteins. Considering our sample preparation methods were not optimized for a study of exosomes[19, 20], an exosome-centric pediatric urinary proteomic study could potentially lend insight into the specific role exosomes may have with regard to the inter-cohort differences observed in the pediatric urinary proteome. Furthermore, as urinary exosome data continues to expand, a clearer trend may emerge between these two cohorts. However, apart from functional enrichment differences in the subproteomes, no obvious systemic expression patterns emerge to explain the varied protein expression differences between these cohorts. Rather, the data presented may best be utilized as a reference for future clinical proteomic biomarker studies. Clearly, these data underscore the importance of age-matched case and control cohorts in urinary proteomic analyses and shed light on important differences in select biological processes between these cohorts.
Spectral counting is only one possible quantitative proteomics methodology. Other MS approaches using internal standards or isotopic labeling could have also been used. These approaches may achieve somewhat lower variances. However, the isotopic labeling reagents add significant financial costs and can potentially introduce systematic bias due to differences in labeling efficiency. In addition, these approaches will not work when the proteomes being compared are qualitatively different, i.e. identify proteins exclusive to one cohort.
Conclusion
This is the first in-depth study of the normal male infant urinary proteome. By comparing it to the urinary proteome of healthy adults, we demonstrated that the male urinary proteome is highly age dependent. We further qualitatively identified a common urinary subproteome and quantitatively determined relative changes in protein abundances between these cohorts. Analysis by GO annotation demonstrated disparate annotations within each age dependent urinary proteome, and identified changes in the enriched subcellular and functional categories in the cohorts. These proteins are involved in compelling biological processes, including metabolism and growth. We hypothesize that the observed proteomic differences reflect differing growth and metabolic states between the adult and infant cohorts. Two known routes of urinary protein expression (incomplete plasma protein reabsorption and exosome formation) showed no systemic differences. The age-specific differences between these proteomes further highlight the importance of understanding the variation among normal, i.e. nondiseased samples to better understand the urinary proteome. In particular, these findings will provide valuable context for future clinical urinary proteomic studies.
Supplementary Material
Highlights.
We analyze 12 adult and infant urine samples to >1500 proteins using MS.
Using spectral counting, we determine over 200 quantitatively varying proteins.
We identify functional differences associated with each cohort.
Differences include metabolism, cellular growth, immune response and adhesion.
These findings are highly relevant for future clinical work on urinary proteomics.
Acknowledgments
We would like to thank the Department of Urology, Boston Children’s Hospital/Harvard Medical School, and Dr. Michael Freeman for their continued guidance and support. This study was supported by funding from NIH K08DK077836 (RSL), the Alexander von Humboldt-Foundation (MK), and a Career Development Award from Boston Children’s Hospital (RSL). The content is solely the responsibility of the authors and does not necessarily represent the official views of the National Institutes of Health.
List of Abbreviations
- LTQ-FT
Linear Trap Quadrupole Fourier Transform
- GeLC-MS
Gel electrophoresis liquid chromatography mass spectrometry
- FDR
False Discovery Rate
- GO
Gene Ontology
- BiNGO
A Biological Network Gene Ontology tool
Footnotes
Publisher's Disclaimer: This is a PDF file of an unedited manuscript that has been accepted for publication. As a service to our customers we are providing this early version of the manuscript. The manuscript will undergo copyediting, typesetting, and review of the resulting proof before it is published in its final citable form. Please note that during the production process errors may be discovered which could affect the content, and all legal disclaimers that apply to the journal pertain.
References
- 1.Decramer S, Gonzalez de Peredo A, Breuil B, Mischak H, Monsarrat B, Bascands JL, Schanstra JP. Urine in clinical proteomics. Mol Cell Proteomics. 2008;7:1850–1862. doi: 10.1074/mcp.R800001-MCP200. [DOI] [PubMed] [Google Scholar]
- 2.Vaezzadeh AR, Steen H, Freeman MR, Lee RS. Proteomics and opportunities for clinical translation in urological disease. J Urol. 2009;182:835–843. doi: 10.1016/j.juro.2009.05.001. [DOI] [PMC free article] [PubMed] [Google Scholar]
- 3.Lee RS, Monigatti F, Briscoe AC, Waldon Z, Freeman MR, Steen H. Optimizing sample handling for urinary proteomics. J Proteome Res. 2008;7:4022–4030. doi: 10.1021/pr800301h. [DOI] [PMC free article] [PubMed] [Google Scholar]
- 4.Julian BA, Suzuki H, Suzuki Y, Tomino Y, Spasovski G, Novak J. Sources of Urinary Proteins and their Analysis by Urinary Proteomics for the Detection of Biomarkers of Disease. Proteomics Clin Appl. 2009;3:1029–1043. doi: 10.1002/prca.200800243. [DOI] [PMC free article] [PubMed] [Google Scholar]
- 5.Adachi J, Kumar C, Zhang Y, Olsen JV, Mann M. The human urinary proteome contains more than 1500 proteins, including a large proportion of membrane proteins. Genome Biol. 2006;7:R80. doi: 10.1186/gb-2006-7-9-r80. [DOI] [PMC free article] [PubMed] [Google Scholar]
- 6.Marimuthu A, O’Meally RN, Chaerkady R, Subbannayya Y, Nanjappa V, Kumar P, Kelkar DS, Pinto SM, Sharma R, Renuse S, Goel R, Christopher R, Delanghe B, Cole RN, Harsha HC, Pandey A. A comprehensive map of the human urinary proteome. J Proteome Res. 2011;10:2734–2743. doi: 10.1021/pr2003038. [DOI] [PMC free article] [PubMed] [Google Scholar]
- 7.Decramer S, Bascands JL, Schanstra JP. Non-invasive markers of ureteropelvic junction obstruction. World J Urol. 2007;25:457–465. doi: 10.1007/s00345-007-0201-8. [DOI] [PubMed] [Google Scholar]
- 8.Khurana M, Traum AZ, Aivado M, Wells MP, Guerrero M, Grall F, Libermann TA, Schachter AD. Urine proteomic profiling of pediatric nephrotic syndrome. Pediatr Nephrol. 2006;21:1257–1265. doi: 10.1007/s00467-006-0165-8. [DOI] [PMC free article] [PubMed] [Google Scholar]
- 9.Lee RS, Monigatti F, Lutchman M, Patterson T, Budnik B, Steen JA, Freeman MR, Steen H. Temporal variations of the postnatal rat urinary proteome as a reflection of systemic maturation. Proteomics. 2008;8:1097–1112. doi: 10.1002/pmic.200700701. [DOI] [PubMed] [Google Scholar]
- 10.Choi H, Nesvizhskii AI. Semisupervised model-based validation of peptide identifications in mass spectrometry-based proteomics. J Proteome Res. 2008;7:254–265. doi: 10.1021/pr070542g. [DOI] [PubMed] [Google Scholar]
- 11.Lundgren DH, Hwang SI, Wu L, Han DK. Role of spectral counting in quantitative proteomics. Expert Rev Proteomics. 2010;7:39–53. doi: 10.1586/epr.09.69. [DOI] [PubMed] [Google Scholar]
- 12.Thongboonkerd V, Chutipongtanate S, Kanlaya R. Systematic evaluation of sample preparation methods for gel-based human urinary proteomics: quantity, quality, and variability. J Proteome Res. 2006;5:183–191. doi: 10.1021/pr0502525. [DOI] [PubMed] [Google Scholar]
- 13.Choi H, Fermin D, Nesvizhskii AI. Significance analysis of spectral count data in label-free shotgun proteomics. Mol Cell Proteomics. 2008;7:2373–2385. doi: 10.1074/mcp.M800203-MCP200. [DOI] [PMC free article] [PubMed] [Google Scholar]
- 14.Maere S, Heymans K, Kuiper M. BiNGO: a Cytoscape plugin to assess overrepresentation of gene ontology categories in biological networks. Bioinformatics. 2005;21:3448–3449. doi: 10.1093/bioinformatics/bti551. [DOI] [PubMed] [Google Scholar]
- 15.Egging DF, Peeters AC, Grebenchtchikov N, Geurts-Moespot A, Sweep CG, den Heijer M, Schalkwijk J. Identification and characterization of multiple species of tenascin-X in human serum. FEBS J. 2007;274:1280–1289. doi: 10.1111/j.1742-4658.2007.05671.x. [DOI] [PubMed] [Google Scholar]
- 16.Seiffert D. The glycosaminoglycan binding site governs ligand binding to the somatomedin B domain of vitronectin. J Biol Chem. 1997;272:9971–9978. doi: 10.1074/jbc.272.15.9971. [DOI] [PubMed] [Google Scholar]
- 17.Pisitkun T, Shen RF, Knepper MA. Identification and proteomic profiling of exosomes in human urine. Proc Natl Acad Sci U S A. 2004;101:13368–13373. doi: 10.1073/pnas.0403453101. [DOI] [PMC free article] [PubMed] [Google Scholar]
- 18.Gonzales PA, Pisitkun T, Hoffert JD, Tchapyjnikov D, Star RA, Kleta R, Wang NS, Knepper MA. Large-scale proteomics and phosphoproteomics of urinary exosomes. J Am Soc Nephrol. 2009;20:363–379. doi: 10.1681/ASN.2008040406. [DOI] [PMC free article] [PubMed] [Google Scholar]
- 19.Gonzales PA, Zhou H, Pisitkun T, Wang NS, Star RA, Knepper MA, Yuen PS. Isolation and purification of exosomes in urine. Methods Mol Biol. 2010;641:89–99. doi: 10.1007/978-1-60761-711-2_6. [DOI] [PubMed] [Google Scholar]
- 20.Zhou H, Yuen PS, Pisitkun T, Gonzales PA, Yasuda H, Dear JW, Gross P, Knepper MA, Star RA. Collection, storage, preservation, and normalization of human urinary exosomes for biomarker discovery. Kidney Int. 2006;69:1471–1476. doi: 10.1038/sj.ki.5000273. [DOI] [PMC free article] [PubMed] [Google Scholar]
Associated Data
This section collects any data citations, data availability statements, or supplementary materials included in this article.