Abstract
Purpose
Low oxygen concentration (hypoxia) in tumors strongly affects their malignant state and resistance to therapy. These effects may be more deleterious in regions undergoing cycling hypoxia. Electron paramagnetic resonance imaging (EPRI) has provided a non-invasive, quantitative imaging modality to investigate static pO2 in vivo. However, to image changing hypoxia, EPRI images with better temporal resolution may be required. The tradeoff between temporal resolution and signal-to-noise ratio (SNR) results in lower SNR for EPRI images with imaging time short enough to resolve cycling hypoxia.
Methods
Principal component analysis (PCA) allows for accelerated image acquisition with acceptable SNR by filtering noise in projection data, from which pO2 images are reconstructed. PCA is used as a denoising technique by including only low-order components to approximate the EPRI projection data.
Results
Simulated and experimental studies show that PCA filtering increases SNR, particularly for small numbers of sub-volumes with changing pO2enabling an order of magnitude increase in temporal resolution with minimal deterioration in spatial resolution or image quality.
Conclusion
The SNR necessary for dynamic EPRI studies with temporal resolution required to investigate cycling hypoxia and its physiological implications is enabled by PCA filtering.
Keywords: Principal Component Analysis, Dynamic, EPR, SNR, Oxygen Imaging, Spin Probe
Introduction
For decades, oxygenation status of tumors has been known to have important prognostic implications (1). Low oxygen concentration (pO2), or hypoxia, imbues cancer cells with resistance to radiation therapy (2, 3) and strong correlation has been found between electrode measurements of low pO2 and radiotherapy treatment failure in humans (4). Hypoxic tumors are more resistant to chemotherapy as well (5). Hypoxia also leads to a more malignant state for cancers, e.g. faster tumor growth due to abnormal proliferation (6), and plays an integral role in increasing the potential for metastatic progression (7).
These implications have led to increased interest in methods for probing and, a fortiori, imaging pO2 deep in tissues. The advances in methods to investigate/image tissue pO2 are detailed in the literature, e.g. (8–11). In particular, electron paramagnetic resonance imaging (EPRI) has proven to be a useful modality for measuring tissue pO2. EPRI noninvasively acquires highly-resolved, both spatially (~1mm3 voxels) and in pO2 (1–3 torr), 3D images of in vivo pO2 (12–16). The low electromagnetic wave excitation frequencies used in EPRI, comparable to 6T MRI, penetrate deep in tissue (>7 cm). EPR pO2 images use an intravenously injected, non-toxic spin probe, which distributes in the extracellular compartment of tumors, to report local pO2 (17).
There are two forms of hypoxia in tumors, resulting from different physiological processes: diffusion limited hypoxia, creating chronically hypoxic regions, too far removed from viable vasculature to receive enough oxygen (18), and perfusion limited hypoxia, creating acutely hypoxic regions. For many years, the former was believed to be the only type of hypoxia present in tumors and the most clinically relevant pO2 parameter. More recent studies have found that perfusion limited hypoxia is also present (19–22) and may even be the major cause of hypoxia in tumors (22, 23). Studies suggest acute hypoxia (sometimes referred to as cycling or transient hypoxia) may be as important a determinant of cancer progression and patient prognosis as chronic hypoxia, although specific correlation of a quantitative measure of cycling hypoxia with treatment outcome is limited. It has been postulated that acute hypoxia may be even more deleterious than chronic hypoxia and therefore more clinically relevant because periods of reoxygenation prevent hypoxia-related cell death and select cells that can proliferate in hostile environments by abrogating normal check point signaling (23–28).
Traditional measurements of tumor hypoxia in vivo have been directed towards chronic hypoxia. Unlike chronic hypoxia studies, data relating transient hypoxia to treatment outcome are rare because methods for noninvasive quantification of transient hypoxia need further development. Current techniques include recessed-tip oxygen microelectrodes (29–31), Oxylite™ probes (32), T2*-weighted MRI (33), 19F MRI(34–36), 18F-FMISO positron emission tomography (PET) (37), as well as EPRI (38, 39). Phosphorescence lifetime imaging in window chamber systems (40) has sensitivity to dynamic oxygenation but is an invasive measurement and not well suited for evaluating the in vivo relationship between oxygen fluctuations and treatment outcome.
Studies have found pO2 fluctuations with periods from minutes to days (22, 28, 40–44). EPRI, heretofore, has provided a means of determining the chronically hypoxic fraction of a tumor, which has been found to predict tumor curability (45). Chronic hypoxia as determined from EPRI has also been validated at the molecular level via correlation to known hypoxia response proteins (46). Note, EPRI obtained over longer times, i.e., with lower temporal resolution, cannot differentiate chronically hypoxic regions from acutely hypoxic regions with an average hypoxic state during imaging, but improved temporal resolution will enable this distinction. Recent studies have already begun to utilize EPRI as a means for imaging temporal changes in pO2 (38, 39, 47). However, our standard EPRI pO2 images take 10 minutes, which may not provide adequate temporal resolution to study higher frequency pO2 fluctuations. Therefore, to investigate spontaneously occurring cycling hypoxia in vivo, our temporal resolution must be improved. Naturally, decreasing imaging time decreases image signal-to-noise ratio (SNR). We have done extensive work to enhance temporal resolution by improving the hardware, data processing, and by using narrower-line deuterated spin probes.
We have investigated improving SNR by post-processing data to reduce noise. A data-processing method that has proven useful as a denoising and/or feature-recognizing technique is principal component analysis (PCA). Sometimes referred to as feature analysis or the Karhunen-Loève transform, PCA has been used for the enhancement and extraction of spatiotemporal features in many different fields, including geoscience (48), facial recognition (49), and astrophysics (50). In particular, PCA has been used to denoise and highlight important temporal features for dynamic medical imaging modalities, e.g. gamma camera studies (51, 52), electro/magneto-encephalography (53), PET (54–56), SPECT (57, 58), and MRI (59–61).
The focus of this paper is to show, through simulations and experiments, that PCA can be used as a pre-reconstruction, spatiotemporal filter for projection data from dynamic EPRI studies. PCA filtering produces images with higher SNR and therefore higher temporal, spatial, and pO2 resolution. These PCA enhanced images will allow dynamic EPRI to be used to investigate important aspects of tumor physiology related to cycling hypoxia.
Methods
Pulsed EPRI Imaging Model
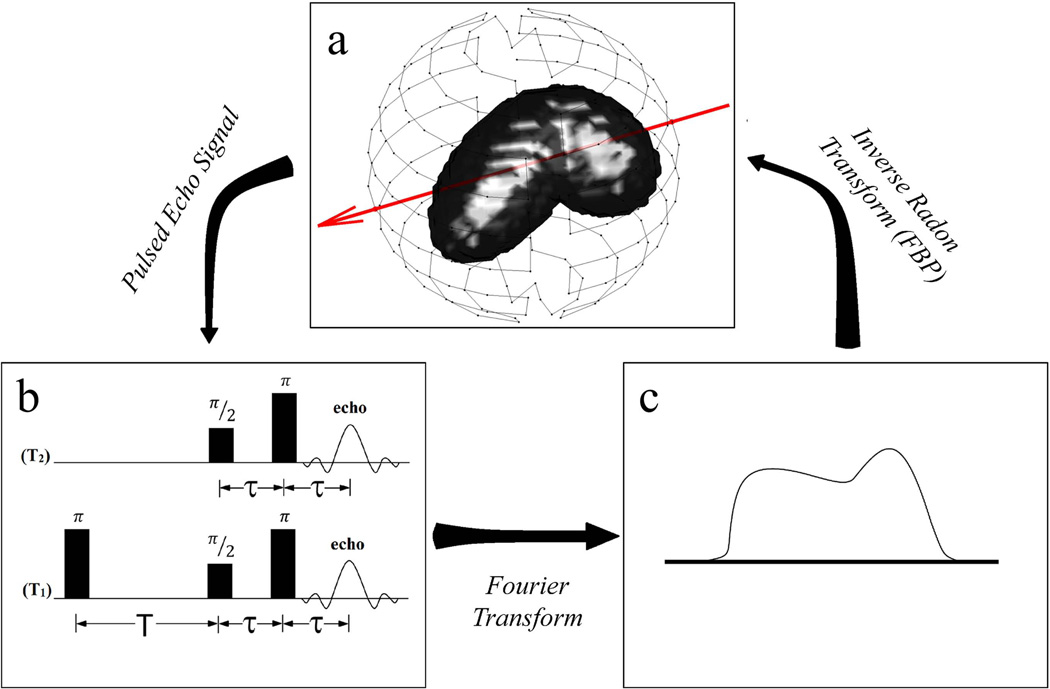
This paper is concerned with PCA applied as a spatiotemporal filter to pulsed EPRI dynamic studies. The pulsed imaging methods developed in our laboratory are detailed elsewhere, starting with electron spin echo or T2-imaging (62) and, more recently, inversion recovery electron spin echo or T1-imaging (63). T1-imaging reduces confounding spin probe concentration dependent self-broadening and provides a near absolute pO2 image. Signal for these EPRI techniques comes from an exogenous spin probe (trityl) (16, 64) with an unpaired electron that is remarkably difficult to reduce, particularly in the in vivo environment. Both T2 and T1 report on the local environment of the unpaired electron. The electron relaxation rates (R2 = 1/T2 and R1 = 1/T1) are linearly related to local pO2. To transition from spectroscopy to imaging, linear magnetic gradients are applied to spatially encode an object. The magnetic gradients are applied along different directions in a spherical geometry to obtain projections (Fig. 1a). The relaxation information is encoded in the signal amplitude of projections obtained with different τ for T2-imaging or T for T1-imaging. The Fourier transform of an acquired time-domain projection (Fig. 1b) is a spatial frequency encoded projection (Fig. 1c). An inverse radon transform, e.g., filtered backprojection, of many spatial projections from different views is used to reconstruct a 3D image of spin-density. For this work, the reconstruction algorithm used was filtered backprojection with a Ram-Lak filter and frequency cutoff at half of the Nyquist frequency for high-frequency noise filtering. Taking a series of 3D images varying τ or T allows for the signal intensity in each voxel to be fit as a function of either τ, using Eq.(1), or T, using Eq.(2), for T2- or T1-imaging respectively, to obtain a 3D image of average voxel T2 (R2) or T1R1), thus providing pO2 for each voxel.
| (1) |
| (2) |
Fig. 1.
Diagram of how a pulsed EPR image is obtained from projections. The red arrow in (a) represents a projection direction defined using linear magnetic gradients. The pulsed echo signal from this projection using one of the pulse sequences shown in (b) gives the time-domain projection and a Fourier transform gives the spatial projection in (c). This is repeated for many projections (represented by points on the sphere in (a)) and an inverse Radon transform (e.g., FBP) produces a 3D image of the spin density in the object.
PCA Algorithm
Principal component analysis is a method for defining, from an n-D data set, a new space based on the covariance of the data, such that the first few basis vectors, or principal components (PCs), form a q-D space (q < n) containing the relevant, highly-correlated features, while the space spanned by the other components contains uncorrelated noise. Therefore, PCA provides a means for low-order approximation of the data by projection onto the subspace spanned by the first q PCs. This low-order approximation using PCA acts as a spatiotemporal noise filter for a high-dimensional set of data from a dynamic EPRI study by separating correlated features from uncorrelated noise and only retaining these correlated features. This procedure will be referred to as PCA filtering and is applied to projection data, producing reduced-noise projections and, subsequently, higher SNR images.
In a dynamic EPRI study, multiple images are acquired consecutively to obtain spatial and temporal pO2 information. For each of these n images, m projections are acquired, each with k points. All m of these projection vectors are concatenated into n total projection vectors, p⃑i (i=1,2,…n). Mean-centered vectors are computed (π⃑i in Eq. (3)) and arranged as the column vectors of length mk in a matrix, X, containing the mean-centered projection data for the entire dynamic study (Eq. (4)). The covariance matrix, Σ, can then be computed from X using equation (5).
| (3) |
| (4) |
| (5) |
The next step is eigenanalysis of Σ. However, Σ is large (m~103 and k~103therefore mk~106) and full eigenanalysis of Σ is not computationally feasible. To alleviate these computational costs, it is assumed that only eigenvectors with non-zero eigenvalues must be calculated and that, at most, there will be r such eigenvectors, where r is the rank of Σ. From equation (5), we know r ≤ min {mk, n}. Therefore, there are assumed to be only n eigenvectors with non-zero eigenvalues, because n is on the order of 101–102 and thus much smaller than mk (49).
The magnitude of the eigenvalues, λj, corresponding to the eigenvectors of Σ, µ⃑j, indicate the relative amount of variance or information in the data lying along the direction defined by the eigenvector or PC. One can define vectors t⃑j = X′u⃑j and use them to express the data matrix X projected onto the orthonormal basis defined by the PCs using equation (6).
| (6) |
The eigenvectors are arranged with higher values of j corresponding to eigenvectors with smaller eigenvalues. Therefore, the sub-space defined by the first few PCs contains most of the information in the original data. This allows for an accurate representation of the data using the low-order approximation from projecting onto the first few PCs, i.e. only summing over the first q terms (q ≪ r) in equation (6). This low-order approximation selectively retains relevant information while discarding uncorrelated noise, thus filtering the data and enhancing SNR.
Simulations
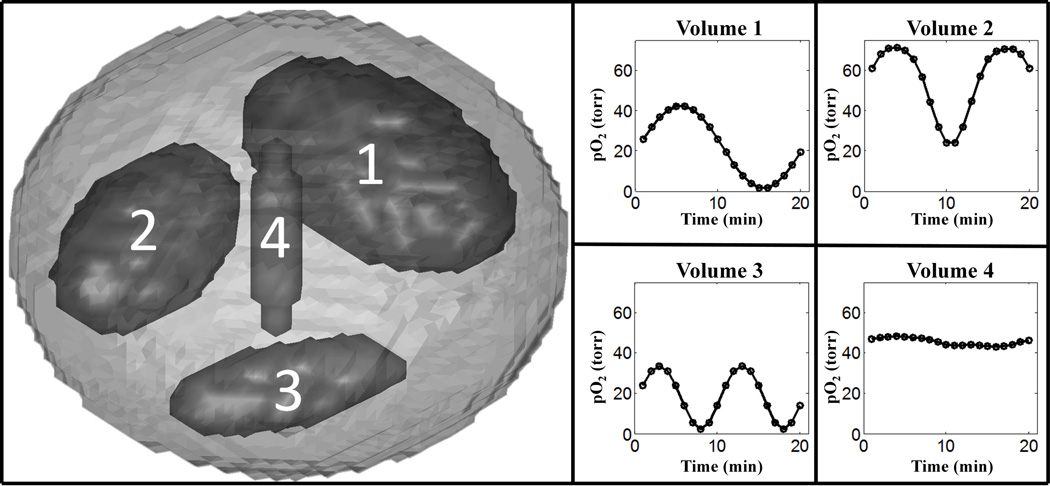
Simulated dynamic EPRI studies evaluated PCA as a method of approximating/filtering the projection data. Simulations allowed for comparison of images reconstructed from approximated noiseless data to images reconstructed from the complete noiseless data, as well as the comparison of unfiltered, noisy images to PCA filtered images with the knowledge of the ideal, noiseless images. Matlab (MathWorks, Massachusetts, USA) simulations were written locally. The digital phantom consisted of a main ellipsoid body and four interior ellipsoid sub-volumes varying in spatial orientation and size. The ellipsoid sub-volumes 1–4 were 8.92%, 4.88%, 1.54%, and 0.06% of the entire phantom volume respectively. The pO2 for each sub-volume could individually be adjusted as necessary and could be made to vary in time (Fig. 2). A second digital phantom consisting of a small cube with pO2 oscillating in time, centered within a larger cube of constant pO2 was also used. A forward projection algorithm simulated projection acquisition with our EPRI technology. These simulated projections were reconstructed using standard protocol.
Fig. 2.
Ellipsoid phantom used for digital simulations of dynamic EPR imaging of pO2 changing in time with labeled ellipsoidal sub-volumes and corresponding patterns of pO2 fluctuations.
Figures of Merit
For noiseless simulations, mean squared error (MSE) measured the fidelity of PCA filtered (approximated) images to images reconstructed from noiseless projections. MSE is defined by Eq. (7), where and Ii are the ith voxels in the PCA filtered and noiseless images respectively, and V is the number of voxels in each image.
| (7) |
For noisy data, SNR was the image quality metric used to compare images with and without PCA filtering applied. Signal was defined as the voxel pO2 from the noiseless image reconstructed using identical conditions. Noise was defined as any deviation from the noiseless image. This definition of noise accounts for random noise as well as artifacts. SNR was calculated by dividing the maximum of the signal by the standard deviation of the noise. Projection SNR and temporal fluctuation SNR were calculated similarly.
Mouse Experiments
Dynamic EPRI studies with live, tumor bearing mice determined the effect of using PCA as a filter in experiments investigating temporal pO2 fluctuations in vivo. The pulsed imaging spectrometer used has been described previously (13). The images from these studies were 64×64×64 voxels3with a voxel size of (0.66 mm3. The EPRI images were registered with spin-echo weighted MRI images, using methods described previously (65), providing anatomic information that EPRI lacks, to delineate tumor from normal tissue.
Two female C3H type mice (Harlan Sprague Dawley Inc., Indianapolis, IN) were used in these experiments. Human mammary tumor cells, MCA4 F6m (M.D. Anderson Hospital, Houston, TX), were implanted in the mid-distal hind legs of the 8 week old mice and grown subcutaneously to an appreciable size (~2 weeks after implantation). To prevent motion during imaging, the animals were immobilized using a soft elastic vinyl polysiloxane dental mold material (GC America Inc., Alsip, IL) and anesthetized with 1–2% isofluorane mixed with medical grade air. Respiration frequency and depth were monitored continuously. A 24 gauge angiocath was used to cannulate the mouse tail vein for i.v. injection of the spin probe. A digital needle probe thermometer (Physitemp, Clifton, NJ) monitored skin temperature. The skin temperature was maintained at ~37° C using adjustable opposed heating lamps.
The first dynamic study implemented forced pO2 fluctuations. The fluctuations were produced by having the anesthetized mouse inhale alternating gases with differing fraction of inspired oxygen (FIO2). The experiment was 1 hour long. The mouse breathed carbogen (95% O2 and 5% CO2) for 5 minutes, followed by air (21% O2) for 5 minutes, repeated for 6 periods. The mouse weighed 22.3g when imaged, and the tumor was ~400µL. Sixty, 1 minute T2-images corrected for spin probe concentration self-broadening bias were acquired.
The second dynamic study was 2 hours long with the anesthetized mouse breathing air. The mouse weighed 25.5g when imaged, and the tumor was ~300µL. Eighty, 1.5 minute T1-images were acquired.
These animal experiments were performed according to the US Public Health Service “Policy on Humane Care and Use of Laboratory Animals” and the protocols were approved by the University of Chicago Institutional Animal Care and Use Committee (ACUP No. 71697). The University of Chicago Animal Resources Center is an AALAC approved animal care facility.
Results
Simulations without Noise
Simulations without noise were used to determine how the number of PCs required to obtain a reasonable approximation of the data depends on the number of differently oscillating volumes. Using the ellipsoid phantom described in the methods section, noiseless simulations were done with 1, 2, or 3 of the sub-volumes fluctuating about different mean pO2 values with different temporal patterns (Fig. 2). Note that, while the number of differently fluctuating sub-volumes was varied, all sub-volumes were present in the imaged object in fixed locations, with non-oscillating sub-volumes having constant pO2 equal to the mean pO2 of their respective pO2 patterns (Fig. 2).
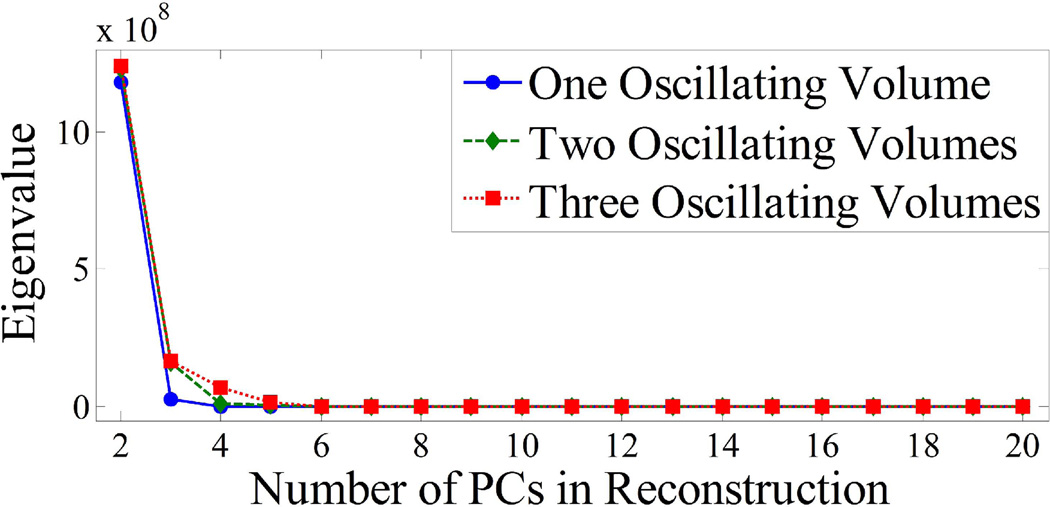
Figure 3 plots the eigenvalues for the three cases. The eigenvalue corresponding to a given PC is proportional to the percentage of total variance in the data accounted for by the PC and is a measure of the relevant information in the data contained along the direction of the PC. The first PC, which contains most of the information and therefore has a significantly higher eigenvalue, is not displayed in Fig. 3 for easier visualization of eigenvalues for higher PCs. For all three cases there is a steep drop in the eigenvalues for higher PCs. The dominant eigenvalues can be visually determined as those separated from the flat portion of the curve: with one volume oscillating, 2 PCs contain essentially all of the information and therefore only 2 terms are needed for the summation in Eq. (6) to sufficiently approximate the data. Similarly, for 2 and 3 oscillating volumes, only 3 and 4 terms or PCs are needed respectively.
Fig. 3.
Eigenvalue distribution for simulated EPRI data varying the number of differently oscillating volumes. The eigenvalue corresponding to the first PC has been omitted for easier visualization of the distribution. Only PCs with corresponding eigenvalues containing a significant percentage of the total variance in the data set (those significantly greater than 0) must be included in the PCA approximation.
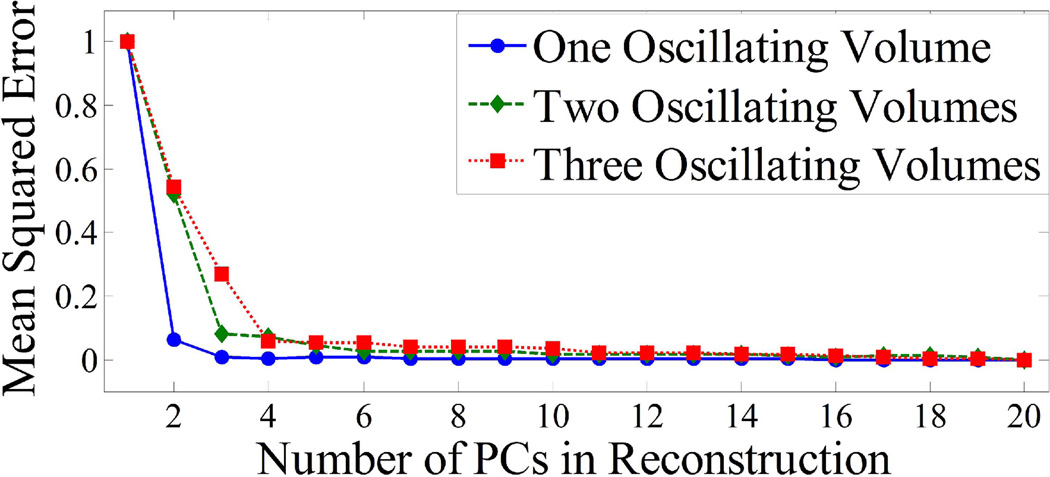
Figure 4 shows the dependence of the MSE between noiseless PCA filtered images and noiseless unfiltered images on the number of PCs used to approximate the projection data. For one oscillating volume, the MSE with 2 PCs in the approximation is 86.3% lower than with 1 PC. With 3 PCs, the MSE is only 1.2% lower than that with 2 PCs. Therefore, the approximation for the case of one oscillating volume is sufficient with 2 PCs. Similar results can be seen in Fig. 4 for two and three oscillating volumes. For two oscillating volumes, the MSE curve flattens out after 3 PCs and for three oscillating volumes this occurs after 4 PCs.
Fig. 4.
Plots of MSE between the PCA filtered images and the true noiseless images, as a function of the number of PCs used for the approximated reconstruction for 1, 2, and 3 differently oscillating volumes. After N+1 PCs are included (N is the number of differently oscillating volumes), it can be seen that there is no appreciable decrease in the MSE.
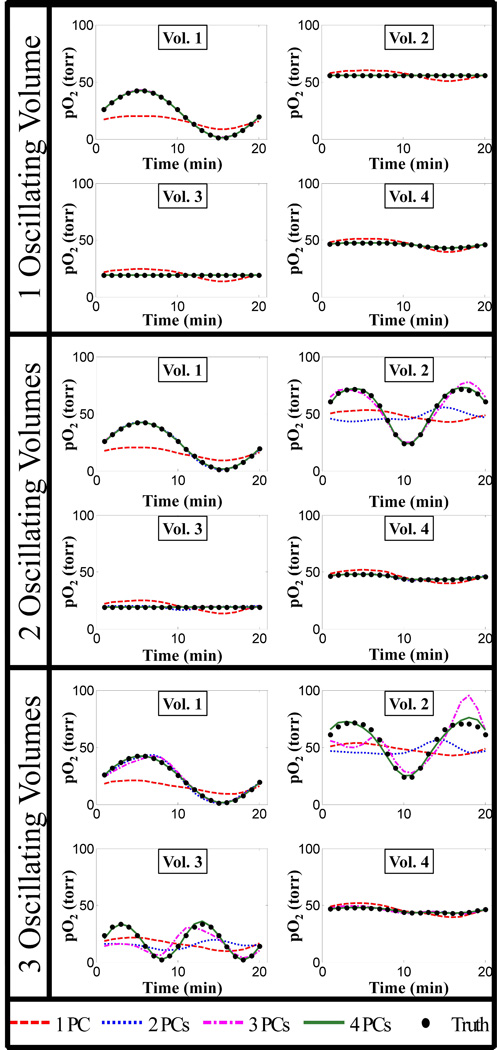
From Fig. 3 and 4, it can be seen that N+1 PCs or terms in Eq. (6) provide the optimal PCA approximation, where N is the number of differently oscillating volumes. Figure 5 further corroborates this by comparing the pO2 oscillations in different volumes with different numbers of PCs used in the PCA approximation to the truth (unfiltered noiseless oscillations) with 1, 2, and 3 differently oscillating volumes.
Fig. 5.
Plots of pO2 fluctuations in the different sub-volumes of the ellipsoid digital phantom from images reconstructed using different numbers of PCs for the PCA approximation. As the number of differently oscillating volumes (N) increases, the number of PCs required for the PCA approximated fluctuations to match the true fluctuations increases as well (N+1 are required). Some curves are not visible because they lie on top of one another.
In the case where there is noise, using more than N+1 terms or PCs will mainly add noise. Therefore, when PCA is applied as a filter for the noisy simulations and real data, only N+1 PCs should be used in the approximation.
Simulations with Noise
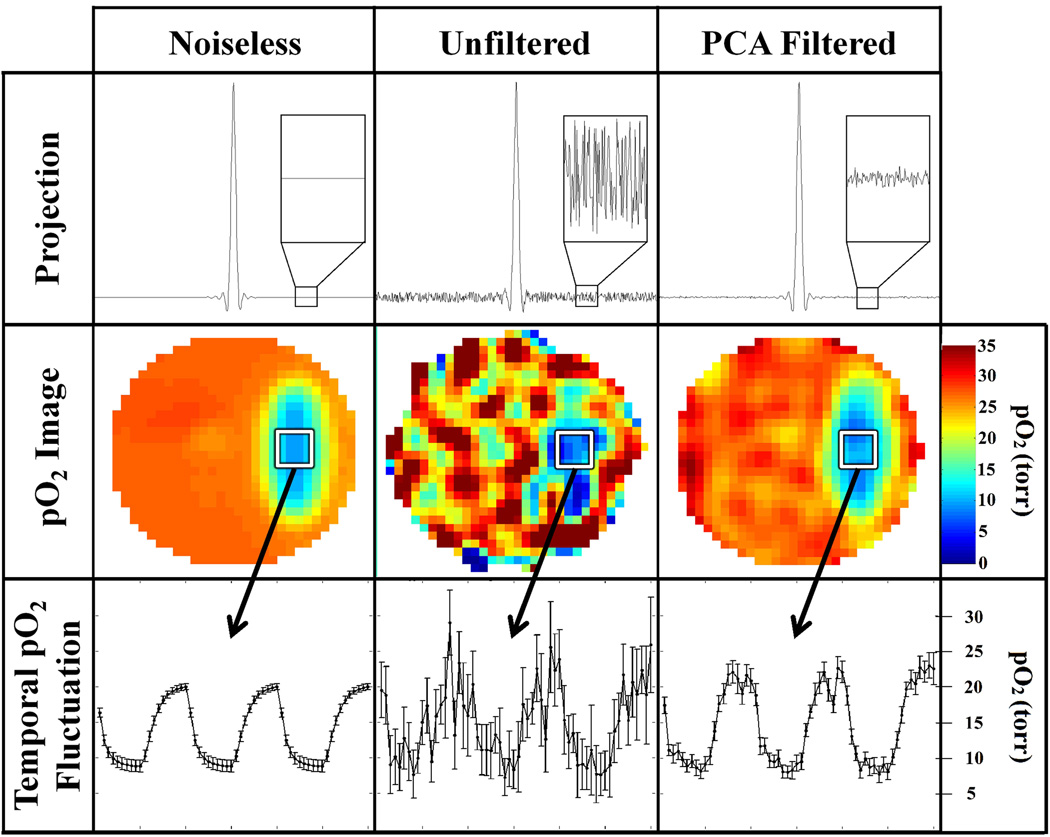
The efficacy of PCA filtering of noisy data was investigated using simulation studies with random Gaussian noise, approximating that of an actual 1 minute EPRI scan, added to the projections. Figure 6 compares the results from a simulated dynamic EPRI study (60 one minute images) without noise, with unfiltered noise, and with PCA filtered noise. In this study, there is one oscillating volume; therefore 2 PCs are used for the PCA approximation. PCA filtering is applied to the projection data and the noise level for the projections decreases by over a factor of 5, resulting in higher quality images. The PCA filtered image is much closer to the noiseless image than the unfiltered image. The image SNR improves by a factor of 3.8 ± 0.6. Higher image quality allows for better visualization of the temporal pO2 fluctuations as can also be seen in Fig. 6. PCA filtering of projections produces a greater improvement in projection SNR compared to the improvement in image SNR. This results from processing/filtering of the projections during reconstruction (e.g., high-frequency noise in the projections is filtered by the half-Nyquist frequency cutoff in the filtered backprojection). This filtering has a more appreciable effect on the unfiltered projections than on the PCA filtered projections and subsequently brings the SNR of unfiltered images closer to that of PCA filtered images.
Fig. 6.
Summary of results from simulated dynamic EPRI study including random noise approximating that seen in experimental data. PCA filtering is applied first to the projection data (first row) and dramatically reduces the noise. The noise level is more obviously depicted in the inset. The projections are used to reconstruct 3D pO2 images using FBP (second row). The filtered images reconstructed from the PCA approximated projection data have higher SNR and resemble the ideal noiseless image more closely than the unfiltered image. The increase in image quality from the PCA filtering results in more accurate visualization of the temporal pO2 fluctuations (third row) seen in the region of interest (ROI) designated by a white square. The correlation between the noiseless and unfiltered noisy temporal pO2 fluctuations is r = 0.82, whereas the correlation between the noiseless and PCA filtered temporal pO2 fluctuations increases to r = 0.98.
Similar simulations were done with 2 and 3 differently oscillating volumes, with 3 and 4 PCs used for the PCA approximation respectively. Adding more PCs ensures that the oscillation patterns from different volumes are reconstructed properly, but includes more noise. Therefore, while SNR is enhanced, the improvement diminishes when more PCs are required for an accurate approximation. Table 1 summarizes the effectiveness of using PCA approximation as a noise filter for different numbers of oscillating volumes. Since the method of calculating SNR depends on absolute signal amplitude and weighting and/or normalization processes occur during image reconstruction, direct comparisons between the columns of Table 1 should not be made.
Table 1.
SNR enhancement from PCA filtering, varying the number of oscillating volumes. SNR is the ratio of signal amplitude to the standard deviation of the difference between noisy data and noiseless data. Qualitatively, the temporal fluctuation SNR can be used as a measure of pO2 error and demonstrates an improvement with the noise reduction from PCA filtering. For the unfiltered data, the amount of noise in the projections and, therefore, image is independent of the number of oscillating volumes.
| Number of Oscillating Volumes |
Projection SNR |
Image SNR | Temporal Fluctuation SNR |
|---|---|---|---|
| 1 (2 PCs) | 282 ± 53 | 48 ± 6 | 26 ± 3 |
| 2 (3 PCs) | 224 ± 33 | 43 ± 5 | 23 ± 2 |
| 3 (4 PCs) | 193 ± 26 | 39 ± 8 | 19 ± 2 |
| Unfiltered | 49.3 ± 0.4 | 12.8 ± 1.2 | 5.5 ± 0.8 |
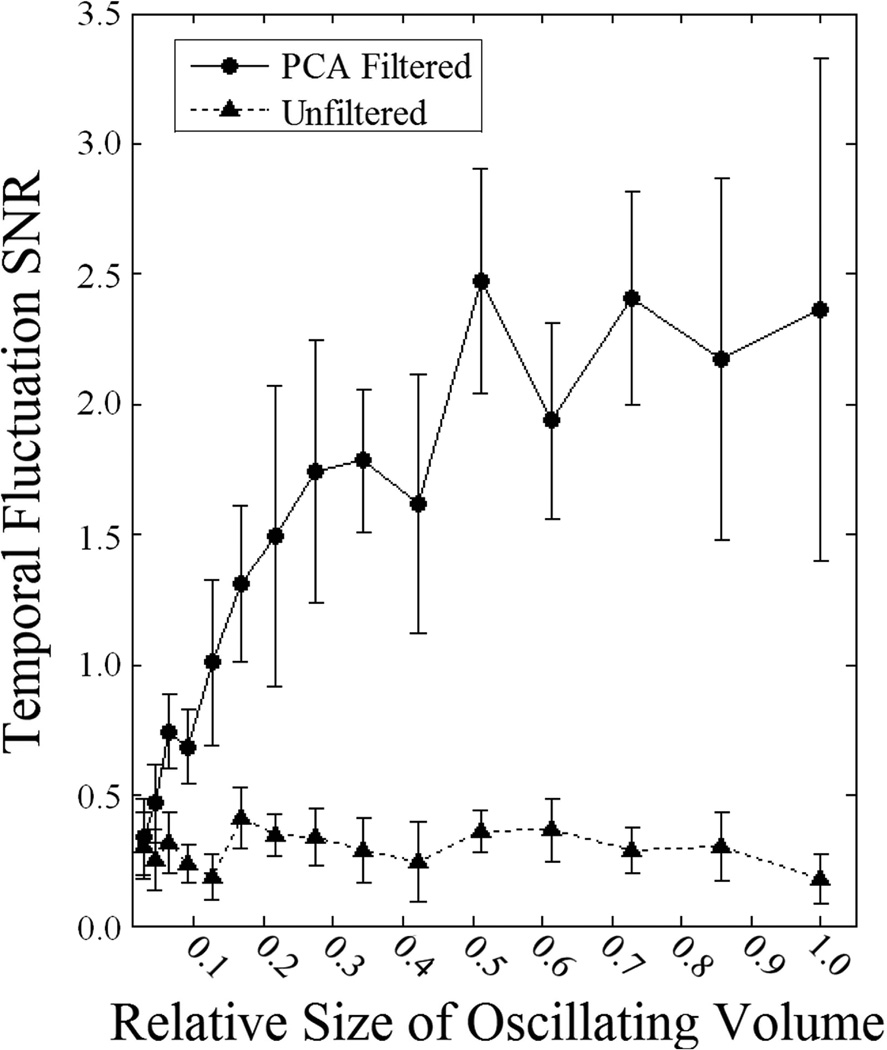
Simulations were also used to determine how PCA filtering performance depends on the relative size/weight of the volume exhibiting the temporal pattern of interest. The digital phantom consisted of an outer cube with sides 20 voxels in length and a smaller cube of varying size centered inside exhibiting sinusoidal temporal pO2 fluctuations. The results of these simulations are shown in Figure 7. The unfiltered data has SNR < 0.5, resulting in the signal being indistinguishable amongst the noise. PCA filtering results in significantly better visualization of the temporal fluctuations (higher temporal fluctuation SNR) when the volume exhibiting the temporal fluctuations is large relative to the total volume. As the fluctuating volume decreases in size so does the effectiveness of PCA filtering until the temporal fluctuation SNR with PCA filtering converges to that without filtering.
Fig. 7.
Plot of the dependence of the temporal fluctuation SNR on the relative size of the oscillating volume. The unfiltered curve does not depend on the relative size of the oscillating volume and stays relatively constant (SNR < 0.5). PCA filtering results in significant improvement of the temporal fluctuation SNR when the oscillating volume is relatively large but as the size of the oscillating volume decreases the curves converge to a common SNR.
Simulations were used to determine how PCA filtering affects image resolution by looking at the reproduction of edges in an image. Ideally, intensity values along a line perpendicular to an edge would follow a step function. In reality, the finite resolution of the imaging system results in blurring, causing intensity values along a line perpendicular to an edge to become sigmoidal. The amount of deviation from a step function is related to the image resolution. Using this as a resolution metric it was found that resolution is unaffected by PCA filtering.
Mouse Images
Dynamic EPRI studies of live mice bearing tumors were conducted to determine the ability of PCA filtering to enhance image quality for non-ideal, experimental data.
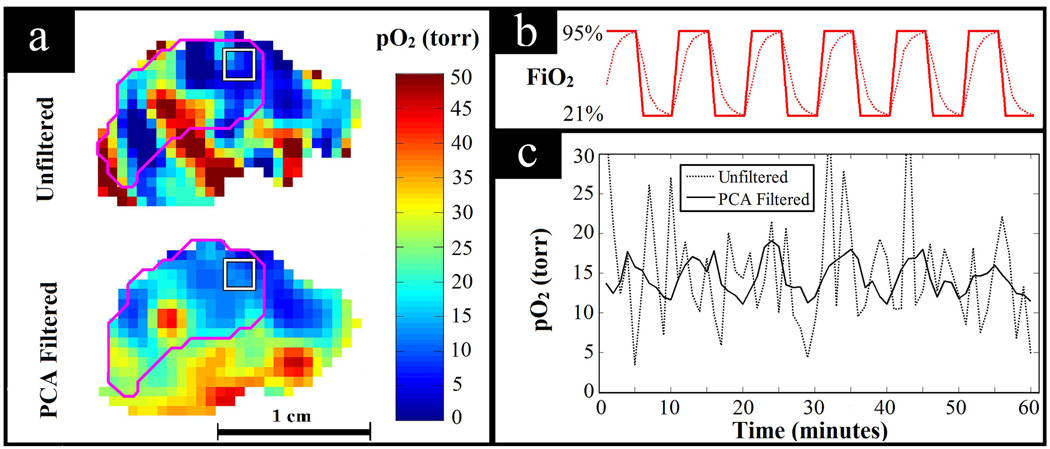
Figure 8 shows the result of PCA filtering data from the study with forced FiO2 fluctuations. Having the mouse breathing normoxic and hyperoxic gases with a fixed period of alternation provides a situation in which the expected pattern of temporal pO2 fluctuations is known. With this knowledge, the ability of PCA filtering to improve SNR while preserving pertinent pO2 fluctuations can be seen in the unperturbed tissue of a living animal. Assuming one dominant mode of fluctuation following the forced FiO2 fluctuation, 2 PCs were used to filter the data. These two PCs contained 92% of the total variance from the original data. Figure 8a shows the increased image SNR with PCA filtering. In Fig. 8b, the bold curve shows the periodic FiO2 fluctuations and the dotted curve shows the expected physiologic response to these fluctuations. The physiologic response to switching breathing gas is not expected to be instantaneous, but rather have some latency, causing exponentially increasing and decreasing tissue pO2. Figure 8c shows an example of the temporal pO2 fluctuation observed in the periphery of the tumor obtained by averaging over the 27 voxel region of interest (ROI). Without filtering, the SNR is too low to discern meaningful pO2 fluctuations. However, when PCA filtered, the data shows the expected physiologic response to the fluctuating FiO2.
Fig. 8.
PCA filtering applied to a dynamic EPRI study with the tumor bearing mouse breathing alternating normoxic and hyperoxic gases. (a) Comparison of image quality for unfiltered and PCA filtered pO2 images. The tumor is outlined in magenta and the 27 voxel ROI is outlined by the white square. (b) Diagram of the breathing gas changing with time, i.e. the forced fluctuations in FiO2. The bold line shows how the breathing gas was actually changed and the dotted line shows the expected response of the tissue pO2 to the alternating breathing gas, assuming physiologic latencies. (c) Observed temporal pO2 fluctuations averaged over the ROI shown. For the unfiltered data, the signal is lost amongst the noise (correlation with expected response: r = 0.13), whereas for the PCA filtered data, the expected fluctuations are clearly seen (correlation with expected response: r = 0.84).
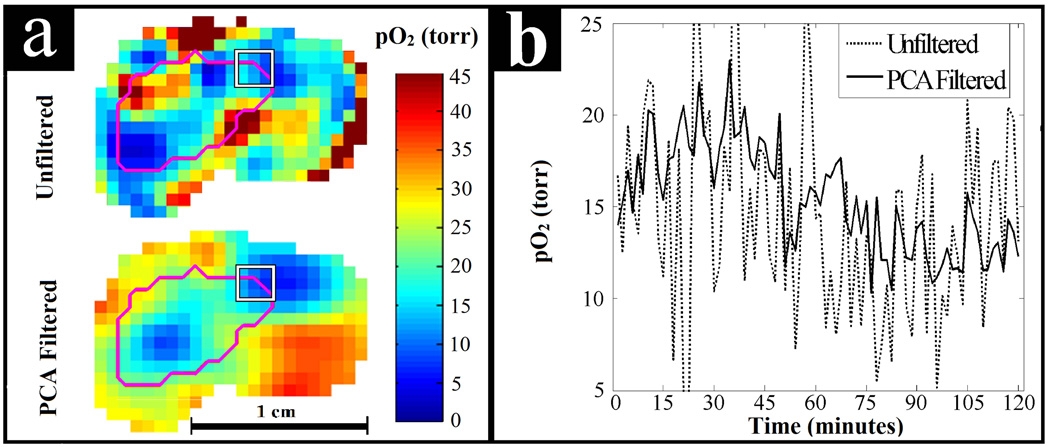
Figure 9 shows the results from the study of the air breathing mouse. Two PCs were used for PCA filtering of the data. Using more than 2 PCs decreased SNR and was not found to help visualize additional patterns of temporal pO2 fluctuations. Similar to the alternating air and carbogen experiment, these two PCs contained 93% of the total variance from the original data. In Fig. 9a the image quality enhancement can be seen. The temporal pO2 fluctuations for the ROI at the periphery of the tumor, highlighted in Fig. 9a, can be seen in Fig. 9b with and without PCA filtering. In this region there appears to be sinusoidal fluctuation of the pO2 with a period of ~2 hours. The unfiltered data shows some semblance of the sinusoidal behavior but PCA filtering elucidates these fluctuations.
Fig. 9.
PCA filtering applied to a dynamic EPRI study of spontaneous pO2 fluctuations in a murine tumor. (a) Comparison of image quality for unfiltered and PCA filtered pO2 images. The tumor is outlined in magenta and the 27 voxel ROI is outlined by the white square. (b) Observed temporal pO2 fluctuations averaged over the ROI shown on the periphery of the tumor. PCA filtering helps to elucidate apparent sinusoidal pO2 fluctuations that are difficult to discern in the unfiltered data. These fluctuations may be biologically relevant cycling or acute hypoxia.
Discussion and Conclusions
PCA approximation of projection data from dynamic EPRI studies is presented as a method for noise filtering and enhanced visualization of cycling hypoxia in tumors. Noiseless simulations show that to use PCA filtering effectively without losing important information, N+1 PCs are needed to approximate the data, where N is the number of differently oscillating volumes. After the first PC, each additional PC included allows accurate visualization of the next dominant pattern of temporal fluctuation, with dominance depending on the relative size of the oscillating volume. This is true regardless of which sub-volumes are oscillating, e.g. if only the smallest sub-volume is oscillating 2 PCs would still accurately approximate the data. Note, spatially separate regions exhibiting a common temporal fluctuation pattern are considered a single oscillating volume, i.e. commonly fluctuating regions need not be adjacent to increase the dominance of their pattern of fluctuation in the PCA based representation of the data. These results apply for any arbitrary temporal pattern. Any pattern represents a unique direction in the PCA defined n-D space. Therefore, for example, if the majority of an object is undergoing low-frequency oscillations and some portions are undergoing these low-frequency oscillations with high-frequency oscillations superimposed, 2 PCs will reproduce the low frequency components for both of the oscillating regions, but to reproduce the high frequency oscillations as well, 3 PCs are required.
Simulated data with random noise approximating that of experimental data showed that incorporating more PCs in the PCA approximation resulted in worse SNR. This is to be expected since noiseless simulations found that using N+1 PCs resulted in an approximation of the data essentially containing the entirety of the signal and therefore, when noise is present, using PCs higher than N+1 should almost solely add noise. This implies that, as N increases and the number of necessary PCs increases, the noise reduction seen from PCA filtering diminishes. However, for the example shown in Fig. 6 with a single oscillating volume, 2 PCs are used and the image SNR is increased by a factor of 3.8. Image SNR is proportional to the square root of the imaging time. Therefore, for this example, using PCA filtering allows for an improvement in temporal resolution by over an order of magnitude while maintaining the image quality of an unfiltered image. PCA filtering provides a means for increasing temporal resolution of dynamic EPRI without decreasing image quality. For the simulations presented here, the noise used was random and uncorrelated. In real EPRI experiments this may not be the case and the noise may have some correlation. Preprocessing methods that could help whiten the noise and remove correlation could improve the efficacy of PCA filtering.
The usefulness of PCA filtering decreases as the relative sizes of the oscillating volumes decrease (Fig. 7). As less of the volume exhibits a certain pattern, the given pattern begins to be considered noise rather than signal by the PCA filtering and is erroneously discarded.
Simulations showed that PCA filtering, unlike many commonly used filters, did not result in image resolution degradation. This suggests that the apparently higher contrast in the unfiltered images seen in Figures 8a and 9a is an artifact of noise. However, while image resolution is unaffected by PCA filtering in the sense that the modulation transfer function is unaffected, dimension reduction may not always be possible without loss of information. Relatively small volumes with important pO2 fluctuations can be considered noise by PCA filtering and may not be resolved. In this respect, PCA filtering affects spatial resolution. These implications must be considered before applying PCA filtering. For situations with dominant regions of signal amongst less-correlated noise, there is no loss of resolution, but in the case of actual physiology there may be small but real temporal fluctuations (represented in the higher PCs) that are unresolved in PCA filtered images.
Presently, how many oscillating volumes to expect in vivo or how large these volumes might be is not definitively known. However, studies suggest that many tumors contain large regions undergoing cycling hypoxia and that, while the spatial distribution and temporal pattern of these fluctuations vary significantly from tumor to tumor, for a single tumor the acutely hypoxic regions tend to have pO2 fluctuations of a common pattern (40, 66). Therefore PCA filtering is particularly suited to enhance dynamic EPRI studies investigating cycling hypoxia, as PCA filtering requires no a priori knowledge of the temporal or spatial pO2 patterns and works well for situations with large portions of the data having similar features and when there are a small number of these features, or in this case, modes of pO2 fluctuation. Preliminary results of PCA filtering applied to dynamic EPRI studies of temporal pO2 fluctuations in murine tumors are promising. PCA filtering works exceptionally well for experiments involving forced fluctuations in pO2 by alternating breathing gas for the mouse between normoxic and hyperoxic (Fig. 8). This experimental paradigm results in pO2 fluctuations in regions with functional vasculature following the periodicity of the controlled FiO2 fluctuations. This is an ideal situation for the application of PCA filtering because there is a single dominant mode of pO2 fluctuation distributed over a large portion of the imaged volume. PCA filtering for the forced pO2 fluctuation experiment appears to be successful in removing noise while preserving the expected pO2 fluctuations.
PCA filtering of dynamic EPRI studies investigating spontaneous cycling hypoxia also has potential. The example presented in this paper (Fig. 9) is an indication that PCA filtering can enhance the visualization of spontaneous temporal pO2 fluctuations using dynamic EPRI, so that cycling hypoxia can be imaged in vivo without perturbing the biologic system being studied. One of the limits to the entire concept of cycling hypoxia has been the limitation of current techniques to quantify the amplitudes of pO2 fluctuations and the volume of the tumor undergoing such fluctuations. This has prevented correlation of these parameters with the effectiveness of anti-cancer therapy. There may even be other pertinent characteristics of cycling hypoxia in addition to amplitude and spatial extent of pO2 fluctuations. The advances presented in this work further enable the evaluation of these characteristics of cycling hypoxia. This evaluation can be obtained non-invasively, allowing for correlation of cycling hypoxia and therapeutic outcome. This, in turn, will begin to disentangle the relationship between chronic and cycling hypoxia, and provide a means for evaluating the role of both forms of hypoxia in therapeutic outcome as well as therapeutic optimization.
Acknowledgments
This work was supported by grants from the NIH (P41 EB002034 and R01 CA98575).
References
- 1.Overgaard J. Hypoxic radiosensitization: adored and ignored. J Clin Oncol. 2007;25(26):4066–4074. doi: 10.1200/JCO.2007.12.7878. [DOI] [PubMed] [Google Scholar]
- 2.Schwarz G. Uber Desensibilisierung gegen Rontgen- und Radiumstrahlen. Munchner Medizinische Wochenschrift. 1909;56:1217–1218. [Google Scholar]
- 3.Hall EJ. Radiobiology for the Radiologist. Philadelphia: Lippincott Williams & Wilkins; 2000. p. 588. [Google Scholar]
- 4.Hockel M, Schlenger K, Aral B, Mitze M, Schaffer U, Vaupel P. Association between tumor hypoxia and malignant progression in advanced cancer of the uterine cervix. Cancer Res. 1996;56(19):4509–4515. [PubMed] [Google Scholar]
- 5.Kennedy KA, Teicher BA, Rockwell S, Sartorelli AC. The hypoxic tumor cell: a target for selective cancer chemotherapy. Biochem Pharmacol. 1980;29(1):1–8. doi: 10.1016/0006-2952(80)90235-x. [DOI] [PubMed] [Google Scholar]
- 6.Carmeliet P, Dor Y, Herbert JM, Fukumura D, Brusselmans K, Dewerchin M, Neeman M, Bono F, Abramovitch R, Maxwell P, Koch CJ, Ratcliffe P, Moons L, Jain RK, Collen D, Keshert E. Role of HIF-1 alpha in hypoxia-mediated apoptosis, cell proliferation and tumour angiogenesis (vol 394, pg 485, 1998) Nature. 1998;395(6701):525–525. doi: 10.1038/28867. [DOI] [PubMed] [Google Scholar]
- 7.Rofstad EK. Microenvironment-induced cancer metastasis. Int J Radiat Biol. 2000;76(5):589–605. doi: 10.1080/095530000138259. [DOI] [PubMed] [Google Scholar]
- 8.Dewhirst MW, Klitzman B, Braun RD, Brizel DM, Haroon ZA, Secomb TW. Review of methods used to study oxygen transport at the microcirculatory level. Int J Cancer. 2000;90(5):237–255. [PubMed] [Google Scholar]
- 9.Zhao DW, Jiang L, Mason RP. Measuring changes in tumor oxygenation. Method Enzymol. 2004;386:378–418. doi: 10.1016/S0076-6879(04)86018-X. [DOI] [PubMed] [Google Scholar]
- 10.Tatum JL. Hypoxia: Importance in tumor biology, noninvasive measurement by imaging, and value of its measurement in the management of cancer therapy. Int J Rad Biol. 2006;82(10):699–757. doi: 10.1080/09553000601002324. [DOI] [PubMed] [Google Scholar]
- 11.Bayer C, Vaupel P. Acute versus chronic hypoxia in tumors: Controversial data concerning time frames and biological consequences. Strahlenther Onkol. 2012;188(7):616–627. doi: 10.1007/s00066-012-0085-4. [DOI] [PubMed] [Google Scholar]
- 12.Elas M. Electron Paramagnetic Resonance Oxygen Images Correlate Spatially and Quantitatively with Oxylite Oxygen Measurements. Clinical Cancer Research. 2006;12(14):4209–4217. doi: 10.1158/1078-0432.CCR-05-0446. [DOI] [PubMed] [Google Scholar]
- 13.Epel B, Sundramoorthy SV, Mailer C, Halpern HJ. A versatile high speed 250-MHz pulse imager for biomedical applications. Concept Magn Reson B. 2008;33B(3):163–176. doi: 10.1002/cmr.b.20119. [DOI] [PMC free article] [PubMed] [Google Scholar]
- 14.Epel BEB, Sundramoorthy SV, Barth ED, Mailer C, Halpern HJ. Comparison of 250 MHz electron spin echo and continuous wave oxygen EPR imaging methods for in vivo applications. Med Phys. 2011;38(4):2045–2052. doi: 10.1118/1.3555297. [DOI] [PMC free article] [PubMed] [Google Scholar]
- 15.Halpern HJ, Epel B, Haney CR, Hleihel D, Wardrip C, Barth ED. Electron paramagnetic resonance oxygen imaging of a rabbit tumor using localized spin probe delivery. Med Phys. 2010;37(6):2553–2559. doi: 10.1118/1.3425787. [DOI] [PMC free article] [PubMed] [Google Scholar]
- 16.Elas M, Williams BB, Parasca A, Mailer C, Pelizzari CA, Lewis MA, River JN, Karczmar GS, Barth ED, Halpern HJ. Quantitative tumor oxymetric images from 4D electron paramagnetic resonance imaging (EPRI): Methodology and comparison with blood oxygen level-dependent (BOLD) MRI. Magn Reson Med. 2003;49(4):682–691. doi: 10.1002/mrm.10408. [DOI] [PubMed] [Google Scholar]
- 17.Golman K, Petersson JS, Ardenkjaer-Larsen JH, Leunbach I, Wistrand LG, Ehnholm G, Liu KC. Dynamic in vivo oxymetry using Overhauser enhanced MR imaging. J Magn Reson Imaging. 2000;12(6):929–938. doi: 10.1002/1522-2586(200012)12:6<929::aid-jmri17>3.0.co;2-j. [DOI] [PubMed] [Google Scholar]
- 18.Thomlinson RH, Gray LH. The histological structure of some human lung cancers and the possible implications for radiotherapy. Br J Radiol. 1955;9:539–563. doi: 10.1038/bjc.1955.55. [DOI] [PMC free article] [PubMed] [Google Scholar]
- 19.Brown JM. Evidence for acutely hypoxic cells in mouse tumors, and a possible mechanism of reoxygenation. Br J Radiol. 1979;52(620):650–656. doi: 10.1259/0007-1285-52-620-650. [DOI] [PubMed] [Google Scholar]
- 20.Chaplin DJ, Olive PL, Durand RE. Intermittent blood flow in a murine tumor:radiobiological effects. Cancer Res. 1987;47(2):597–601. [PubMed] [Google Scholar]
- 21.Trotter MJ, Chaplin DJ, Olive PL. Possible mechanisms for intermittent blood flow in the murine SCCVIIcarcinoma. Int J Rad Biol. 1991;60(1–2):139–146. doi: 10.1080/09553009114551731. [DOI] [PubMed] [Google Scholar]
- 22.Durand RE, Lepard NE. Contribution of transient blood flow to tumor hypoxia in mice. Acta Oncol. 1995;34(3):317–323. doi: 10.3109/02841869509093982. [DOI] [PubMed] [Google Scholar]
- 23.Rofstad EK, Galappathi K, Mathiesen B, Ruud EBM. Fluctuating and diffusion-limited hypoxia in hypoxia-induced metastasis. Clin Cancer Res. 2007;13(7):1971–1978. doi: 10.1158/1078-0432.CCR-06-1967. [DOI] [PubMed] [Google Scholar]
- 24.Glazer PM, Yuan JL. Mutagenesis induced by the tumor microenvironment. Mutat Res. 1998;400(1–2):439–446. doi: 10.1016/s0027-5107(98)00042-6. [DOI] [PubMed] [Google Scholar]
- 25.Durand RE, Aquino-Parsons C. Clinical relevance of intermittent tumour blood flow. Acta Oncol. 2001;40(8):929–936. doi: 10.1080/02841860152708206. [DOI] [PubMed] [Google Scholar]
- 26.Ghafar MA, Anastasiadis AG, Chen M-W, Burchardt M, Olsson LE, Xie H, Benson MC, Buttyan R. Acute hypoxia increases the aggressive characteristics and survival properties of prostate cancer cells. The Prostate. 2003;54(1):58–67. doi: 10.1002/pros.10162. [DOI] [PubMed] [Google Scholar]
- 27.Wouters BG, Koritzinsky M, Magagnin MG, van den Beucken T, Seigneuric R, Savelkouls K, Dostie J, Pyronnet S, Kaufman RJ, Weppler SA, Voncken JW, Lambin P, Koumenis C, Sonenberg N. Gene expression during acute and prolonged hypoxia is regulated by distinct mechanisms of translational control. Embo J. 2006;25(5):1114–1125. doi: 10.1038/sj.emboj.7600998. [DOI] [PMC free article] [PubMed] [Google Scholar]
- 28.Dewhirst MW, Cao Y, Moeller B. Cycling hypoxia and free radicals regulate angiogenesis and radiotherapy response. Nat Rev Cancer. 2008;8(6):425–437. doi: 10.1038/nrc2397. [DOI] [PMC free article] [PubMed] [Google Scholar]
- 29.Braun RD, Lanzen JL, Dewhirst MW. Fourier analysis of fluctuations of oxygen tension and blood flow in R3230Ac tumors and muscle in rats. Am J Physiol. 1999;277(2 Pt 2):H551–H568. doi: 10.1152/ajpheart.1999.277.2.H551. [DOI] [PubMed] [Google Scholar]
- 30.Cardenas-Navia LI. Tumor-dependent kinetics of partial pressure of oxygen fluctuations during air and oxygen breathing. Cancer Res. 2004;64(17):6010–6017. doi: 10.1158/0008-5472.CAN-03-0947. [DOI] [PubMed] [Google Scholar]
- 31.Lanzen J. Direct demonstration of instabilities in oxygen concentrations within the extravascular compartment of an experimental tumor. Cancer Res. 2006;66(4):2219–2223. doi: 10.1158/0008-5472.CAN-03-2958. [DOI] [PubMed] [Google Scholar]
- 32.Brurberg KG, Skogmo HK, Graff BA, Olsen DR, Rofstad EK. Fluctuations in pO2 in poorly and well-oxygenated spontaneous canine tumors before and during fractionated radiation therapy. Radiother Oncol. 2005;77(2):220–226. doi: 10.1016/j.radonc.2005.09.009. [DOI] [PubMed] [Google Scholar]
- 33.Baudelet C, Cron GO, Ansiaux R, Crokart N, DeWever J, Feron O, Gallez B. The role of vessel maturation and vessel functionality in spontaneous fluctuations ofT2*-weighted GRE signal within tumors. NMR Biomed. 2006;19(1):69–76. doi: 10.1002/nbm.1002. [DOI] [PubMed] [Google Scholar]
- 34.Jordan BF, Cron GO, Gallez B. Rapid monitoring of oxygenation by19F magnetic resonance imaging: Simultaneous comparison with fluorescence quenching. Magn Reson Med. 2009;61(3):634–638. doi: 10.1002/mrm.21594. [DOI] [PubMed] [Google Scholar]
- 35.Magat J, Jordan BF, Cron GO, Gallez B. Noninvasive mapping of spontaneous fluctuations in tumor oxygenation using F-19 MRI. Med Phys. 2010;37(10):5434–5441. doi: 10.1118/1.3484056. [DOI] [PubMed] [Google Scholar]
- 36.Zhao D, Constantinescu A, Jiang L, Hahn EW, Mason RP. Prognostic radiology: quantitative assessment of tumor oxygen dynamics by MRI. Am J Clin Oncol. 2001;24(5):462–466. doi: 10.1097/00000421-200110000-00010. [DOI] [PubMed] [Google Scholar]
- 37.Wang K, Yorke E, Nehmeh SA, Humm JL, Ling CC. Modeling acute and chronic hypoxia using serial images of [sup 18]F-FMISO PET. Med Phys. 2009;36(10):4400. doi: 10.1118/1.3213092. [DOI] [PMC free article] [PubMed] [Google Scholar]
- 38.Yasui H, Matsumoto S, Devasahayam N, Munasinghe JP, Choudhuri R, Saito K, Subramanian S, Mitchell JB, Krishna MC. Low-Field Magnetic Resonance Imaging to Visualize Chronic and Cycling Hypoxia in Tumor-Bearing Mice. Cancer Res. 2010;70(16):6427–6436. doi: 10.1158/0008-5472.CAN-10-1350. [DOI] [PMC free article] [PubMed] [Google Scholar]
- 39.Matsumoto S, Yasui H, Mitchell JB, Krishna MC. Imaging cycling tumor hypoxia. Cancer Res. 2010;70(24):10019–10023. doi: 10.1158/0008-5472.CAN-10-2821. [DOI] [PMC free article] [PubMed] [Google Scholar]
- 40.Cardenas-Navia LI, Mace D, Richardson RA, Wilson DF, Shan S, Dewhirst MW. The pervasive presence of fluctuating oxygenation in tumors. Cancer Res. 2008;68(14):5812–5819. doi: 10.1158/0008-5472.CAN-07-6387. [DOI] [PubMed] [Google Scholar]
- 41.Intaglietta M, Myers RR, Gross JF, Reinhold HS. Dynamics of microvascular flow in implanted mouse mammary tumours. Bibl Anat. 1977;15(Pt 1):273–276. [PubMed] [Google Scholar]
- 42.Reinhold HS, Blachiwiecz B, Blok A. Oxygenation and reoxygenation in 'sandwich' tumours. Bibl Anat. 1977;15(Pt 1):270–272. [PubMed] [Google Scholar]
- 43.Kimura H, Braun RD, Ong ET, Hsu R, Secomb TW, Papahadjopoulos D, Hong K, Dewhirst MW. Fluctuations in red cell flux in tumor microvessels can lead to transient hypoxia and reoxygenation in tumor parenchyma. Cancer Res. 1996;56(23):5522–5528. [PubMed] [Google Scholar]
- 44.Pigott KH, Hill SA, Chaplin DJ, Saunders MI. Microregional fluctuations in perfusion within human tumours detected using laser Doppler flowmetry. Radiother Oncol. 1996;40(1):45–50. doi: 10.1016/0167-8140(96)01730-6. [DOI] [PubMed] [Google Scholar]
- 45.Elas M, Bell R, Hleihel D, Barth ED, McFaul C, Haney CR, Bielanska J, Pustelny K, Ahn K-H, Pelizzari CA, Kocherginsky M, Halpern HJ. Electron paramagnetic resonance oxygen image hypoxic fraction plus radiation dose strongly correlates with tumor cure in FSa fibrosarcomas. Int JRadiat Oncol. 2008;71(2):542–549. doi: 10.1016/j.ijrobp.2008.02.022. [DOI] [PMC free article] [PubMed] [Google Scholar]
- 46.Elas M, Hleihel D, Barth ED, Haney CR, Ahn K-H, Pelizzari CA, Epel B, Weichselbaum RR, Halpern HJ. Where it’s at really matters: in situ in vivo vascular endothelial growth factor spatially correlates with electron paramagnetic resonance pO2 images in tumors of living mice. Mol Imaging Biol. 2010;13(6):1107–1113. doi: 10.1007/s11307-010-0436-4. [DOI] [PMC free article] [PubMed] [Google Scholar]
- 47.Matsumoto S, Espey MG, Utsumi H, Devasahayam N, Matsumoto KI, Matsumoto A, Hirata H, Wink DA, Kuppusamy P, Subramanian S, Mitchell JB, Krishna MC. Dynamic monitoring of localized tumor oxygenation changes using RF pulsed electron paramagnetic resonance in conscious mice. Magn Reson Med. 2008;59(3):619–625. doi: 10.1002/mrm.21500. [DOI] [PubMed] [Google Scholar]
- 48.Lee JB, Woodyatt S, Berman M. Enhancement of high spectral resolution remote-sensing data by a noise-adjusted principal components transform. Ieee T Geosci Remote. 1990;28(3):295–304. [Google Scholar]
- 49.Turk M, Pentland A. Eigenfaces for recognition. J Cognitive Neurosci. 1991;3(1):71–86. doi: 10.1162/jocn.1991.3.1.71. [DOI] [PubMed] [Google Scholar]
- 50.Martínez González MJ, Asensio Ramos A, Carroll TA, Kopf M, Ramírez Vélez JC, Semel M. PCA detection and denoising of Zeeman signatures in polarised stellar spectra. Astron Astrophys. 2008;486(2):637–646. [Google Scholar]
- 51.Schmidlin P. Quantitative evaluation and imaging of functions using pattern recognition methods. Phys Med Biol. 1979;24(2):385–395. doi: 10.1088/0031-9155/24/2/014. [DOI] [PubMed] [Google Scholar]
- 52.Samal M, Surova H, Karny M, Marikova E, Michalova K, Dienstbier Z. Enhancement of physiological factors in factor analysis of dynamic studies. Eur J Nucl Med. 1986;12(5–6):280–283. doi: 10.1007/BF00251988. [DOI] [PubMed] [Google Scholar]
- 53.Decheveigne A, Simon J. Denoising based on time-shift PCA. J Neurosci Meth. 2007;165(2):297–305. doi: 10.1016/j.jneumeth.2007.06.003. [DOI] [PMC free article] [PubMed] [Google Scholar]
- 54.Wu HM, Hoh CK, Buxton DB, Kuhle WG, Schelbert HR, Choi Y, Hawkins RA, Phelps ME, Huang SC. Quantification of myocardial blood flow using dynamic nitrogen-13-ammonia pet studies and factor analysis of dynamic structures. J Nucl Med. 1995;36(11):2087–2093. [PubMed] [Google Scholar]
- 55.Kao CM, Yap JT, Mukherjee J, Wernick MN. Image reconstruction for dynamic PET based on low-order approximation and restoration of the sinogram. Ieee T Med Imaging. 1997;16(6):738–749. doi: 10.1109/42.650871. [DOI] [PubMed] [Google Scholar]
- 56.Wernick MN, Infusino EJ, Milosevic M. Fast spatio-temporal image reconstruction for dynamic PET. Ieee T Med Imaging. 1999;18(3):185–195. doi: 10.1109/42.764885. [DOI] [PubMed] [Google Scholar]
- 57.Barber DC. The use of principal components in the quantitative analysis of gamma camera dynamic studies. Phys Med Biol. 1980;25(2):283–292. doi: 10.1088/0031-9155/25/2/008. [DOI] [PubMed] [Google Scholar]
- 58.Narayanan MV, King MA, Soares EJ, Byrne CL, Pretorius PH, Wernick MN. Application of the Karhunen-Loeve transform to 4D reconstruction of cardiac gated SPECT images. Ieee T Nucl Sci. 1999;46(4):1001–1008. [Google Scholar]
- 59.Cao Y, Levin DN. Feature-Recognizing Mri. Magn Reson Med. 1993;30(3):305–317. doi: 10.1002/mrm.1910300306. [DOI] [PubMed] [Google Scholar]
- 60.Cao Y, Levin DN, Yao L. Locally Focused MRI. Magn Reson Med. 1995;34(6):858–867. doi: 10.1002/mrm.1910340611. [DOI] [PubMed] [Google Scholar]
- 61.Martel AL, Moody AR, Allder SJ, Delay GS, Morgan PS. Extracting parametric images from dynamic contrast-enhanced MRI studies of the brain using factor analysis. Med Image Anal. 2001;5(1):29–39. doi: 10.1016/s1361-8415(00)00032-3. [DOI] [PubMed] [Google Scholar]
- 62.Mailer C, Sundramoorthy SV, Pelizzari CA, Halpern HJ. Spin echo spectroscopic electron paramagnetic resonance imaging. Magn Reson Med. 2006;55(4):904–912. doi: 10.1002/mrm.20849. [DOI] [PubMed] [Google Scholar]
- 63.Epel B, Halpern HJ. Comparison of transverse and spin-lattice relaxation based electron paramagnetic resonance oxygen images. Biomedical Imaging: From Nano to Macro; 2011 IEEE International Symposium on Biomedical Imaging Chicago; IEEE Xplore. 2011. pp. 754–757. [Google Scholar]
- 64.Ardenkjaer-Larsen JH, Laursen I, Leunbach I, Ehnholm G, Wistrand LG, Petersson JS, Golman K. EPR and DNP properties of certain novel single electron contrast agents intended for oximetric imaging. J Magn Reson. 1998;133(1):1–12. doi: 10.1006/jmre.1998.1438. [DOI] [PubMed] [Google Scholar]
- 65.Haney CR, Fan X, Parasca AD, Karczmar GS, Halpern HJ, Pelizzari CA. Immobilization using dental material casts facilitates accurate serial and multimodality small animal imaging. Concept Magn Reson B. 2008;33B(2):138–144. doi: 10.1002/cmr.b.20108. [DOI] [PMC free article] [PubMed] [Google Scholar]
- 66.Brurberg KG, Benjaminsen IC, Dorum LM, Rofstad EK. Fluctuations in tumor blood perfusion assessed by dynamic contrast-enhanced MRI. Magn Reson Med. 2007;58(3):473–481. doi: 10.1002/mrm.21367. [DOI] [PubMed] [Google Scholar]


