

Abstract
The budding yeast kinetochore is ~68nm in length with a diameter slightly larger than a 25nm microtubule [1]. The kinetochores from the 16 chromosomes are organized in a stereotypic cluster encircling central spindle microtubules. Quantitative analysis of the inner kinetochore cluster (Cse4, COMA) reveals structural features not apparent in singly attached kinetochores. The cluster of Cse4 containing kinetochores is physically larger perpendicular to the spindle axis relative to the cluster of Ndc80 molecules [2]. If there were a single Cse4 (molecule or nucleosome) at the kinetochore attached to each microtubule plus-end, the cluster of Cse4 would appear geometrically identical to Ndc80. Thus, the structure of the inner kinetochore at the surface of the chromosomes remains unsolved.
We have used point fluorescence microscopy and statistical probability maps [2] to deduce the two dimensional mean position of representative components of the yeast kinetochore relative to the mitotic spindle in metaphase. Comparison of the experimental images to three-dimensional architectures from convolution of mathematical models reveals a pool of Cse4 radially displaced from Cse4 at the kinetochore and kinetochore microtubule plus-ends. The pool of displaced Cse4 can be experimentally depleted in mRNA processing pat1Δ or xrn1Δ mutants. The peripheral Cse4 molecules do not template outer kinetochore components. This study suggests an inner kinetochore plate at the centromere-microtubule interface in budding yeast and yields information on the number of Ndc80 molecules at the microtubule attachment site.
Results
Nanometer resolution of kinetochore proteins in two dimensions reveals structural features of inner vs. outer components
The kinetochores from each sister chromatid biorient to opposite spindle poles and can be visualized as two distinct spots along the mitotic spindle in budding yeast. Each fluorescent spot contains kinetochores from all 16 yeast chromosomes, with one microtubule per kinetochore. To determine the spatial geometry of GFP-tagged kinetochore proteins we compiled a two-dimensional density map of their distribution from a population of metaphase cells (Fig. 1 and S1). The mean spatial distributions of N-Ndc80p, C- Ask1p, C-Nuf2p, C-Spc24p, C-Ame1 (COMA), N-Cse4p, and C-Cep3 (CEN DNA binding factor CBF3) are shown in Fig. 1. At metaphase, the N-terminal microtubule binding domain of Ndc80p is 68 nm from the N-terminus of the centromere-specific histone H3 variant, Cse4p (Fig. 1B). The density maps recapitulate the axial distances determined previously by pairwise centroid mapping [1]. The mean distance of the cluster of kinetochores from each spindle pole decreases about 160nm from metaphase to late anaphase (Fig. 1B). The metaphase and anaphase measurements in Fig. 1B are lined up relative to the N-terminus of Ndc80 to visualize the changes that occur in contraction and expansion of sub-regions within the kinetochore and the centromere binding factor Cep3 (Fig. 1C).
Figure 1. Two-Dimensional Mapping of Representative Kinetochore Proteins and Pericentric Chromatin.

A. The peak intensity (pixel) of clustered kinetochore foci (Ndc80, Ask1, Nuf2, Spc24, Ame1, Cse4 and Cep3), were determined and the coordinates of the brightest pixel of each spot were plotted relative to the spindle pole body (SPB), (0,0)nm. The horizontal bar (white) below the position of each density map indicates the average distance along the x-axis from the spindle pole (SPB red spot). The vertical bar (white) left of the density map indicates the average displacement along the y-axis.
B. The average distance from density maps for representative proteins was determined and plotted relative to the spindle pole body (n=1064 for Ndc80, n=1032 Cse4 and n=~100 for others). Above the axis are distance measurements from metaphase cells (red)(adapted from Fig. S4 in [2]). Below the axis are distance measurements taken from anaphase cells (blue). The kinetochore is approximately 68nm in length from the N-terminus of microtubule binding protein Ndc80p to the N-terminus of the centromere-specific histone H3 variant, Cse4p. The density maps recapitulate the linear distances determined by pairwise centroid mapping (see Fig. S4 in [2]) and allow us to map the average position of components that are larger than diffraction limited spots.
C. The change in kinetochore length (dark green) and centromere proximal chromatin (Cse4-Cep3)(Light green) from metaphase (top) to anaphase (bottom).
See Figure S1 for detailed methodology, Table S1 for assessment of localization accuracy and Table S2 for accuracy of brightest pixel vs. centroid of Gaussian fits.
The statistical probability maps extend information obtained from centroid measurements to a second dimension perpendicular to the spindle axis. Ndc80 is restricted to 94 nm versus the 181 nm spread exhibited by Cse4 (Fig. 2 and S2). The increase in spread of Cse4 as well as Ame1 (COMA complex, Fig. 2) along the y-axis is inconsistent with models placing the centromere nucleosome exclusively at the plus-end of the kinetochore microtubule.
Figure 2. Model convolution recapitulates Ndc80 at microtubule plus-ends but not chromatin bound Cse4.
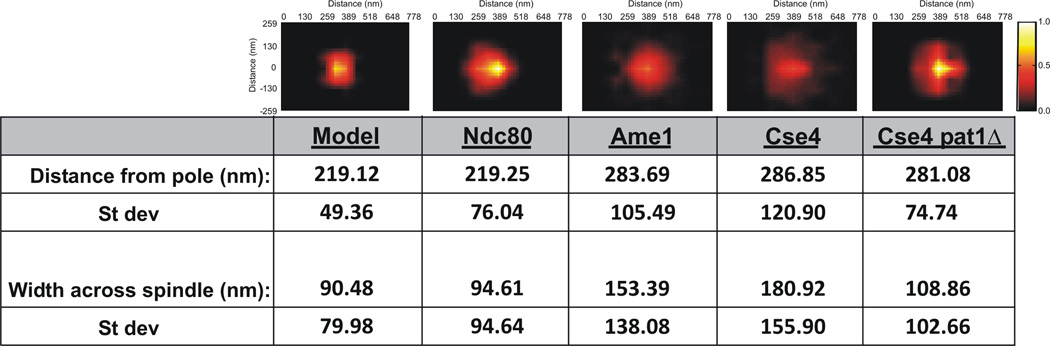
(Top Panels) Statistical probability maps from experimental and simulated images (Model, Ndc80, Ame1, Cse4, Cse4 pat1Δ). (Bottom) Statistical analysis of images. Distance from the pole is the mean distance. The width across the spindle is determined by summing the average distance above and below the spindle axis. As shown in Figure S1 the density maps are mirrored from one quadrant. Experimental density maps for Ndc80 and Cse4 are generated from >1000 images. Simulated density maps (model) and experimental Ame1 and Cse4pat1Δ are generated from >200 images.
See Figure S2 for line scans through the respective probability maps.
To understand the distribution of Cse4 we have used model convolution of a mathematical simulation of the yeast spindle (Stephens et al., 2013). The model is based on stochastic growth and shortening dynamics of spindle and kinetochore microtubules and an EM and tomographic based geometric representation of a cylindrical spindle 250 nm in diameter. The kinetochore microtubule plus-ends approximate the position of Ndc80 from the spindle pole body (Fig. 2, model and Ndc80). Fluorophores placed at the microtubule-plus ends were used to simulate the distribution of Ndc80. Simulated image stacks were convolved and a statistical probability map was generated (Fig. 2, Exp. and suppl. procedures). The width distribution (y-axis) of simulated images is 90±80nm (Fig. 2, Exp. Procedures), comparable to experimental measurements (Fig. 2, Ndc80, 90±80nm). Line scans through Ndc80 images and simulations are indicative of highly similar distributions of the two populations (Fig. S2). Unlike Ndc80, the model fails to predict the spread of Cse4 (181±155 nm) and COMA (153±138 nm) perpendicular to the spindle axis (Fig. 2, line scans Fig. S2).
Genetic requirements for expansion of the inner kinetochore at the chromosome surface
To identify the genetic basis for the distribution of Cse4, we screened several mutants involved in centromere function. A reduction in the radial distribution of Cse4 would transform the appearance of Cse4 in single cells from an anisotropic structure as described by Haase et al., [2] to an isotropic diffraction spot on the spindle axis (Figure 3, inset). Mutants in two genes, Pat1 and Xrn1 altered the appearance of Cse4 (Fig. 3). Line scans through the cluster of Cse4 provide a quantitative measure of the spread perpendicular to the spindle axis (height in y axis, Fig. 3A.) Cse4 spans 660nm in wild-type cells. In contrast, the spread of Cse4 along the y-axis is reduced to 570nm in pat1Δ and 583nm in xrn1Δ. The aspect ratio of the Cse4 cluster (height in y axis/width in x axis) is 1.23 in wild-type versus 1.06 in pat1Δ and xrn1Δ. Pat1 (Protein Associated with Topoisomerase) is a multi-functional protein that regulates the chromatin structure and topological state of centromere [3], as well as providing a scaffold for mRNA decapping [4]. Pat1 is found in cytoplasmic P-bodies where it functions with a number of components including Xrn1, the primary cytoplasmic 5’ to 3’ exonuclease for mRNA degradation [4, 5].
Figure 3. Quantitative Fluorescence and Kinetochore Anisotropy.

A. The height of the cluster of kinetochore proteins was determined from line scans (perpendicular to the spindle axis) through the protein cluster. The height was determined from the full-width full-maximum (FWFM) of the Gaussian distribution. Foci of Cse4-GFP extend perpendicular to the spindle axis (660 nm y axis) compared to outer kinetochore Ndc80-GFP (576 nm y axis). The aspect ratio (height/width) for Cse4 is 1.23 versus 1.07 of Ndc80. The cluster of Cse4 is no longer anisotropic in pat1Δ or xrn1Δ mutants (pat1Δ 570nm, xrn1Δ 583nm, aspect ratio width/height = 1.06). Inset: Deconvolution microscopy of Cse4 in wild-type and pat1Δ mutants. Left, Cse4 (green) appears punctuate upon deconvolution. Arrows mark peaks of bright spots (outer arrows) and dim center (middle dashed arrow). The average outer peak intensity is 352 ± 64 arbitrary units. The average center intensity is 146 ± 35 arbitrary units. The ratio of outer/inner intensity = 2.4. Right, Cse4 in pat1Δ (green) appears as a single spot coincident with the spindle axis (Spindle pole body, red). Scale bars represent 1 μm.
B. The fluorescence intensity of Cse4, Ndc80, and Ame1 in wild-type, pat1Δ or xrn1Δ metaphase cells. There is a 40% decrease in Cse4 at the centromere in the absence of Pat1 and Xrn1. There is 15% decrease of Ndc80 and 10% decrease of Ame1. Whole cell Cse4 fluorescence is not reduced in mutant cells (wt 24,355 a.u., pat1Δ 32516 a.u., xrn1Δ 33,654 a.u. (arbitrary units)). See Fig. S3A for chromatin immunoprecipitation of centromeric Cse4 in the absence of pat1Δ.
The two-dimensional statistical analysis of Cse4 in pat1Δ confirms and extends the single cell analysis. Cse4 in wild-type and pat1Δ cells are within 5nm relative to the spindle pole body (wt 286±120nm, pat1Δ 281±74nm, Fig. 2). The spread of Cse4 perpendicular to the spindle (y-axis) is reduced almost 2-fold in pat1Δ cells (WT, 181±155nm; pat1Δ, 108±102nm Fig. 2). The Pat1-independent pool of Cse4 is more comparable to Ndc80 (95nm) and simulated microtubule plus-ends (90nm)(Fig. 2). The y-axis distribution of Ndc80 remained unchanged in the pat1Δ mutant (Fig. 3A).These data indicate that Cse4 and therefore the centromere nucleosome is focused exclusively at the microtubule plus-end in the absence Pat1. Interestingly, the COMA complex (Ame1) remains anisotropic in the absence of Pat1 (Fig. 3A). Thus the redistribution of Cse4 is not a global change in inner kinetochore structure.
The number of Cse4 molecules is reduced in Pat1Δ mutants
The expansion of Cse4 at the surface of the chromosome in wild-type cells could be accounted for by additional molecules [6, 7] or a single nucleosome that exhibits more freedom of movement relative to outer kinetochore components. To distinguish these possibilities we measured the integrated Cse4-GFP fluorescence intensity in bi-oriented kinetochore clusters in wildtype and pat1Δ cells [7]. The concentration of the cluster of Cse4 in metaphase is reduced 40% in pat1Δ and xrn1Δ mutants (Fig. 3B). This reduction represents the loss on average of 2–2.5 molecules, leaving ~3 Cse4 molecules at the kinetochore. Accordingly, ChIP experiments showed a ~60% reduction in CEN-associated Cse4 in pat1Δ (0.72% at CEN1, 0.80% at CEN3, and 0.53% at CEN5) versus wildtype (2.02% at CEN1, 1.92% at CEN3, and 1.59% at CEN5) (Fig. S3A). Thus Pat1 and Xrn1 are required for the full complement of Cse4 at the yeast kinetochore, and further, there is an excess of Cse4 molecules beyond that needed for proper attachment. The reduction in Cse4 fluorescence in pat1Δ and xrn1Δ mutants excludes the possibility of a single Cse4 in each of the 16 kinetochores clustered around the spindle microtubules [8].
Accessory Cse4 molecules do not nucleate kinetochore assembly
The dependence of Cse4 on Pat1 and Xrn1 provides the opportunity to determine whether excess Cse4 nucleate the assembly of outer kinetochore components. The quantity of Ndc80 and Ame1 (COMA) remain within 85% of their wild-type level in the absence of Pat1 (Fig. 3B). The number of Ndc80 molecules per core Cse4 is ~17, consistent with measurements in chicken DT-40 (~19)[7, 9] and Hela cells (~17, Suzuki and Salmon unpublished). Accessory Cse4 molecules do not contribute to the assembly of outer kinetochore components.
Loss of peripheral Cse4 results in cell cycle delay
Pat1Δ mutant cells lacking peripheral Cse4 exhibit a delay of about 40min in cell cycle progression and Pds1 degradation (Fig. S3B, C). The bulk of Pat1 is present in dispersed cytoplasmic foci (P-bodies) [10] (Pat1-GFP, Fig. S4), but nuclear accumulation has been reported in lsm1Δ cells [10]. Quantitative RT-PCR reveals that levels of Cse4 mRNA are unchanged in wildtype vs. pat1Δ mutants (Fig. S3D). This is consistent with whole cell Cse4 protein fluorescence measurements in wildtype, pat1Δ and xrn1Δ mutants (Fig. 3B). Therefore, it is unlikely that Pat1 function at centromere proceeds through regulation of Cse4 mRNA [3].
Model convolution to estimate the position of accessory Cse4 molecules
If the additional Cse4 molecules are not at kinetochore plus ends, it should be possible to deduce their spatial position using model convolution to match experimental observations. Toward this end we generated the distribution of kinetochore microtubule lengths (along the x-axis) derived from the mathematical model that best fit Ndc80 (Fig. 2). Instead of mapping these lengths directly onto kinetochore microtubules, we allow the fluorophores to explore a larger area perpendicular to the spindle axis (see blue probability bubble in Fig. 4). If all Cse4 molecules explore positions distant from the microtubule plus-end, the model fails to match experimental images (data not shown). The geometry that best matches experimental images is a single fluorophore at the kinetochore microtubule attachment site and 3–4 radially displaced molecules (Fig. 4). This result is visually represented in Figure 4 where we have clustered 16 kinetochores and their individual probability bubbles around the central spindle (Fig. 4 1X and 16X). Note that the inner kinetochore (blue) appears anisotropic relative to outer components (Ndc80, orange rods at microtubule plus-ends), with dimensions that match experimental (Fig. 2). The radial displacement from the microtubule plus-end required to match anisotropy and the statistical probability maps for wild-type Cse4 is ~250nm. Cse4 in the pat1Δ mutant appears dimmer and isotropic in experimental (Fig. 2, 3) and matches the distribution of Ndc80 and microtubule plus ends (16X pat1Δ, Fig. 4). Thus in wild-type cells, there is a Cse4 core at microtubule plus-ends, while additional Cse4 molecules as well as COMA (Ame1), form a disc on the surface of the pericentromere at the interface of the microtubule attachment site. The diameter of the disc is comparable to the diameter of the cohesin barrel (Fig. 4)[11].
Figure 4. The inner kinetochore is organized into a disc at the surface of the pericentric chromatin in mitosis.

The pericentromere DNA is organized as a network of loops with the centromere DNA at the apex (DNA strands shown as strings of nucleosomes in gray) [11, 14, 23]. The centromere is attached to microtubule plus-ends via the kinetochore (orange barbells surrounding the microtubule in green). Cohesin (red) and condensin (yellow) are enriched in the pericentromere and surround the central spindle [14, 23]. A single pericentric region (one sister) is shown (1X). In metaphase centromeres from the 16 chromosomes are clustered around 16 kinetochore microtubules that emanate from the spindle pole body (16X, below). 4 interpolar microtubules extend to overlap with 4 interpolar from the opposite spindle pole body (not shown). Only the section of the pericentric barrel at the interface of the kinetochore microtubules is shown for clarity. In wild-type, a Cse4 molecule (pink ball) resides at the centromere DNA (apex of the loop)(see 1X, wild-type). Accessory molecules (Pat1 dependent) are in the vicinity, represented as a probability bubble (graded blue oval) at the microtubule plus-end. The emergent spatial arrangement upon clustering of 16 kinetochores (16X) predicts the anisotropy and experimentally generated statistical maps. The width of the density map for a single molecule Cse4 at each CEN and 4 molecules with a probability bubble 550nm around the spindle is 190 ± 141nm (data not shown). This distribution is commensurate with the intensity measurements of deconvolved Cse4 images (Fig. 3, inset). Wild-type density maps of Cse4 have a width of 181 ± 155nm (Fig. 3). In pat1Δ mutants, the accessory molecules are absent, and the remaining Cse4 resides at the kinetochore microtubule plus-end (blue circles, pat1Δ). The predicted geometry in the pat1Δ matches the isotropy and experimentally generated statistical maps (Fig. 2). This arrangement suggests that Cse4 and other inner kinetochore components constitute an inner plate at the chromatin, much like that observed in the trilaminar structure at the chromosome surface of a mammalian kinetochore.
Discussion
The organization of the inner kinetochore at the chromosome interface is poorly understood. The inner kinetochore is distinct from the outer kinetochore as determined by the oblate geometry of Cse4 and the COMA complex (Ame1)(Fig. 2B) [2]. This geometry has not been predicted by either in vivo [1] or in vitro [12] structural models of the kinetochore. By reducing the number of Cse4 molecules in the cluster of 16 kinetochores via deletion of Pat1 and Xrn1, we define a core Cse4 complex of approximately 2–3 molecules/kinetochore in geometric alignment with the outer kinetochore. The peripheral Cse4 molecules are displaced laterally from the kinetochore hub at microtubule plus-ends. Using mathematical models and model convolution to assess geometries that match experimental observations [13, 14], we find the accessory molecules most likely reside on the surface of the chromosome and are radially confined by the dimension of the cohesin barrel (~500nm diameter)(Fig. 4 wildtype). The inner kinetochore represents the molecular interface between chromatin and spindle microtubules. This arrangement indicates that Cse4 and other inner kinetochore components including COMA constitute a chromatin plate of the inner kinetochore, much like that observed in the trilaminar structure at the chromosome surface of a mammalian kinetochore [15].
The centromere specific nucleosome represents 1/5000 of total nucleosomes. The apparent confinement of excess Cse4 molecules to the vicinity of the kinetochore allows for rapid incorporation of Cse4 in the event of eviction at the centromere. The nucleosomes in the pericentric region are dynamic [16], with the balance between eviction and insertion modulated by chromatin remodelers including at least STH1/NPS1 and ISW2. While the centromere histone is stable in metaphase [17] the loss of a single nucleosome (1/16) would be catastrophic and below the sensitivity of Pearson et al., [17]. The proposal that a pool of Cse4 is important for these rogue loss events is reminiscent of the abundance of Sir2 proteins at telomeres [18]. Gasser et al., [18] proposed a mechanism, known in enzymology as the Circe effect [19], in which a local ligand is enriched relative to the binding site.
These accessory molecules may or may not be incorporated into chromatin, consistent with their absence from the deep sequencing efforts [20]. In addition, the observed variability in centromeric Cse4 protein number from strain to strain [7] is also consistent with a variable number of accessory Cse4 flanking the CEN. Finally, these accessory molecules will not be observed on single kinetochores of lagging chromosomes or dicentric chromosomes in anaphase after destruction of the cohesin barrel. We expect that only the core Cse4 molecules would be observed on lagging chromosomes or dicentric chromosomes. The proposal that a small number of molecules in a reservoir “ready for action” is not new to the field of enzymology [19]. The discovery of an inner kinetochore plate at the surface of the pericentric chromatin furthers the proposal for the yeast spindle as a model for a single mammalian kinetochore.
Experimental Procedures
Image Analysis
Yeast cells containing spindle pole body proteins (Spc29-RFP) and kinetochore components (fused to GFP) were imaged on a Nikon TE2000, wide-field, 100X 1.4 NA Orca II, with MetaMorph software. Images are aligned in Matlab (2010b) by taking the brightest pixel for one spindle pole and rotating the spindle until the second spindle pole is horizontal to the first. Spindles are used with a length range of 1.4–1.6 microns. The position in Z is taken into account.
Once the spindle is aligned, the GFP spots are rotated to the same degree. We find the brightest pixel and this is converted to a distance based on the pixel size (65nm). Prior to taking a measurement, the offset (in x,y) is adjusted based on the measured offset using fluorescent beads to calibrate the instrument. The poles are set at 0, 0 and the measurements are taken relative to the pole. Absolute numbers are used to place all positions in one quadrant (+, +) relative to the spindle pole.
Deconvolution
Images (13planes, 200nm apart, unbinned) were deconvolved using Huygens Compute engine 4.1.0 (Scientific Volume Imaging, Hilversum, Netherlands) and background was subtracted using MetaMorph Imaging. Quantitative fluorescence intensity using the box within a box method for background subtraction was determined as previously described [2, 21].
Simulation of spindle pole and kinetochore images
The MATLAB/Simulink model was run to produce an output file containing a population measurements of spindle length and the lengths of 16 left and 16 right kMTs [14]. This csv file of lengths was then converted to xml files using a MATLAB code to build the geometric bipolar spindle by specifying the geometry of the kMT arrangement (250nm diameter radial array, [22]). Spindle poles were labeled red and the 32 kMT plus-ends (kinetochores) were labeled green in the simulation. Geometric spindle xml files were convolved with the point spread function (PSF) of our microscope using Microscope simulator 2.2.1 ([13, 14] http://cismm.cs.unc.edu/downloads/). Experimentally obtained background (offset), noise variation (Gaussian standard deviation of noise), and maximum intensity (gain) were used in simulations. Simulated images of kinetochore clusters were analyzed in the same manner as experimentally acquired images to produce position probability density maps.
Supplementary Material
Highlights.
16 yeast centromeres are analogous to a single mammalian centromere
An ensemble of 16 inner kinetochores resides at the surface of the chromosome
Resolution of the Cse4 counting controversy
The centromere Circe effect
Acknowledgements
We thank the members of the Bloom laboratory as well as the centromere community for productive and open scientific discourse. This work was supported by NIH R37 GM32238 to K. B. and NIH P41 EB002025 to RMT, II (Center for Computer Integrated Systems for Microscopy and Manipulation. Support for MAB and PKM was provided by the Intramural Research Program of the National Cancer Institute, National Institutes of Health.
Footnotes
Publisher's Disclaimer: This is a PDF file of an unedited manuscript that has been accepted for publication. As a service to our customers we are providing this early version of the manuscript. The manuscript will undergo copyediting, typesetting, and review of the resulting proof before it is published in its final citable form. Please note that during the production process errors may be discovered which could affect the content, and all legal disclaimers that apply to the journal pertain.
Please see the extended experimental procedures, available online, for a table of strains used in this study.
References
- 1.Joglekar AP, Bloom K, Salmon ED. In vivo protein architecture of the eukaryotic kinetochore with nanometer scale accuracy. Curr Biol. 2009;19:694–699. doi: 10.1016/j.cub.2009.02.056. [DOI] [PMC free article] [PubMed] [Google Scholar]
- 2.Haase J, Stephens A, Verdaasdonk J, Yeh E, Bloom K. Bub1 kinase and Sgo1 modulate pericentric chromatin in response to altered microtubule dynamics. Curr Biol. 2012;22:471–481. doi: 10.1016/j.cub.2012.02.006. [DOI] [PMC free article] [PubMed] [Google Scholar]
- 3.Mishra PK, Ottmann AR, Basrai M. Structural integrity of centromeric chromatin and faithful chromosome segregation requires Pat1. Genetics. 2013 doi: 10.1534/genetics.113.155291. in press. [DOI] [PMC free article] [PubMed] [Google Scholar]
- 4.Nissan T, Rajyaguru P, She M, Song H, Parker R. Decapping activators in Saccharomyces cerevisiae act by multiple mechanisms. Mol Cell. 2010;39:773–783. doi: 10.1016/j.molcel.2010.08.025. [DOI] [PMC free article] [PubMed] [Google Scholar]
- 5.Swisher KD, Parker R. Interactions between Upf1 and the decapping factors Edc3 and Pat1 in Saccharomyces cerevisiae. PLoS One. 2011;6:e26547. doi: 10.1371/journal.pone.0026547. [DOI] [PMC free article] [PubMed] [Google Scholar]
- 6.Coffman VC, Wu P, Parthun MR, Wu JQ. CENP-A exceeds microtubule attachment sites in centromere clusters of both budding and fission yeast. J Cell Biol. 2011;195:563–572. doi: 10.1083/jcb.201106078. [DOI] [PMC free article] [PubMed] [Google Scholar]
- 7.Lawrimore J, Bloom KS, Salmon ED. Point centromeres contain more than a single centromere-specific Cse4 (CENP-A) nucleosome. J Cell Biol. 2011;195:573–582. doi: 10.1083/jcb.201106036. [DOI] [PMC free article] [PubMed] [Google Scholar]
- 8.Shivaraju M, Unruh JR, Slaughter BD, Mattingly M, Berman J, Gerton JL. Cell-cycle-coupled structural oscillation of centromeric nucleosomes in yeast. Cell. 2012;150:304–316. doi: 10.1016/j.cell.2012.05.034. [DOI] [PMC free article] [PubMed] [Google Scholar]
- 9.Johnston K, Joglekar A, Hori T, Suzuki A, Fukagawa T, Salmon ED. Vertebrate kinetochore protein architecture: protein copy number. J Cell Biol. 2010;189:937–943. doi: 10.1083/jcb.200912022. [DOI] [PMC free article] [PubMed] [Google Scholar]
- 10.Teixeira D, Parker R. Analysis of P-body assembly in Saccharomyces cerevisiae. Mol Biol Cell. 2007;18:2274–2287. doi: 10.1091/mbc.E07-03-0199. [DOI] [PMC free article] [PubMed] [Google Scholar]
- 11.Yeh E, Haase J, Paliulis LV, Joglekar A, Bond L, Bouck D, Salmon ED, Bloom KS. Pericentric chromatin is organized into an intramolecular loop in mitosis. Curr Biol. 2008;18:81–90. doi: 10.1016/j.cub.2007.12.019. [DOI] [PMC free article] [PubMed] [Google Scholar]
- 12.Gonen S, Akiyoshi B, Iadanza MG, Shi D, Duggan N, Biggins S, Gonen T. The structure of purified kinetochores reveals multiple microtubule-attachment sites. Nat Struct Mol Biol. 2012;19:925–929. doi: 10.1038/nsmb.2358. [DOI] [PMC free article] [PubMed] [Google Scholar]
- 13.Quammen CW, Richardson AC, Haase J, Harrison BD, Taylor RM, Bloom KS. FluoroSim: A Visual Problem-Solving Environment for Fluorescence Microscopy. Eurographics Workshop Vis Comput Biomed. 2008;2008:151–158. doi: 10.2312/VCBM/VCBM08/151-158. [DOI] [PMC free article] [PubMed] [Google Scholar]
- 14.Stephens AD, Haggerty RA, Vasquez PA, Vicci L, Snider CE, Shi F, Quammen CW, Mullins C, Haase J, Taylor RMI, et al. Pericentric Chromatin Loops Function as a Non-linear Spring in Mitotic Force Balance. Journal of Cell Biology. 2013 doi: 10.1083/jcb.201208163. in press. [DOI] [PMC free article] [PubMed] [Google Scholar]
- 15.Santaguida S, Musacchio A. The life and miracles of kinetochores. EMBO J. 2009;28:2511–2531. doi: 10.1038/emboj.2009.173. [DOI] [PMC free article] [PubMed] [Google Scholar]
- 16.Verdaasdonk JS, Gardner R, Stephens AD, Yeh E, Bloom K. Tension-dependent nucleosome remodeling at the pericentromere in yeast. Mol Biol Cell. 2012;23:2560–2570. doi: 10.1091/mbc.E11-07-0651. [DOI] [PMC free article] [PubMed] [Google Scholar]
- 17.Pearson CG, Yeh E, Gardner M, Odde D, Salmon ED, Bloom K. Stable kinetochore-microtubule attachment constrains centromere positioning in metaphase. Curr Biol. 2004;14:1962–1967. doi: 10.1016/j.cub.2004.09.086. [DOI] [PubMed] [Google Scholar]
- 18.Gasser SM, Hediger F, Taddei A, Neumann FR, Gartenberg MR. The function of telomere clustering in yeast: the circe effect. Cold Spring Harb Symp Quant Biol. 2004;69:327–337. doi: 10.1101/sqb.2004.69.327. [DOI] [PubMed] [Google Scholar]
- 19.Jencks WP. Binding energy, specificity, and enzymic catalysis: the circe effect. Adv Enzymol Relat Areas Mol Biol. 1975;43:219–410. doi: 10.1002/9780470122884.ch4. [DOI] [PubMed] [Google Scholar]
- 20.Henikoff S, Henikoff JG. "Point" centromeres of Saccharomyces harbor single centromere-specific nucleosomes. Genetics. 2012;190:1575–1577. doi: 10.1534/genetics.111.137711. [DOI] [PMC free article] [PubMed] [Google Scholar]
- 21.Hoffman DB, Pearson CG, Yen TJ, Howell BJ, Salmon ED. Microtubule-dependent changes in assembly of microtubule motor proteins and mitotic spindle checkpoint proteins at PtK1 kinetochores. Mol Biol Cell. 2001;12:1995–2009. doi: 10.1091/mbc.12.7.1995. [DOI] [PMC free article] [PubMed] [Google Scholar]
- 22.Winey M, Bloom K. Mitotic spindle form and function. Genetics. 2012;190:1197–1224. doi: 10.1534/genetics.111.128710. [DOI] [PMC free article] [PubMed] [Google Scholar]
- 23.Stephens AD, Haase J, Vicci L, Taylor RM, 2nd, Bloom K. Cohesin, condensin, and the intramolecular centromere loop together generate the mitotic chromatin spring. J Cell Biol. 2011;193:1167–1180. doi: 10.1083/jcb.201103138. [DOI] [PMC free article] [PubMed] [Google Scholar]
Associated Data
This section collects any data citations, data availability statements, or supplementary materials included in this article.