

Abstract
Objective
To compare the accuracy of linkage to care metrics for patients diagnosed with HIV using retention in care and virologic suppression as the gold standards of effective linkage.
Design
A retrospective cohort study of patients aged 18 and over with newly-diagnosed HIV infection in the City of Philadelphia, 2007 to 2008.
Methods
Times from diagnosis to clinic visits or laboratory testing were used as linkage measures. Outcome variables included being retained in care and achieving virologic suppression, 366-730 days after diagnosis. Positive predictive value (PPV), negative predictive value (NPV), and area under the curve (AUC) for each linkage measure and retention and virologic suppression outcomes are described.
Results
Of the 1781 patients in the study, 503 (28.2%) were retained in care in the Ryan White system and 418 (23.5%) achieved virologic suppression 366-730 days after diagnosis. The linkage measure with the highest PPV for retention was having two clinic visits within 365 days of diagnosis, separated by 90 days (74.2%). Having a clinic visit between 21 and 365 days after diagnosis had both the highest NPV for retention (94.5%) and the highest adjusted AUC for retention (0.872). Having two tests within 365 days of diagnosis, separated by 90 days, had the highest adjusted AUC for virologic suppression (0.780).
Conclusions
Linkage measures associated with clinic visits had higher PPV and NPV for retention, while linkage measures associated with laboratory testing had higher PPV and NPV for retention. Linkage measures should be chosen based on the outcome of interest.
Keywords: HIV, linkage to care, retention in care, virologic suppression, HIV care cascade, engaging in care
Introduction
Persons living with HIV (PLWH) must fulfill several steps along the care continuum to achieve optimal clinical outcomes (Figure 1).1-3 Individuals should be screened for HIV; however, 20% of PLWH in the United States (US) are unaware of their diagnosis.4 Linkage to care is then necessary, but only 77% of individuals link to care.1-2, 5-6 Patients must remain in care; yet 50-75% of those linked to care meet the U.S. Health Resources and Services Administration (HRSA) retention criteria of ≥2 visits separated by 90 days in a year.2, 5, 7-10 Finally, PLWH need to receive and adhere to antiretroviral therapy (ART). Navigating all these steps is often unsuccessful:11 only 28% of those with HIV achieve virologic suppression.12
Figure 1.
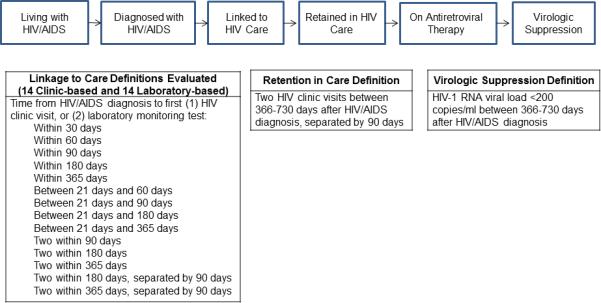
Cascade adapted from: Marks G, Gardner LI, Craw J, Crepaz N. Entry and retention in medical care among HIV-diagnosed persons: a meta-analysis. AIDS. 2010; 24:2665-2678 and Centers for Disease Control and Prevention. Vital signs: HIV prevention through care and treatment—United States. MMWR. 2011; 60:1618-1623.
Linkage to care metrics examined are listed in the table and are based on clinic visits or laboratory tests. Visits refer to clinic visits for HIV care; i.e., an outpatient visit with a provider with prescribing privileges in an HIV care setting. Either a CD4 T-cell count or HIV-1 RNA level was considered a laboratory test. Laboratory tests drawn on the same day were counted as one test. The date of the laboratory test was the date that the laboratory test was drawn, regardless of when it was entered into the database. Retention in care was defined as two clinic visits spaced 90 days apart between 366 and 730 days after diagnosis. Virologic suppression was defined as a HIV-1 RNA level <200 copies/ml, between 366 and 730 days after diagnosis.
Linkage to care is a critical step in this process.13-15 However, no consistent definition of linkage to care exists. Prior studies have defined linkage to care as attending ≥1 clinic visit for HIV care within one to six months of diagnosis,16-35 or ≥2 visits within six to twelve months of diagnosis.36-38 Other researchers have used laboratory monitoring data--CD4 T-cell counts and HIV-1 RNA levels--to investigate linkage to care, defining linkage as the occurrence of laboratory testing within one to six months of diagnosis,39-41 21 or more days after diagnosis,42 or within twelve months of diagnosis.43 In addition, governmental agencies and professional organizations differ in how they measure linkage. The US National HIV/AIDS Strategy defines linkage as laboratory testing within 90 days of diagnosis,44 while the Emergency Department National HIV Testing Consortium defines linkage as a clinic visit within 30 days of diagnosis.27
Linkage rates have similarly varied among single-clinic or multi-site cohort studies, from 38% to 100%, depending on the linkage criteria used.45-46 Few studies have been community-based. A King County, Washington study examined the timing of linkage to HIV care countywide,47 but did not specifically address the predictive ability of linkage metrics. A recent study looked at the predictive ability of two linkage criteria (having either one or two laboratory tests within a year of diagnosis) for retention in care, but did not evaluate other linkage definitions.43
To effectively monitor and improve linkage to care, a better understanding of the predictive accuracy of linkage to care measures for retention and virologic suppression is necessary. To determine the diagnostic accuracy of linkage measures to predict retention in HIV care and HIV virologic suppression, we compared clinic visit and laboratory testing based linkage measures using a city-wide cohort.
Methods
Data Sources and Study Population
The enhanced HIV/AIDS reporting system (eHARS)48 and the Ryan White CAREWare dataset (CAREWare) were combined. Philadelphia has used eHARS, a Centers for Disease Control and Prevention (CDC) database to which all new HIV diagnoses are reported, for mandated name-based case reporting since 2009. Local mandates require reporting of CD4 T-cell counts <350 cells/ml and HIV-1 RNA levels to the Department of Public Health (DPH), which are electronically imported into eHARS.48 Thus, eHARS contains records of all PLWH who were diagnosed with HIV in Philadelphia, or who had CD4 T-cell counts <350 cells/ml or HIV-1 RNA levels drawn in Philadelphia.
Patients in the eHARS dataset were matched with records in CAREWare. eHARS and CAREWare records are routinely matched for surveillance via unique identification numbers contained in both datasets. All eligible patients (100%) identified in CAREWare were successfully matched to the eHARS database. CAREWare is free HIV care-monitoring software developed by HRSA for use by Ryan White Program (RWP) grantees and providers. Among its functions, it produces Ryan White HIV/AIDS Program Services Reports to meet HRSA reporting requirements. Patient-level data in CAREWare includes demographic, laboratory, pharmacy, and health service utilization information for all patients seen at Philadelphia RWP-funded clinics, collected to evaluate site-specific and system-wide performance data. Clinics perform chart reviews to abstract patient-level information. After undergoing quality control and verification, data is submitted to the DPH AIDS Activities Coordinating Office, where it is combined across clinics to produce a uniform database. Chart reviews and site visits verify the accuracy and completeness of the data. The majority of Philadelphia HIV clinics are RWP-funded, covering 71% of patients in care in Philadelphia (unpublished data, City of Philadelphia DPH). Therefore, all patients in all Philadelphia HIV clinics that receive RWP funding are in the CAREWare dataset. We performed retrospective analyses on PLWH linked to and retained in care at Philadelphia RWP-funded clinics.
The study population included all patients ≥18 years who were newly diagnosed with HIV in 2007 and 2008. All patients were residents of Philadelphia at the time of diagnosis. The study was approved by the Institutional Review Boards of the University of Pennsylvania Perelman School of Medicine and the City of Philadelphia DPH.
Predictor and Outcome Measures
We examined two sets of linkage to care measures based on the length of time between the individual's HIV/AIDS diagnosis date and first (1) HIV clinic visit or (2) laboratory monitoring test. Clinic visits were defined based on HRSA criteria: a visit to an outpatient provider with prescribing privileges (not including nurses, pharmacists, social workers, or other support services providers) in an HIV care setting.50 All linkage measures investigated were used or adapted from prior studies (Figure 1).16-44, 49 Linkage measures included having a clinic visit within 30,26 60, 90,28-32 180,33-34 and 365 days after diagnosis;49 a clinic visit between 21 and 60 days, 21 and 90 days, 21 and 180 days, and 21 and 365 days after diagnosis;42 two clinic visits within 90, 180,33 and 365 days after diagnosis;49 and two clinic visits ≥90 days apart within 180 and 365 days after diagnosis.37 As an example, a patient diagnosed on July 1, 2007 who had a clinic visit 10 days after diagnosis would be considered to have had a clinic visit within 30, 60, 90, 180, and 365 days after diagnosis.
Laboratory tests were considered to be CD4 T-cell levels and HIV-1 RNA levels. Two laboratory tests performed on the same day were considered one test, and the test date refers to the date that the laboratory test was drawn. Laboratory tests were acquired from both eHARS and CAREWare. Laboratory-based linkage measures included having tests within 30, 60, 90,40 180, and 365 days after diagnosis;43 between 21 and 60 days, 21 and 90 days, 21 and 180 days, and 21 and 365 days after diagnosis;42 two tests within 90, 180, and 365 days after diagnosis;43 and two tests 90 days apart within 180 and 365 days after diagnosis.36
Outcome variables used as reference standards included retention in care and virologic suppression, as the preferred outcome of linkage to care may differ depending on the organization (e.g. health department, clinic, community-based organization). For each patient, the linkage period of the study was defined as the day of diagnosis to 365 days after diagnosis, and the retention and virologic suppression period of the study was defined as 366 days to 730 days after diagnosis. The length of follow-up was censored at 730 days after diagnosis in all patients. Retention measurement started 366 days after diagnosis to distinguish linkage from retention in care and was defined as ≥2 clinic visits for HIV care ≥90 days apart between 366 and 730 days after diagnosis.50 Virologic suppression was defined as a viral load less than 200 copies/mL, as the last viral load sent between 366 and 730 days after diagnosis.
Demographic variables are defined according to CDC criteria.48 Gender was defined as sex at birth. Race/ethnicity was categorized as white, black, Hispanic, or other. Exposure risk was grouped into heterosexual, men who had sex with men (MSM), injection drug use (IDU), and other/unknown. If a patient had both IDU and heterosexual exposures, or both IDU and MSM exposures, they were coded as having both risk factors.48 AIDS at time of HIV diagnosis was based on having a CD4 T-cell count <200 cells/μl, or an AIDS-defining condition.48 Place of birth was dichotomized as in the US vs. outside of the US, including Puerto Rico.48 Death within 730 days of diagnosis were identified by monthly evaluation of all death records that include HIV or AIDS on the death certificate and annual matching of eHARS records with the Social Security Death Index. CD4 T-lymphocyte count was categorized as <200 cells/ml, 200-350 cells/ml, 351-500 cells/ml, and >500 cells/ml.
Data Analysis
Univariate statistics described the dataset. Multivariate logistic regression models without repeated measures were used to assess relationships between linkage measures and the outcomes. Models were adjusted for age (continuous), gender, race/ethnicity, HIV risk factor, and AIDS at time of HIV diagnosis. We did not include CD4 T-lymphocyte counts given the degree of colinearity with AIDS at time of HIV diagnosis. Adjusted odds ratios (AOR) with 95% confidence intervals (CI) are presented. Relationships were considered statistically significant at α<0.05.
Sensitivities, specificities, negative predictive values (NPV), and positive predictive values (PPV) were calculated for relationships between all linkage measures and outcome measures. Sensitivity for retention in care (and virologic suppression) was defined as the proportion of those meeting the retention in care criteria (or virologic suppression criteria) who were linked to care. Similarly, specificity for retention in care (and virologic suppression) was defined as the proportion of those not retained in care (or not virologically suppressed) who were not linked to care. PPV was defined as the proportion of those meeting linkage criteria who were retained in care (or virologically suppressed). NPV was defined as the proportion of those not meeting linkage criteria who were not retained in care (or not virologically suppressed). Receiver operating characteristic curves were created and the area under the curve (AUC) calculated to determine the ability of each metric to predict retention in care and virologic suppression. AUCs were adjusted for age, gender, race/ethnicity, exposure risk, and AIDS at time of diagnosis.
We performed four sub- and sensitivity analyses: 1) to account for mortality, 2) to account for moving outside the city, 3) to determine the effect of clinic visits not captured in our dataset, and 4) to determine the effect of undetectable HIV viral loads not captured in our dataset. Since people who died or emigrated out of the city during the study period may not have had the opportunity to fulfill linkage, retention in care, and virologic suppression criteria, we conducted subanalyses (including sensitivities, specificities, PPVs, and NPVs) on only those individuals with complete follow-up to examine if excluding those who died or emigrated out of the city changed the point estimates, respectively. Next, sensitivity analyses addressing the 29% of PLWH in Philadelphia seen outside of RWP-funded clinics were performed, assuming all these individuals were linked to care. Finally, to account for the possibility of incomplete laboratory reporting, sensitivity analyses conducted based on the conservative estimate that 15% of PLWH (i.e., 50% of those not in care at RWP-funded clinics) had missing undetectable viral load measurements. Laboratory tests from two sources (eHARS and CAREWare) were available for 71% of patients. As such, sensitivity analyses assumed that half of those not in CAREWare were at risk of having missing undetectable HIV-1 RNA levels.
SAS Ver. 10.0 was used for all analyses (Cary, NC).
Results
Our cohort included 1781 patients. Most patients were male (70.1%) and black (63.3%), and had a heterosexual risk exposure (61.0%). Approximately one-third had AIDS at HIV diagnosis (34.5%) (Table 1). Linkage rates for clinic-based measures were applicable for RWP-funded clinics only, and ranged from 17.5% for having two visits in 180 days separated by 90 days, to 39.5% for having any visit within 365 days of diagnosis. For laboratory-based measures, linkage rates ranged from 34.0% for having two tests 90 days apart within 365 days, to 81.6% for having one test in 365 days (Table 2). Data and diagrams representing progression through the HIV care cascade for each linkage metric are presented (Supplemental Digital Content [SDC]: Table 1 and Figures 1-28).51 Progression through the HIV care cascade, stratified by sociodemographic characteristics, are also shown (SDC Table 2).
Table 1.
Demographic characteristics of 1781 newly-diagnosed HIV-positive persons in the City of Philadelphia, 2007 and 2008.
| Characteristic | Number (Percentage) |
|---|---|
| Age (years): Mean (Standard deviation) (no missing) | 37.0 (12.2) |
| Female Gender (no missing) | 532 (29.9) |
| Race/ethnicity (no missing) | |
| Black | 1128 (63.3) |
| White | 308 (17.3) |
| Hispanic* | 269 (15.1) |
| Other | 76 (4.3) |
| HIV risk exposure | |
| Heterosexual exposure | 1082 (61.0) |
| Injection Drug Use exposure | 304 (17.1) |
| Men who have Sex with Men exposure | 597 (33.7) |
| Other/Missing | 27 (1.5) |
| Born inside the U.S. | 1588 (89.3) |
| Missing location of birth | 2 (0.11) |
| Diagnosed with AIDS at time of HIV diagnosis (no missing) | 615 (34.5) |
| CD4 T-cell count within 90 days of diagnosis | |
| CD4 count at diagnosis ≤200/ml | 615 (34.5) |
| CD4 count at diagnosis >200 and ≤350/ml | 189 (10.6) |
| CD4 count at diagnosis <350 and ≤500/ml | 191 (10.7) |
| CD4 count at diagnosis >500/ml | 386 (21.7) |
| No CD4 count sent within 90 days of diagnosis | 400 (22.5) |
| Death within 2 years of HIV diagnosis (no missing)† | 94 (5.3) |
| Migrated outside Philadelphia during study | 105 (5.9) |
| Missing information on migration | 60 (3.4) |
Patients who identified as both Hispanic and another race were considered Hispanic.
Deaths are identified by monthly evaluation of all death records that include HIV or AIDS on the death certificate and annual matching of eHARS records with State Vital Statistics data, the Social Security Death Index, and the National Death Index. Patients who died within 730 days of HIV diagnosis were included in this variable.
Table 2.
Number and percentage of newly-diagnosed HIV-positive persons meeting linkage metrics, with odds ratios (OR) describing the likelihood of meeting retention in care criteria, of 1781 persons newly diagnosed with HIV in Philadelphia in 2007 and 2008.*
| Linkage Measure | Number Meeting Linkage Measure (percentage) | Adjusted OR for Retention in Care (95% CI) |
|---|---|---|
| Visit in 30 Days | 363 (20.4) | 6.4 (5.0-8.3) |
| Visit in 60 days | 473 (26.6) | 9.2 (7.2-11.7) |
| Visit in 90 days | 530 (29.8) | 10.6 (8.3-13.6) |
| Visit in 180 days | 614 (34.5) | 15.8 (12.2-20.5) |
| Visit in 365 days | 703 (39.5) | 30.9 (22.6-42.3) |
| Visit between 21 days and 60 days | 391 (22.0) | 8.3 (6.4-10.6) |
| Visit between 21 days and 90 days | 473 (26.6) | 10.0 (7.8-12.8) |
| Visit between 21 days and 180 days | 576 (32.3) | 15.1 (11.7-19.5) |
| Visit between 21 and 365 days | 680 (38.2) | 31.0 (22.8-42.2) |
| Two visits in 90 days | 384 (21.6) | 9.6 (7.4-12.4) |
| Two visits in 180 days | 496 (27.9) | 14.8 (11.4-19.1) |
| Two visits in 365 days | 610 (34.3) | 25.8 (19.5-34.2) |
| Two visits in 180 days, separated by 90 days | 312 (17.5) | 11.6 (8.7-15.9) |
| Two visits in 365 days, separated by 90 days | 508 (28.5) | 25.1 (19.1-33.0) |
| Tests in 30 days | 1014 (56.9) | 1.5 (1.2-1.9) |
| Tests in 60 days | 1205 (67.7) | 1.9 (1.5-2.4) |
| Tests in 90 days | 1282 (72.0) | 2.3 (1.8-3.0) |
| Tests in 180 days | 1382 (77.6) | 4.5 (3.2-6.4) |
| Tests in 365 days | 1454 (81.6) | 8.6 (5.3-14.0) |
| Tests between 21 and 60 days | 643 (36.1) | 2.4 (1.9-3.0) |
| Tests between 21 and 90 days | 818 (45.9) | 2.9 (2.3-3.6) |
| Tests between 21 and 180 days | 1075 (60.3) | 5.5 (4.3-7.3) |
| Tests between 21 and 365 days | 1226 (68.8) | 11.6 (7.8-17.3) |
| Two tests in 90 days | 370 (37.6) | 4.2 (3.4-5.3) |
| Two tests in 180 days | 954 (53.6) | 6.2 (4.8-8.1) |
| Two tests in 365 days | 1139 (64.0) | 11.4 (8.0-16.4) |
| Two tests in 180 days, separated by 90 days | 605 (34.0) | 3.7 (3.0-4.7) |
| Two tests in 365 days, separated by 90 days | 1003 (56.3) | 9.9 (7.3-13.4) |
Retention in care defined as two clinic visits spaced 90 days apart in one year, between 366 and 730 days after diagnosis. Visits refer to clinic visits for HIV care; i.e., an outpatient visit with a provider with prescribing privileges in an HIV care setting. Logistic regression was used to determine relationships between the linkage metric and the likelihood of meeting retention in care criteria. ORs were adjusted for age, gender, race/ethnicity, HIV exposure group, and AIDS at time of HIV diagnosis. Tests refer to laboratory tests drawn, including CD4 T-cell counts and HIV-1 RNA levels. Either a CD4 T-cell count or HIV-1 RNA level was considered a laboratory test. If two laboratory tests were drawn, these must have been drawn on separate days. The date of the laboratory test was the date that the laboratory test was drawn, regardless of when it was entered into the database.
Abbreviations: OR: odds ratios; CI: confidence interval; HIV: human immunodeficiency virus; AIDS: acquired immunodeficiency syndrome
Between 366 and 730 days after diagnosis, 780 patients (43.8%) successfully attended ≥1 clinic visit, and 503 patients (28.2%) met the HRSA retention measure (two clinic visits ≥90 days apart in one year). Similarly, 366-730 days after diagnosis, 23.5% (N=419) had virologic suppression. In total, 1108 patients (62.2%) were neither retained in care nor had virologic suppression 366-730 days after diagnosis.
Using retention in care as the outcome of appropriate linkage, the measure with the highest PPV for retention was attending two clinic visits ≥90 days apart within 365 days of diagnosis (74.2%; 95% CI: 70.8%-78.0%). The linkage measure with the lowest PPV for retention was laboratory monitoring within 30 days (32.0%; 95% CI: 29.1%-34.9%). PLWH who did not have a clinic visit between 21 and 365 days after diagnosis had the highest NPV for retention in care (94.5%, 95% CI: 0.928-0.962), while the absence of laboratory monitoring within 30 days of diagnosis had the lowest NPV for retention (77.0%, 95% CI: 74.0%-80.0%). The measure with the highest AUC for retention in care was attending a clinic visit between 21 and 365 days after diagnosis (Table 3).
Table 3.
Sensitivity, specificity, PPV, and NPV for each linkage metric examined, with retention in care as the outcome, of 1781 persons newly diagnosed with HIV in Philadelphia in 2007 and 2008.*
| Measure | Sensitivity (95% CI) | Specificity (95% CI) | PPV (95% CI) | NPV (95% CI) | AUC | Adjusted AUC† |
|---|---|---|---|---|---|---|
| Visit in 30 days | 0.45 (0.41-0.49) | 0.89 (0.87-0.91) | 0.62 (0.57-0.67) | 0.80 (0.78-0.83) | 0.671 | 0.746 |
| Visit in 60 days | 0.60 (0.56-0.64) | 0.87 (0.85-0.88) | 0.64 (0.59-0.68) | 0.85 (0.83-0.87) | 0.733 | 0.789 |
| Visit in 90 days | 0.67 (0.62-0.71) | 0.85 (0.83-0.87) | 0.63 (0.59-0.68) | 0.87 (0.85-0.88) | 0.758 | 0.806 |
| Visit in 180 days | 0.78 (0.74-0.81) | 0.83 (0.80-0.85) | 0.64 (0.60-0.67) | 0.90 (0.89-0.92) | 0.801 | 0.835 |
| Visit in 365 days | 0.89 (0.86-0.91) | 0.80 (0.78-0.82) | 0.64 (0.60-0.67) | 0.95 (0.93-0.96) | 0.844 | 0.870 |
| Visit between 21 and 60 days | 0.51 (0.46-0.55) | 0.89 (0.88-0.91) | 0.65 (0.61-0.70) | 0.82 (0.80-0.84) | 0.702 | 0.770 |
| Visit between 21 and 90 days | 0.61 (0.57-0.66) | 0.87 (0.85-0.89) | 0.65 (0.61-0.69) | 0.85 (0.83-0.87) | 0.742 | 0.798 |
| Visit between 21 and 180 days | 0.75 (0.71-0.78) | 0.84 (0.82-0.86) | 0.65 (0.61-0.69) | 0.89 (0.88-0.91) | 0.796 | 0.831 |
| Visit between 21 and 365 days | 0.88 (0.81-0.91) | 0.81 (0.79-0.84) | 0.65 (0.61-0.69) | 0.95 (0.93-0.96) | 0.848 | 0.872 |
| Two visits in 90 days | 0.52 (0.47-0.56) | 0.90 (0.89-0.92) | 0.68 (0.63-0.73) | 0.83 (0.81-0.85) | 0.711 | 0.777 |
| Two visits in 180 days | 0.68 (0.64-0.72) | 0.88 (0.86-0.90) | 0.69 (0.65-0.73) | 0.87 (0.86-0.89) | 0.780 | 0.821 |
| Two visits in 365 days | 0.83 (0.79-0.86) | 0.85 (0.83-0.87) | 0.68 (0.64-0.72) | 0.93 (0.91-0.94) | 0.838 | 0.864 |
| Two visits in 180 days, separated by 90 days | 0.46 (0.41-0.50) | 0.94 (0.92-0.95) | 0.73 (0.68-0.78) | 0.81 (0.79-0.83) | 0.580 | 0.694 |
| Two visits in 365 days, separated by 90 days | 0.75 (0.71-0.79) | 0.90 (0.88-0.91) | 0.74 (0.71-0.78) | 0.90 (0.88-0.92) | 0.633 | 0.725 |
| Tests in 30 days | 0.68 (0.63-0.72) | 0.46 (0.44-0.49) | 0.32 (0.29-0.35) | 0.77 (0.74-0.80) | 0.552 | 0.649 |
| Tests in 60 days | 0.80 (0.76-0.84) | 0.36 (0.34-0.39) | 0.32 (0.29-0.35) | 0.80 (0.76-0.83) | 0.565 | 0.656 |
| Tests in 90 days | 0.85 (0.81-0.88) | 0.32 (0.30-0.35) | 0.33 (0.30-0.35) | 0.83 (0.79-0.86) | 0.576 | 0.665 |
| Tests in 180 days | 0.94 (0.91-0.96) | 0.27 (0.25-0.30) | 0.34 (0.31-0.36) | 0.90 (0.87-0.93) | 0.601 | 0.687 |
| Tests in 365 days | 0.96 (0.95-0.98) | 0.24 (0.22-0.27) | 0.33 (0.31-0.36) | 0.95 (0.91-0.97) | 0.603 | 0.693 |
| Tests between 21 and 60 days | 0.55 (0.50-0.60) | 0.70 (0.67-0.72) | 0.40 (0.36-0.44) | 0.78 (0.76-0.81) | 0.606 | 0.678 |
| Tests between 21 and 90 days | 0.69 (0.64-0.73) | 0.61 (0.58-0.64) | 0.40 (0.36-0.43) | 0.82 (0.79-0.84) | 0.630 | 0.695 |
| Tests between 21 and 180 days | 0.87 (0.83-0.90) | 0.48 (0.45-0.50) | 0.40 (0.37-0.43) | 0.90 (0.87-0.92) | 0.674 | 0.729 |
| Tests between 21 and 365 days | 0.97 (0.95-0.98) | 0.40 (0.37-0.42) | 0.39 (0.36-0.42) | 0.95 (0.93-0.97) | 0.678 | 0.736 |
| Two tests in 90 days | 0.61 (0.56-0.66) | 0.70 (0.67-0.72) | 0.47 (0.43-0.51) | 0.83 (0.81-0.85) | 0.671 | 0.730 |
| Two tests in 180 days | 0.82 (0.78-0.85) | 0.55 (0.52-0.58) | 0.43 (0.40-0.47) | 0.89 (0.87-0.91) | 0.700 | 0.748 |
| Two tests in 365 days | 0.94 (0.91-0.96) | 0.45 (0.43-0.48) | 0.41 (0.38-0.44) | 0.94 (0.92-0.96) | 0.701 | 0.753 |
| Two tests in 180 days, separated by 90 days | 0.59 (0.54-0.63) | 0.74 (0.71-0.76) | 0.46 (0.42-0.51) | 0.81 (0.79-0.83) | 0.539 | 0.647 |
| Two tests in 365 days, separated by 90 days | 0.56 (0.55-0.58) | 0.88 (0.86-0.91) | 0.44 (0.40-0.48) | 0.93 (0.90-0.95) | 0.724 | 0.772 |
Retention in care defined as two clinic visits spaced 90 days apart in one year, between 366 and 730 days after diagnosis. Visits refer to clinic visits for HIV care; i.e., an outpatient visit with a provider with prescribing privileges in an HIV care setting. Tests refer to laboratory tests sent, including CD4 T-cell counts and HIV-1 RNA levels. Either a CD4 T-cell count or HIV-1 RNA level was considered a laboratory test. Laboratory tests drawn on the same day were counted as one test. The date of the laboratory test was the date that the laboratory test was drawn, regardless of when it was entered into the database. Estimates are unadjusted estimates unless specified. Sensitivity for retention in care was defined as the proportion of those meeting the retention in care criteria who met the linkage criteria. Similarly, specificity for retention in care was defined as the proportion of those not retained in care who did not meet the linkage criteria. PPV was defined as the proportion of those meeting linkage criteria who were retained in care, and NPV was defined as the proportion of those not meeting linkage criteria who were not retained in care.
Adjusted for AIDS at time of diagnosis, race/ethnicity, exposure risk, gender, and age.
Abbreviations: PPV: Positive predictive value; NPV: negative predictive value; HIV: human immunodeficiency virus; AIDS: acquired immunodeficiency syndrome; AUC: area under the curve
Using virologic suppression as the outcome of appropriate linkage, the measure with the highest NPV for virologic suppression was lacking laboratory testing within 365 days of diagnosis (98.2%; 95% CI: 96.1%-99.3%) and the measure with the lowest NPV was the absence of a clinic visit within 30 days of diagnosis (87.0%, 95% CI: 85.0%-89.0%). The measure with the lowest PPV for virologic suppression was having two tests in 180 days separated by 90 days (41.0%, 95% CI: 37.0%-45.0%), while having two visits in 180 days separated by 90 days had the highest PPV for virologic suppression (49.0%, 95% CI: 43.0%-55.0%). Patients completing two laboratory tests separated by 90 days in 365 days had the highest AUC for virologic suppression (Table 4).
Table 4.
Sensitivity, specificity, PPV, and NPV for each linkage metric examined, with virologic suppression as the outcome, of 1781 persons newly diagnosed with HIV in Philadelphia in 2007 and 2008.*
| Measure | Sensitivity (95% CI) | Specificity (95% CI) | PPV (95% CI) | NPV (95% CI) | AUC | Adjusted AUC† |
|---|---|---|---|---|---|---|
| Visit in 30 days | 0.35 (0.31-0.40) | 0.84 (0.82-0.86) | 0.41 (0.35-0.46) | 0.81 (0.79-0.83) | 0.597 | 0.689 |
| Visit in 60 days | 0.45 (0.41-0.50) | 0.79 (0.77-0.81) | 0.40 (0.36-0.45) | 0.83 (0.80-0.85) | 0.623 | 0.705 |
| Visit in 90 days | 0.51 (0.47-0.56) | 0.77 (0.75-0.79) | 0.41 (0.36-0.45) | 0.84 (0.82-0.86) | 0.642 | 0.717 |
| Visit in 180 days | 0.60 (0.55-0.65) | 0.73 (0.71-0.76) | 0.41 (0.37-0.45) | 0.86 (0.83-0.88) | 0.666 | 0.736 |
| Visit in 365 days | 0.67 (0.63-0.72) | 0.69 (0.67-0.72) | 0.40 (0.36-0.44) | 0.87 (0.85-0.89) | 0.683 | 0.751 |
| Visit between 21 and 60 days | 0.42 (0.37-0.47) | 0.84 (0.82-0.86) | 0.45 (0.40-0.50) | 0.83 (0.80-0.84) | 0.630 | 0.714 |
| Visit between 21 and 90 days | 0.49 (0.44-0.54) | 0.80 (0.78-0.82) | 0.44 (0.39-0.48) | 0.84 (0.82-0.86) | 0.648 | 0.726 |
| Visit between 21 and 180 days | 0.58 (0.53-0.63) | 0.76 (0.73-0.78) | 0.42 (0.38-0.47) | 0.86 (0.83-0.88) | 0.670 | 0.742 |
| Visit between 21 and 365 days | 0.67 (0.63-0.72) | 0.71 (0.68-0.73) | 0.41 (0.38-0.45) | 0.88 (0.85-0.89) | 0.690 | 0.757 |
| Two visits in 90 days | 0.39 (0.35-0.44) | 0.84 (0.82-0.86) | 0.43 (0.38-0.48) | 0.82 (0.80-0.84) | 0.615 | 0.701 |
| Two visits in 180 days | 0.51 (0.46-0.56) | 0.79 (0.77-0.81) | 0.43 (0.38-0.47) | 0.84 (0.82-0.86) | 0.649 | 0.723 |
| Two visits in 365 days | 0.61 (0.56-0.65) | 0.74 (0.71-0.76) | 0.42 (0.38-0.46) | 0.86 (0.84-0.88) | 0.673 | 0.742 |
| Two visits in 180 days, separated by 90 days | 0.37 (0.32-0.41) | 0.88 (0.87-0.90) | 0.49 (0.43-0.55) | 0.82 (0.80-0.84) | 0.558 | 0.694 |
| Two visits in 365 days, separated by 90 days | 0.59 (0.54-0.64) | 0.81 (0.79-0.83) | 0.49 (0.44-0.53) | 0.87 (0.85-0.88) | 0.596 | 0.725 |
| Tests in 30 days | 0.68 (0.63-0.72) | 0.46 (0.44-0.49) | 0.28 (0.25-0.31) | 0.83 (0.80-0.85) | 0.572 | 0.663 |
| Tests in 60 days | 0.80 (0.76-0.84) | 0.36 (0.34-0.39) | 0.28 (0.25-0.30) | 0.86 (0.82-0.88) | 0.582 | 0.673 |
| Tests in 90 days | 0.85 (0.81-0.88) | 0.32 (0.30-0.35) | 0.28 (0.25-0.30) | 0.87 (0.84-0.90) | 0.585 | 0.679 |
| Tests in 180 days | 0.94 (0.91-0.96) | 0.27 (0.25-0.30) | 0.28 (0.26-0.31) | 0.93 (0.91-0.96) | 0.606 | 0.701 |
| Tests in 365 days | 0.99 (0.97-0.99) | 0.24 (0.21-0.26) | 0.28 (0.26-0.31) | 0.98 (0.96-0.99) | 0.611 | 0.709 |
| Tests between 21 and 60 days | 0.55 (0.50-0.60) | 0.70 (0.67-0.72) | 0.36 (0.32-0.40) | 0.84 (0.81-0.86) | 0.625 | 0.696 |
| Tests between 21 and 90 days | 0.69 (0.64-0.73) | 0.61 (0.58-0.64) | 0.35 (0.32-0.38) | 0.86 (0.84-0.89) | 0.649 | 0.715 |
| Tests between 21 and 180 days | 0.87 (0.83-0.90) | 0.48 (0.45-0.50) | 0.34 (0.31-0.37) | 0.92 (0.90-0.94) | 0.673 | 0.740 |
| Tests between 21 and 365 days | 0.97 (0.95-0.98) | 0.40 (0.37-0.42) | 0.33 (0.30-0.36) | 0.98 (0.96-0.99) | 0.683 | 0.755 |
| Two tests in 90 days | 0.61 (0.56-0.66) | 0.70 (0.67-0.72) | 0.38 (0.35-0.42) | 0.85 (0.83-0.87) | 0.654 | 0.715 |
| Two tests in 180 days | 0.82 (0.78-0.85) | 0.55 (0.52-0.58) | 0.36 (0.33-0.39) | 0.91 (0.89-0.93) | 0.683 | 0.743 |
| Two tests in 365 days | 0.94 (0.91-0.96) | 0.45 (0.43-0.48) | 0.35 (0.32-0.37) | 0.96 (0.94-0.97) | 0.696 | 0.762 |
| Two tests in 180 days, separated by 90 days | 0.59 (0.54-0.63) | 0.74 (0.71-0.76) | 0.41 (0.37-0.45) | 0.85 (0.83-0.87) | 0.632 | 0.758 |
| Two tests in 365 days, separated by 90 days | 0.90 (0.85-0.95) | 0.45 (0.43-0.47) | 0.38 (0.34-0.42) | 0.95 (0.93-0.97) | 0.721 | 0.780 |
Virologic suppression was defined as a HIV-1 RNA viral load less than 200 copies/ml, as the first viral load drawn between 366 days and 730 days after diagnosis. Visits refer to clinic visits for HIV care; i.e., an outpatient visit with a provider with prescribing privileges in an HIV care setting. Tests refer to laboratory tests sent, including CD4 T-cell counts and HIV-1 RNA levels. Either a CD4 T-cell count or HIV-1 RNA level was considered a laboratory test. Laboratory tests drawn on the same day were counted as one test. The date of the laboratory test was the date that the laboratory test was drawn, regardless of when it was entered into the database. Estimates are unadjusted estimates unless specified. Sensitivity for virologic suppression was defined as the proportion of those meeting the virologic suppression criteria who met the linkage criteria. Similarly, specificity for virologic suppression was defined as the proportion of those who did not achieve virologic suppression who did not meet the linkage criteria. PPV was defined as the proportion of those meeting linkage criteria who achieved virologic suppression, and NPV was defined as the proportion of those not meeting linkage criteria who did not achieve virologic suppression.
Adjusted for AIDS at time of diagnosis, race/ethnicity, exposure risk, gender, and age.
Abbreviations: PPV: Positive predictive value; NPV: negative predictive value; HIV: human immunodeficiency virus; AIDS: acquired immunodeficiency syndrome; AUC: area under the curve
Sensitivity analyses were performed to account for care received outside of RWP-funded clinics. Linkage measures associated with the highest and lowest odds of retention in care, sensitivities, specificities, NPVs, and PPVs did not change. Sensitivity analyses were also performed to account for the possibility of unreported undetectable viral loads. NPVs and PPVs did not differ greatly. When sensitivity analyses were performed assuming both laboratory monitoring-based measures and the outcome measure of virologic suppression were underestimated, PPV changed little, but NPV decreased to as little as 11% for having any laboratory test sent within 365 days (SDC, Tables 3-6).
Additional analyses were performed to determine the effect of mortality on estimates. Point analyses of those alive at 730 days after diagnosis did not differ by 10% of their baseline. We also performed subanalyses examining only those patients who did not move out of Philadelphia during the study. Point analyses did not differ by 10% of their baseline.
Discussion
This is one of the first studies comparing multiple laboratory and clinic-based measures of linkage to care. Clinic-based linkage measures, in particular completing ≥1 clinic visits between 21 and 365 days after diagnosis, best predict retention in care. On the other hand, completing two laboratory tests separated by 90 days within 365 days of diagnosis best predicts virologic suppression. These data suggest that both clinic and laboratory-based linkage measures have value. Selection of a linkage measure should be tailored to the outcome of interest.
Government agencies and professional organizations vary in criteria used to define linkage to care. The Emergency Department National HIV Testing Consortium metric is a clinic visit within 30 days of diagnosis.27 In our study, only 62.3% of patients meeting this measure were retained in care, and only 40.5% achieved virologic suppression. The US National HIV/AIDS Strategy recommends linking 85% of persons to care within 90 days of diagnosis, using a laboratory-based measure.47 While 72.0% of patients met this measure, only 32.5% were retained, and 27.7% achieved virologic suppression. Using the linkage metric most predictive of retention in care, 38.2% of patients completed a clinic visit between 21 and 365 days after diagnosis, with 65.0% of patients meeting this measure retained in care. Alternatively, using the linkage metric most predictive of virologic suppression, 56.3% of patients had two laboratory tests 90 days apart within 365 days of diagnosis, and 38.0% of these achieved virologic suppression. Our data suggest that agencies and organizations should consider which linkage metrics best meet their outcomes of interest when recommending linkage criteria.
Laboratory-based linkage measures had lower predictive abilities for retention in care than clinic-based measures. 81.6% of the population had a laboratory test within 365 days of diagnosis, while only 39.5% had a clinic visit within the Ryan White system within 365 days of diagnosis. Clinic visits were underreported to a greater extent than laboratory testing, as we used the HRSA definition for HIV clinic visits50 (which excludes pharmacy, nursing, social work, and other visits to providers without prescribing privileges), and as we were unable to detect visits to non-RWP-funded clinics. Furthermore, laboratory testing may occur outside of the primary HIV care setting, including in non-HIV clinics, inpatient hospitals, and emergency departments. Our data differs from recent studies suggesting the use of laboratory testing as a proxy for clinic visits.52 While using laboratory tests as a proxy for clinic visits may be helpful in clinic cohort-based studies,52 our data suggest that laboratory tests may not be as predictive of clinic visits in all settings, such as surveillance.
Prior studies have evaluated metrics for retention in care53-54 and predictors of virologic suppression.55 However, few studies have examined how well different linkage metrics predict retention in care or virologic suppression. Among these, only one41 or two43 linkage metrics were compared. We present a more complete picture of linkage to care, retention in care, and virologic suppression than prior clinic cohort-based studies.
Our study had limitations. First, generalizability was limited as we only studied patients in one US city. Also, linkage, retention, and virologic suppression are lower than reported elsewhere.2, 5, 45-46, 56-59 For example, a meta-analysis of 28 studies estimated that 77% of patients are linked to care, 51% are retained in care, and 35% achieve virologic suppression.2, 5 Linkage rates in our study ranged from 17.5% to 81.6%, 28.2% of patients were retained in care, and 23.5% achieved virologic suppression. Our inability to access clinic visit data on patients seen outside RWP-funded clinics would have underestimated linkage to and retention in care for the metrics that used this data. However, sensitivity analyses accounting for PLWH not attending RWP-funded clinics demonstrated that the linkage metrics most predictive for retention in care and virologic suppression did not change. If laboratories were not reporting undetectable HIV-1 RNA levels, we also may have underestimated virologic suppression. Sensitivity analyses accounting for this did not alter the results. We also performed sensitivity analyses to account for those who died or migrated out of the city. While it is possible that PLWH in care may lack laboratory monitoring, this is rare (unpublished data, Philadelphia DPH). Similarly, it is unlikely that PLWH not in care would achieve virologic suppression.
We focused on virologic suppression and retention in care between 366 and 730 days after diagnosis to differentiate linkage to care from retention in care, as some researchers defined linkage to care within the first 365 days after diagnosis.38 Some patients may have dropped out of care prior to this time, potentially contributing to the lower retention rates seen in the study. In addition, we did not collect data on the timing of ART initiation, which has been associated with both improved retention in care and virologic suppression.60-61 Low rates of ART initiation among PLWH in our cohort could further lower the proportion of patients not meeting retention in care and virologic suppression targets.
Despite these adjustments, linkage and retention metrics were still lower than reported elsewhere.2, 5, 45-46, 56-59 Our data came from a large city with many racial minorities and persons below the poverty line, which may be associated with lower rates of retention in care. Care provider characteristics may also differ from other cities. For example, providers, including non-HIV providers working in urgent care, emergency, inpatient, and primary care clinic settings, may be less likely to send laboratory tests than in other regions, lowering laboratory-based linkage rates. Further studies are needed to evaluate how linkage measures perform in other locals and settings.
Understanding the predictive ability of measures of linkage to care is necessary for improving the quality of HIV care and reducing HIV transmissions. Our data suggests that selection of the ideal linkage measure depends on the outcome of interest being evaluated. The clinic-based measure of completing a visit between 21 and 365 days after diagnosis best predicted retention in care, and may be useful for testing centers focused on referring PLWH to care. Meanwhile, the laboratory-based measure of completing two laboratory tests separated by 90 days within 365 days of diagnosis best predicted virologic suppression, and may be a helpful definition for test-and-treat strategies aimed at reducing community viral load. Researchers studying retention and virologic suppression in PLWH, testing agencies seeking to improve the quality of their work, and funding agencies deciding how to allocate resources should tailor linkage measures based on the outcome of interest.
Supplementary Material
Acknowledgements
S.C.K. designed the study, acquired the data, performed statistical analyses, performed the data analysis and interpretation, drafted the manuscript, and provided critical revision of the manuscript for important intellectual content. M.E. performed statistical analyses, provided administrative support, acquired data, and provided critical revision of the manuscript for important intellectual content. B.R.Y. performed data interpretation and provided critical revision of the manuscript for important intellectual content. K.A.B. assisted in study design, performed data interpretation and provided critical revision of the manuscript for important intellectual content. This work was supported by an unrestricted grant from the Agency for Healthcare Research and Quality, Grant (GIM) 400-4239-4-555854-XXXX-2446-2192 [S.C.K.]. BRY was supported by the National Institutes of Health/Institute of Mental Health (K23-MH-097647-01A1). KAB was supported by a Health Resources and Services Administration Ryan White Grant (H89HA0013) and by a Centers for Disease Control and Prevention grant for FOA PS08-802 (5U62PS001044-04). We would like to acknowledge staff of the City of Philadelphia Department of Public Health AIDS Activities Coordinating Office for their assistance in creating the Ryan White dataset, especially Jane Baker; Coleman Terrell; Mark Shpaner, MD; Marlene Matosky, MPH, RN; and Ethan Schofer.
Footnotes
Portions of this data was presented at ID Week 2012; San Diego, CA; 2012.
Conflicts of Interest and Source of Funding: The authors have no conflicts of interest to declare.
Publisher's Disclaimer: This is a PDF file of an unedited manuscript that has been accepted for publication. As a service to our customers we are providing this early version of the manuscript. The manuscript will undergo copyediting, typesetting, and review of the resulting proof before it is published in its final citable form. Please note that during the production process errors may be discovered which could affect the content, and all legal disclaimers that apply to the journal pertain.
Contributor Information
Sara C. KELLER, University of Pennsylvania Perelman School of Medicine, Division of Infectious Diseases Center for Healthcare Improvement and Patient Safety Philadelphia, PA, USA 230 N 21st St, Unit 907; Philadelphia, PA 19103 410-952-7572 (phone); 215-662-7899 (fax) kellersa@uphs.upenn.edu.
Baligh R. YEHIA, University of Pennsylvania Perelman School of Medicine, Division of Infectious Diseases Philadelphia, PA, USA.
Michael G. EBERHART, City of Philadelphia Department of Public Health AIDS Activities Coordinating Office Philadelphia, PA, USA.
Kathleen A. BRADY, City of Philadelphia Department of Public Health AIDS Activities Coordinating Office Philadelphia, PA, USA.
References
- 1.Office of National AIDS Policy . National HIV/AIDS strategy. Office of National AIDS Policy; Washington, DC: 2010. [September 27, 2012]. Available at http://www.whitehouse.gov/administration/eop/onap/nhas. [Google Scholar]
- 2.Centers for Disease Control and Prevention Vital signs: HIV prevention through care and treatment—United States. MMWR. 2011;60:1618–1623. [PubMed] [Google Scholar]
- 3.Fleishman JA, Yehia BR, Moore RD, Korthuis PT, Gebo KA. Establishment, retention, and loss to follow-up in outpatient HIV care. JAIDS. 2012;60:249–59. doi: 10.1097/QAI.0b013e318258c696. [DOI] [PMC free article] [PubMed] [Google Scholar]
- 4.Centers for Disease Control and Prevention HIV Surveillance—United States, 1981-2008. MMWR. 2011;60:689–693. [PubMed] [Google Scholar]
- 5.Marks G, Gardner LI, Craw J, Crepaz N. Entry and retention in medical care among HIV-diagnosed persons: a meta-analysis. AIDS. 2010;24:2665–2678. doi: 10.1097/QAD.0b013e32833f4b1b. [DOI] [PubMed] [Google Scholar]
- 6.Craw JA, Gardner LI, Marks G, Rapp RC, Bosshart J, Duffas WA, et al. Brief strengths-based case management promotes entry into HIV medical care: results of the antiretroviral treatment access study II. JAIDS. 2008;47:597–606. doi: 10.1097/QAI.0b013e3181684c51. [DOI] [PubMed] [Google Scholar]
- 7.Panel on Antiretroviral Guidelines for Adults and Adolescents . Guidelines for the use of antiretroviral agents in HIV-1-infected adults and adolescents. US Department of Health and Human Services; Washington, DC: 2011. [September 27, 2012]. Available at http://www.aidsinfo.nih.gov/contentfiles/adultandadolescentgl.pdf. [Google Scholar]
- 8.Tripathi A, Youmans E, Gibson JJ, Duffus WA. The impact of retention in early HIV medical care on viro-immunologic parameters and survival: a statewide study. AIDS Res Hum Retroviruses. 2011;27:751–8. doi: 10.1089/AID.2010.0268. [DOI] [PubMed] [Google Scholar]
- 9.Yehia BR, Fleishman JA, Metlay JP, Korthuis PT, Agwu AL, Berry SA, et al. Comparing different measures of retention in outpatient HIV care. AIDS. 2012;26:1131–9. doi: 10.1097/QAD.0b013e3283528afa. [DOI] [PMC free article] [PubMed] [Google Scholar]
- 10.Health Resources and Services Administration [January 30, 2013];HAB HIV Core Clinical Performance Measures Group 1. Adult/Adolescent Clients: Group 1. 2009 Available at: http://hab.hrsa.gov/deliverhivaidscare/files/habgrp1pms08.pdf.
- 11.Roberts KJ, Grusky O, Swanson AN. Outcomes of blood and oral fluid rapid HIV testing: a literature review, 2000-2006. AIDS Patient Care STDs. 2007;21:621–637. doi: 10.1089/apc.2006.0196. [DOI] [PubMed] [Google Scholar]
- 12.Centers for Disease Control and Prevention [March 17, 2013];Fact sheet: HIV in the United States: stages of care. 2012 Jul; Available at: http://www.cdc.gov/nchhstp/newsroom/docs/2012/Stages-of-CareFactSheet-508.pdf.
- 13.Garland PM, Valverde EE, Fagan F, Beer L, Sanders C, Hillman D, et al. HIV counseling, testing, and referral experiences of persons diagnosed with HIV who have never entered HIV medical care. AIDS Educ Prev. 2011;23(Suppl 3):117–127. doi: 10.1521/aeap.2011.23.3_supp.117. [DOI] [PubMed] [Google Scholar]
- 14.Branson BM, Handsfield HH, Lampe MA, Janssen RS, Taylor AW, Lyss SB, et al. Revised recommendations for HIV testing of adults, adolescents, and pregnant women in health-care settings. MMWR. 2006;55(RR 14):1–17. [PubMed] [Google Scholar]
- 15.Centers for Disease Control and Prevention Revised guidelines for HIV counseling, testing, and referral. MMWR Recomm Rep. 2001;50(RR-19):1–57. [PubMed] [Google Scholar]
- 16.Hidalgo J, Coombs E, Cobbs WO, Green-Jones M, Phillips G, Wohl AR, et al. Roles and challenges of outreach workers in HIV clinical and support programs serving young racial/ethnic minority men who have sex with men. AIDS Patient Care STDS. 2011;25(Suppl 1):S15–22. doi: 10.1089/apc.2011.9880. [DOI] [PubMed] [Google Scholar]
- 17.Hoxhaj S, Davila JA, Modi P, Kachalia N, Malone K, Ruggerio MC, et al. Using nonrapid HIV technology for routine, opt-out HIV screening in a high-volume urban emergency department. Ann Emerg Med. 2011;58(Suppl 1):S79–84. doi: 10.1016/j.annemergmed.2011.03.030. [DOI] [PubMed] [Google Scholar]
- 18.Sattin RW, Wilde JA, Freeman AW, Miller KM, Dias JK. Rapid HIV testing in a southeastern emergency department serving a semiurban-semirural adolescent and adult population. Ann Emerg Med. 2011;58(Suppl 1):S60–4. doi: 10.1016/j.annemergmed.2011.03.026. [DOI] [PubMed] [Google Scholar]
- 19.Torres GW, Heffelfinger JD, Pollack HA, Barrera SG, Rothman RE. HIV screening programs in US emergency departments: a cross-site comparison of structure, process, and outcomes. Ann Emerg Med. 2011;58(Suppl 1):S104–13. doi: 10.1016/j.annemergmed.2011.03.034. [DOI] [PubMed] [Google Scholar]
- 20.Christopoulos KA, Kaplan B, Dowdy D, Haller B, Nassos P, Roemer R, et al. Testing and linkage to care outcomes for a clinician-initiated rapid HIV testing program in an urban emergency department. AIDS Patient Care STDS. 2011;25:439–44. doi: 10.1089/apc.2011.0041. [DOI] [PMC free article] [PubMed] [Google Scholar]
- 21.Blackstock OJ, King JR, Mason RD, Lee CC, Mannheimer SB. Evaluation of a rapid HIV testing initiative in an urban, hospital-based dental clinic. AIDS Patient Care STDS. 2010;24:781–5. doi: 10.1089/apc.2010.0159. [DOI] [PubMed] [Google Scholar]
- 22.Ulett KB, Willig JH, Lin HY, Routman JS, Abroms S, Allison J, et al. The therapeutic implications of timely linkage and early retention in HIV care. AIDS Patient Care STDs. 2009;23:41–9. doi: 10.1089/apc.2008.0132. [DOI] [PMC free article] [PubMed] [Google Scholar]
- 23.Molitor F, Waltermeyer J, Mendoza M, Kuenneth C, Aguirre A, Brockmann K, et al. Locating and linking to medical care HIV-positive persons without a history of care: findings from the California Bridge Project. AIDS Care. 2006;18:456–9. doi: 10.1080/09540120500217397. [DOI] [PubMed] [Google Scholar]
- 24.Glick NR, Silva A, Zun L, Whitman S. HIV testing in a resource-poor urban emergency department. AIDS Educ Prev. 2004;16:126–36. doi: 10.1521/aeap.16.2.126.29391. [DOI] [PubMed] [Google Scholar]
- 25.Martinez J, Bell D, Dodds S, Shaw K, Siciliano C, Walker LE, et al. Transitioning youths into care: linking identified HIV-infected youth at outreach sites in the community to hospital-based clinics and or community-based health centers. J Adolesc Health. 2003;33(Suppl 2):23–30. doi: 10.1016/s1054-139x(03)00159-9. [DOI] [PubMed] [Google Scholar]
- 26.Hightow-Weidman LB, Jones K, Wohl AR, Futterman D, Outlaw A, Phillips G, et al. Early linkage and retention in care: findings from the Outreach, Linkage, and Retention in Care Initiative Among Young Men of Color who have Sex with Men. AIDS Patient Care STDs. 2011;25(Suppl 1):S31–8. doi: 10.1089/apc.2011.9878. [DOI] [PubMed] [Google Scholar]
- 27.Rothman RE, Kelen GD, Harvey L, Shahan JB, Hairston H, Burah A, et al. Factors associated with no or delayed linkage to care in newly diagnosed Human Immunodeficiency Virus (HIV)-1-infected patients identified by emergency department-based rapid HIV screening programs in two urban EDs. Acad Emerg Med. 2012;19:497–503. doi: 10.1111/j.1553-2712.2012.01351.x. [DOI] [PubMed] [Google Scholar]
- 28.Reed JB, Hanson D, McNaghten AD, Bertolli J, Teshale E, Gardner L, et al. HIV testing factors associated with delayed entry into HIV medical care among HIV-infected persons from eighteen states, United States, 2000-2004. AIDS Patient Care and STDs. 2009;23:765–73. doi: 10.1089/apc.2008.0213. [DOI] [PubMed] [Google Scholar]
- 29.Ickovics JR, Forsyth B, Ethier KA, Harris P, Rodin J. Delayed entry into health care for women with HIV disease. AIDS Patient Care STDs. 1996;10:21–4. doi: 10.1089/apc.1996.10.21. [DOI] [PubMed] [Google Scholar]
- 30.Konkle-Parker D. How can we facilitate entry into and retention in HIV care? HIV Clin. 2010;22:10–11. [PMC free article] [PubMed] [Google Scholar]
- 31.Konkle-Parker DJ, Amico KR, Henderson HM. Barriers and facilitators to engagement in HIV clinical care in the Deep South: results from semi-structured patient interviews. Journal of the Association of Nurses in AIDS Care. 2011;22:90–99. doi: 10.1016/j.jana.2010.06.002. [DOI] [PMC free article] [PubMed] [Google Scholar]
- 32.Milberg J, Sharma R, Scott F, Conviser R, Marconi K, Parham D. Factors associated with delays in accessing HIV primary care in rural Arkansas. AIDS Patient Care STDs. 2001;15:527–32. doi: 10.1089/108729101753205694. [DOI] [PubMed] [Google Scholar]
- 33.Craw J, Gardner L, Rossman A, Gruber D, Noreen O, Jordan D, et al. Structural factors and best practices in implementing a linkage to HIV care program using the ARTAS model. BMC Health Serv Res. 2010;10:246. doi: 10.1186/1472-6963-10-246. [DOI] [PMC free article] [PubMed] [Google Scholar]
- 34.Aziz M, Smith KY. Challenges and successes in linking HIV-infected women to care in the United States. Clin Infect Dis. 2011;52(Suppl 2):S231–S237. doi: 10.1093/cid/ciq047. [DOI] [PubMed] [Google Scholar]
- 35.Mugavero MJ, Lin HY, Willig JH, Westfall AO, Ulett KB, Routman JS, et al. Missed visits and mortality among patients establishing initial outpatient HIV treatment. Clin Infect Dis. 2009;48:248–56. doi: 10.1086/595705. [DOI] [PMC free article] [PubMed] [Google Scholar]
- 36.Bhatia R, Hartman C, Kallen MA, Graham J, Giordano TP. Persons newly diagnosed with HIV infection are at high risk for depression and poor linkage to care: results from the Steps Study. AIDS Behav. 2011;15:1161–70. doi: 10.1007/s10461-010-9778-9. [DOI] [PMC free article] [PubMed] [Google Scholar]
- 37.Keller S, Jones J, Erbelding E. Choice of rapid HIV testing and entrance into care in Baltimore City sexually transmitted infections clinics. AIDS Patient Care STDS. 2011;25:237–43. doi: 10.1089/apc.2010.0298. [DOI] [PubMed] [Google Scholar]
- 38.Gardner LI, Metsch LR, Anderson-Mahoney P, Loughlin AM, del Rio C, Strathdee S, et al. Efficacy of a brief case management intervention to link recently diagnosed HIV-infected persons to care. AIDS. 2005;19:423–31. doi: 10.1097/01.aids.0000161772.51900.eb. [DOI] [PubMed] [Google Scholar]
- 39.Hsu LC, Chen M, Kali J, Pipkin S, Scheer S, Schwarcz S. Assessing receipt of medical care and disparity among persons with HIV/AIDS in San Francisco, 2006-2007. AIDS Care. 2011;23:383–392. doi: 10.1080/09540121.2010.507740. [DOI] [PubMed] [Google Scholar]
- 40.Torian LV, Wiewel EW, Liu KL, Sackoff JE, Frieden TR. Risk factors for delayed initiation of medical care after diagnosis of human immunodeficiency virus. Arch Intern Med. 2008;168:1181–7. doi: 10.1001/archinte.168.11.1181. [DOI] [PubMed] [Google Scholar]
- 41.Torian LV, Wiewel EW. Continuity of HIV-related medical care, New York City, 2005-2009: do patients who initiate care stay in care? AIDS Patient Care STDS. 2011;25:79–88. doi: 10.1089/apc.2010.0151. [DOI] [PubMed] [Google Scholar]
- 42.Bamford LP, Ehrenkranz PD, Eberhart MG, Shpaner M, Brady KA. Factors associated with delayed entry into primary care after HIV diagnosis. AIDS. 2010;24:928–930. doi: 10.1097/QAD.0b013e328337b116. [DOI] [PubMed] [Google Scholar]
- 43.Bertolli J, Shouse RL, Beer L, Valverde E, Fagan J, Jenness SM, et al. Using HIV surveillance data to monitor missed opportunities for linkage and engagement in HIV medical care. Open AIDS J. 2012;6(Suppl 1):131–41. doi: 10.2174/1874613601206010131. [DOI] [PMC free article] [PubMed] [Google Scholar]
- 44.Holtgrave DR. On the epidemiologic and economic importance of the National AIDS Strategy for the United States. J Acquir Immune Defic Syndr. 2010;55:139–42. doi: 10.1097/QAI.0b013e3181f4107a. [DOI] [PubMed] [Google Scholar]
- 45.Silva A, Glick NR, Lyss SB, Hutchinson AB, Gift TL, Pealer LN, et al. Implementing an HIV and sexually transmitted disease screening program in an emergency department. Ann Emerg Med. 2007;49:564–572. doi: 10.1016/j.annemergmed.2006.09.028. [DOI] [PubMed] [Google Scholar]
- 46.White DA, Scribner AN, Schulden JD, Branson BM, Heffelfinger JD. Results of a rapid HIV screening and diagnostic testing program in an urban emergency department. Ann Emerg Med. 2009;54:56–64. doi: 10.1016/j.annemergmed.2008.09.027. [DOI] [PubMed] [Google Scholar]
- 47.Dombrowski JC, Kent JB, Buskin SE, Stekler JD, Golden MR. Population-based metrics for the timing of HIV diagnosis, engagement in HIV care, and virologic suppression. AIDS. 2012;26:77–86. doi: 10.1097/QAD.0b013e32834dcee9. [DOI] [PMC free article] [PubMed] [Google Scholar]
- 48.Centers for Disease Control and Prevention and Council of State and Territorial Epidemiologists . Technical Guidance for HIV/AIDS Surveillance Programs, Volume I: Policies and Procedures. Centers for Disease Control and Prevention; Atlanta, Georgia: 2005. [January 30, 2013]. Available at: http://www.cdph.ca.gov/programs/aids/Documents/COPCDCSurvTechGuidanceVol1.pdf. [Google Scholar]
- 49.Ikard K, Janney J, Hsu LC, Isenberg CJ, Scalco MB, Schwarcz S, et al. Estimation of unmet need for HIV primary medical care: a framework and three case studies. AIDS Educ Prevent. 2005;17(Suppl B):26–38. doi: 10.1521/aeap.2005.17.Supplement_B.26. [DOI] [PubMed] [Google Scholar]
- 50.Health Resources and Services Administration [January 30, 2013];HAB HIV Core Clinical Performance Measures Group 1. Adult/Adolescent Clients: Group 1. 2009 Available at: http://hab.hrsa.gov/deliverhivaidscare/files/habgrp1pms08.pdf.
- 51.STARD Steering Committee [March 22, 2013];STARD statement. 2013 http://www.stard-statement.org.
- 52.Dean B, Debes R, Bozzette S, Buchacz K, Brooks J, the HIV Outpatient Study Investigators HIV laboratory tests used as a proxy for medical visits for defining engagement in care.. 20th Conference on Retroviruses and Opportunistic Infections; Atlanta, GA. March 3-6, 2013; Abstr No. 1036. [Google Scholar]
- 53.Mugavero MJ, Davila JA, Nevin CR, Giordano TP. From access to engagement: measuring retention in outpatient HIV clinical care. AIDS Pt Care STDs. 2010;24(10):607–13. doi: 10.1089/apc.2010.0086. [DOI] [PMC free article] [PubMed] [Google Scholar]
- 54.Mugavero MJ, Westfall AO, Zinski A, Davila J, Drainoni ML, Gardner LI, et al. Measuring retention in HIV care: the inclusive gold standard. JAIDS. 2012;61(5):574–80. doi: 10.1097/QAI.0b013e318273762f. [DOI] [PMC free article] [PubMed] [Google Scholar]
- 55.Terzian AS, Bodach SD, Wiewel EW, Sepkowitz K, Bernard MA, Braunstein SL, et al. Novel use of surveillance data to detect HIV-infected persons with sustained high viral load and durable virologic suppression in New York City. PLoS One. 2012;7(1):e29679. doi: 10.1371/journal.pone.0029679. [DOI] [PMC free article] [PubMed] [Google Scholar]
- 56.Althoff K, Rebeiro P, Horberg M, Buchacz K, Gebo K, Sterling T, et al. Application of indicators to monitor US Department of Health and Human Services-funded HIV services in the North American AIDS Cohort Collaboration on Research and Design.. 20th Conference on Retroviruses and Opportunistic Infections; Atlanta, GA. March 3-6, 2013; Abstr No. 1026. [Google Scholar]
- 57.Dombrowski J, Kent J, Buskin S, Stekler J, Barash E, Bennett A, et al. An encouraging HIV care cascade: anomaly, progress, or just more accurate data?. 20th Conference on Retroviruses and Opportunistic Infections; Atlanta, GA. March 3-6, 2013; Abstr No. 1027. [Google Scholar]
- 58.Doshi R, Matthews T, Isenberg D, Matosky M, Milberg J, Malitz F, et al. Continuum of HIV care among Ryan White HIV/AIDS Program clients: US, 2010.. 20th Conference on Retroviruses and Opportunistic Infections; Atlanta, GA. March 3-6, 2013; Abstr No. 1031a. [Google Scholar]
- 59.Horberg M, Hurley L, Towner W, Gambatese R, Klein D, Antoniskis D, et al. HIV spectrum of engagement cascade in a large integrated care system by gender, age, and methodologies.. 20th Conference on Retroviruses and Opportunistic Infections; Atlanta, GA. March 3-6, 2013; Abstr No. 1033. [Google Scholar]
- 60.Rebeiro P, Althoff KN, Buchacz K, Gill MJ, Horberg M, Krentz H, et al. Retention among North American HIV-infected persons in clinical care, 2000-2008. JAIDS. 2012 doi: 10.1097/QAI.0b013e31827f578a. [Epub ahead of print] [DOI] [PMC free article] [PubMed] [Google Scholar]
- 61.Thompson MA, Aberg JA, Hoy JF, Telenti A, Benson C, Cahn P, et al. Antiretroviral treatment of adult HIV infection: 2012 recommendations of the International Antiviral Society-USA panel. JAMA. 2012;308(4):387–402. doi: 10.1001/jama.2012.7961. [DOI] [PubMed] [Google Scholar]
Associated Data
This section collects any data citations, data availability statements, or supplementary materials included in this article.