

Abstract
Cerium dioxide nanoparticles (CeO2 NPs) are an engineered nanomaterial that possesses unique catalytic, oxidative and reductive properties. Currently, CeO2 NPs are being used as a fuel catalyst but these properties are also utilized in the development of potential drug treatments for radiation and stroke protection. These uses of CeO2 NPs present a risk for human exposure; however, to date no studies have investigated the effects of CeO2 NPs on the microcirculation following pulmonary exposure. Previous studies in our laboratory with other nanomaterials have shown impairments in normal microvascular function after pulmonary exposures. Therefore, we predicted that CeO2 NP exposure would cause microvascular dysfunction that is dependent on the tissue bed and dose. Twenty-four hour post exposure to CeO2 NPs (0–400 μg), mesenteric and coronary arterioles were isolated and microvascular function was assessed. Our results provided evidence that pulmonary CeO2 NP exposure impairs endothelium-dependent and -independent arteriolar dilation in a dose-dependent manner. The CeO2 NP exposure dose which causes a 50% impairment in arteriolar function (EC50) was calculated and ranged from 15 – 100 μg depending on the chemical agonist and microvascular bed. Microvascular assessments with acetylcholine revealed a 33–75% reduction in function following exposure. Additionally, there was a greater sensitivity to CeO2 NP exposure in the mesenteric microvasculature due to the 40% decrease in the calculated EC50 compared to the coronary microvasculature EC50. CeO2 NP exposure increased mean arterial pressure in some groups. Taken together these observed microvascular changes may likely have detrimental effects on local blood flow regulation and contribute to cardiovascular dysfunction associated with particle exposure.
Keywords: Cerium dioxide, mesentery, coronary, arteriole, microcirculation, engineered nanomaterial
Introduction
Engineered nanomaterials (ENM) have recently emerged both as integral components in manufacturing, and as innovative materials to address challenges in therapeutics and diagnostics, ranging from drug delivery to imaging. However, answers to questions regarding ENM toxicity remain far behind production. ENM are defined as a homogenous mixture of particles that are less than 100 nm in size in at least one direction, and are engineered to take advantage of unique physical characteristics displayed at this size (1). Additionally, the Environmental Protection Agency (EPA) recently recognized that ENM have different inherent characteristics and should be considered distinctly different from their larger counterparts of the same composition (2).
ENM are being developed specifically for use in food, drug delivery, and numerous industrial and household products (3;4). Cerium dioxide nanoparticles (CeO2 NPs) has been implemented for public use, in the United States and Europe, widely as a diesel fuel additive (5). In this regard, CeO2 nanoparticles act as a catalyst to increase combustion efficiency, which decreases the large soot emissions commonly associated with diesel engines (5;6). This use holds great promise in decreasing particulate matter (PM) air pollution emissions that have been historically associated with increases in cardiovascular morbidity and mortality; however, because nano-CeO2 is released in emissions, a widespread inhalation hazard exists (1). Furthermore, aerosolized nano-CeO2 poses a serious environmental hazard as well. Although the half-life of nano-CeO2 in water or soil is unknown, it is reasonable to speculate that nano-CeO2 will remain in the environment for an indefinite amount of time due to the extreme conditions needed for degradation (7). Additionally, nano-CeO2 has been shown to be biopersistent in the body and can remain in the lungs for at least 15 years (8–10). This evidence supports the concept that nano-CeO2 may potentially enter the water supply or food chain, ultimately posing an additional human exposure risk.
Aside from its catalytic properties, nano-CeO2 also possesses the ability to drive reduction- oxidation (redox) chemistry (11). CeO2 NPs exists in two valence states (Ce3+ and Ce4+) and shifts between these states by reacting with free radicals such as superoxide (11;12). Researchers are taking advantage of this shift between valence states and using CeO2 nanoparticles to help reduce cellular damage from radiation therapy and strokes (13;14).
Due to its unique properties, CeO2 NPs have the potential to enter the body by multiple exposure routes (inhalation, injection, and ingestion), and may therefore pose a threat to human health (15). CeO2 nanoparticle toxicity research has focused essentially on pulmonary exposures. Pulmonary CeO2 nanoparticle exposure has been shown to increase neutrophils and eosinophils and stimulate granuloma formation in the lungs, as determined by the increase in cellular damage (16;17). Additionally, there has been increased alveolar macrophage activation and death after pulmonary CeO2 NP exposure (16).
The microcirculation needs to be thoroughly examined following ENM exposure because normal function at this critical level of the vasculature contributes significantly to total peripheral resistance and blood flow distribution. Furthermore, many pathological conditions (e.g. hypertension and diabetes) initially manifest in the microcirculation (18;19). The microcirculation is broadly defined as the arterioles, capillaries and venules contained within an organ. The arterioles are primarily responsible for resistance, thereby distributing blood flow and decreasing pressure to a level that does not cause damage to downstream capillaries (20;21). The arterioles respond to a variety of chemical, mechanical and metabolic stimuli; if these resistance vessels do not respond appropriately to these factors, a change in total peripheral resistance may occur that could alter mean arteriole pressure (MAP), blood flow distribution and/or cause downstream over or under perfusion (19). The impact of CeO2 NP exposure on cardiovascular function is poorly understood. This ENM has shown signs of liver toxicity, as well as vascular impairment in the aorta; however, to date, no studies have focused on identifying the impact of pulmonary CeO2 nanoparticle exposure on systemic microvascular function (22;23).
Previous work in our laboratory has determined that pulmonary ultrafine titanium dioxide (TiO2) exposure causes systemic microvascular dysfunction, despite relatively minor lung inflammation; however, pulmonary inflammation following CeO2 NP exposure is greater than that reported for ultrafine TiO2 at similar doses (16;24;25). Based on these differences in inflammation, we hypothesize that CeO2 NP exposure will impair microvascular function to a greater degree than that of ultrafine TiO2. The goals of this study were: (1) to examine the effects of pulmonary CeO2 NP exposure on mesenteric and coronary arterioles and (2) to identify a dose response curve. These two microvascular beds were selected to determine if there was a difference in microvascular function after ENM exposure between microvascular beds with high (coronary) and low (mesentery) metabolic demand. Because the metabolic state of a given tissue may influence the ultimate impact of any toxicant associated mechanism, it is important to study divergent microvascular beds.
Methods and Materials
Cerium Dioxide Nanoparticle (CeO2 NP) Production and Characterization
CeO2 NP powders were synthesized by a hydrothermal process (26). Cerium (IV) ammonium nitrate (99+% Alfa Aesar) was added to de-ionized water (H2O) and this solution was added drop-wise into a basic solution of tetramethylammonium hydroxide pentahydrate (TMAOH) and de-ionized H2O. The pH of the dispersion was altered to ~10.5 with ammonium hydroxide and was maintained throughout the reaction. The dispersion was placed in a 300 ml Autoclave Engineers EZE-Seal® autoclave at 240°C for 1 h. Once removed from the autoclave vessel, the dispersion was placed into a centrifuge and the liquid was removed and replaced with ethanol. After the washing step, the dispersion was dried at 60°C overnight and sieved through a 200 mesh screen for characterization. The synthesized CeO2 nanoparticles displayed an average surface area of 81.36 m2/g measured by Micromeritics ASAP 2020. The average agglomerate size in Normosol (isotonic saline) and 5% fetal bovine serum (FBS) was determined using dynamic light scattering (DLS) technique using a Malvern Zetasizer version 7.01.
The chemical states on the surface of the nanomaterials from the Ce 3d orbital, C and O 1s orbitals were characterized by x-ray photoelectron spectroscopy (XPS, PHI 5000 Versaprobe XPS). The x-ray source was operated at 15 kV and 25 watts using Al Kα (1486.6 eV) radiation. A 0.05 eV step was used for the detailed scan. All coatings surfaces were cleaned prior to spectral analysis to remove atmospheric and post-depositional contamination with Argon ion sputter cleaning at 2 kV accelerating voltage for 30 seconds. The analysis chamber pressure was maintained at (~10−11 Torr) during the measurement. The nanomaterial morphology and agglomerate size was imaged using a JEOL JEM-2100 High Resolution Transmission Electron Microscope (TEM).
Experimental Animals and Exposure
Male Sprague-Dawley rats (8–11 weeks old) were purchased from Hilltop Laboratories (Scottdale, PA). The rats were housed at the National Institute for Occupational Safety and Health (NIOSH) or West Virginia University animal facilities. The rats were housed in ventilated cages, under controlled humidity and temperature, with a 12 hour (hr) light/dark cycle and food and water were provided ad libitum. The animals were acclimated for at least 2 days prior to use. All procedures were approved by the Animal Care and Use Committees at West Virginia University and NIOSH.
CeO2 Nanoparticle Exposure
For the stock solutions, the dry powder was weighed and added to 10 ml of saline (Normosol) with 5% (FBS) to reduce agglomeration. The CeO2 NPs were vortexed for 5 minutes and then sonicated on ice for another 5 minutes. Rats were lightly anesthetized with isoflurane gas (5% induction) and intratracheally instilled with a 300 μl bolus dose of CeO2 NPs stock solution to achieve the following final doses: 0, 10, 50, 100, 200, and 400 μg. Rats were monitored after instillation until they regained consciousness. All animals recovered for 24 hr prior to bronchoalveolar lavage (BAL) or isolated microvessel experiments. Previous studies have shown that the saline and FBS vehicle do not induce mechanical artifacts in terms of BAL and systemic microcirculation in control rats (25;27).
Pulmonary Inflammation Assessment
A subset of 8 rats per dose (0, 10, 100, and 400 μg of CeO2 NPs) were euthanized with sodium pentobarbital (≥ 100 mg/kg, intraperitoneal injection). The trachea was cannulated and BAL was performed using ice-cold Ca2+/Mg2+ -free phosphate buffered saline (PBS). The first lavage (6 ml) was kept separate from the rest of the lavage sample. Subsequent lavages used 10 ml PBS until 40 ml lavage fluid was collected. The samples were centrifuged at 650 × g, 5 min at 4°C. The supernatant from the first lavage was saved for lactate dehydrogenase (LDH) and albumin assays. The pooled cells were resuspended in HEPES-buffered medium and cell counts were determined with an electronic cell counter equipped with a cell-sizing attachment.
Cytospin Preparation
1×10⁶ BAL cells [both alveolar macrophages (AM) and polymorphonuclear leukocytes (PMN)] in 200 μl HEPES-buffered medium were prepared with a cytocentrifuge. The cytospin preparations were stained with modified Wright-Giemsa stain and cell differentials were determined by light microscopy. The differential cell counts were calculated by multiplying the total cell count by the cell differential percentage obtained from the cytospin preparations.
LDH Activity and albumin protein assays
LDH and albumin measurements were taken the same day as the BAL was performed. The techniques have previously been described (28). Briefly, the LDH activity was used as a marker of cytotoxicity and was measured by monitoring the LDH driven oxidation of pyruvate coupled with the reduction of nicotinamide adenine dinucleotide at 340 nm using a commercial assay kit (Roche Diagnostic Systems, NJ). The concentration of albumin was monitored as an indicator of the cellular integrity. This measurement was made with a commercially available kit (Sigma Chemical Co., MO) and was based on albumin binding to bromcresol green and measuring the color change at 628 nm.
AM Chemiluminescence
Resting AM chemiluminescence was identified by incubating 1×10⁶ AM/mL at 37 °C for 20 minutes, followed by the addition of luminol (0.08 μg/mL) and then the chemiluminescence was measured. To identify zymosan-stimulated chemiluminescence, unopsonized zymosan (2 mg/mL) was added immediately prior to measurement. All measurements were made with an automated luminometer at 390–620 nm for 15 minutes.
MAP Acquisition and Microvessel Preparation
Rats were anesthetized with isoflurane gas (5% induction, 3–3.5% maintenance). The animals were placed on a heating pad to maintain a 37 °C rectal temperature. The trachea was intubated to ensure an open airway and the right carotid artery was cannulated to acquire MAP. The MAP will be recorded via a pressure transducer and recorded by PowerLab830. The heart and/or the mesentery were removed and placed in a dissecting dish with physiological salt solution (PSS) maintained at 4 °C. Coronary arterioles from the 3rd–5th branch off the left anterior descending (LAD) artery, and 4th or 5th order mesenteric arterioles were isolated, transferred to a vessel chamber, cannulated between two glass pipettes, and tied with silk sutures in the vessel chamber (Living Systems Instrumentation, Burlington, VT). The chamber was superfused with fresh oxygenated (5% CO2/21% O2) PSS and warmed to 37 °C. Arterioles were pressurized to 45 mm Hg (coronary) or 80 mm Hg (mesenteric) using a servo control system and extended to their in situ length (29;30). Internal and external arteriolar diameters were measured using video callipers (Colorado Video, Boulder, CO).
Arteriolar Reactivity
Arterioles were allowed to develop spontaneous tone. After equilibration, various parameters of arteriolar function were analyzed.
Endothelium-dependent dilation
The arterioles were exposed to increasing concentrations of acetylcholine (ACh, 10−9 - 10−4 M) or A23187, a Ca2+ ionophore (10 −9 -10 −5 M) added to the vessel chamber.
Endothelium-independent dilation
Increasing concentrations of either sodium nitroprusside (SNP, 10−9 - 10−4 M) or a spontaneous NO donor, spermine NONOate (SPR, 10−9 -10 −4 M) were used to assess arteriolar smooth muscle responsiveness.
Myogenic Responsiveness
Myogenic responses were analyzed by increasing the intraluminal pressure by 15 mm Hg increments from 0 –90 mm Hg for coronary arterioles and 0–105 mm Hg for mesenteric arterioles.
Arteriolar Vasoconstriction
The arterioles were exposed to increasing concentrations of phenylephrine (PE, 10 −9 - 10 −4 M) or serotonin (5-HT, 10 −9 -10 −4 M). The steady state diameter of the vessel was recorded for at least 2 min after each dose. After each dose curve was completed, the vessel chamber was washed to remove excess chemicals by carefully removing the superfusate and replacing it with fresh warmed oxygenated PSS. After all experimental treatments were complete, the PSS was replaced with Ca2+-free PSS until maximum passive diameter was established. All arterioles with ≤ 20% spontaneous tone or ≥ 150 μm were not analyzed.
Equations and Statistics
Data are expressed as means ± standard error. Spontaneous tone was calculated by the following equation: , where DM is the maximal diameter and DI is the initial steady state diameter recorded prior to the experiment. Active responses to pressure were normalized to the maximal diameter using the following formula: , where DSS is the steady state diameter recorded during each pressure change. The experimental responses to ACh, A23187, SNP, and SPR are expressed using the following equation: , where DCon is the control diameter recorded prior to the dose curve, DSS is the steady state diameter at each dose of the curve. The experimental response to PE and 5-HT are expressed using the following equation: . Wall thickness (WT) was calculated from the measurement of both inner (ID) and outer (OD) steady state arteriolar diameters at the end of the Ca2+ free wash using the following equation: . Wall-to-lumen ratio (WLR) was calculated using the following equation: . Point-to-point differences in the dose response curves were evaluated using two-way repeated measures analysis of variance (ANOVA) with a Bonferroni post-hoc analysis when significance was found. The slopes of the dose response curves were determined through a nonlinear regression. The BAL data, animal characteristics, vessel characteristics and dose response curve slopes were analyzed using a one-way ANOVA with a Bonferroni post-hoc analysis when significance was found. The concentration at which a 50% impairment in function (EC50) was determined using a four parameter logistics analysis. All statistical analysis was completed with GraphPad Prism 5 (San Diego, CA) and SigmaPlot 11.0 (San Jose, CA). Significance was set at p < 0.05.
Results
CeO2 Nanoparticle Characteristics
Figure 1A displays the low magnification TEM image of the particles; the micrograph shows that the dried synthesized suspension leads to a highly agglomerated state. The higher magnification micrograph (Figure 1B) shows that the primary CeO2 nanoparticles were ~4 nm in average size with a spherical morphology and a calculated surface area of 81.36 m2/g. The average agglomerate size in normosol and FBS stock solution was measured to be 191 77 nm with a wide Gaussian distribution (Figure 1C).
Figure 1.

TEM Images of CeO2 nanoparticles at A) low magnification B) high magnification. Red dashes indicate individual particles that were estimated to be 4–6 nm. C) DLS distribution curve of the suspended CeO2 NPs with an average agglomerate size for peak 1: 191 ± 77 nm; peak 1: 901 ± 391 nm; peak 3: 5081 ± 566 nm.
Initially, XPS data was collected for the 3d orbital photo-electron line for Ce between 870–930 eV (not shown). The deconvolution of the Ce 3d orbital data is very complex due to the multiple states that exist for the Ce 4f orbital level occupancy (31). Therefore, the distinction of the Ce3+ and Ce4+ contribution is difficult to extract with the overlapping Ce 3d orbital features of each Ce ion (7). An indirect method to separate the presence of Ce3+ and Ce4+ is through the analysis of the O ion through the O 1s orbital XPS spectra. It is known that the binding energy of O to Ce3+ is approximately 1–2 eV higher than the binding energy to Ce4+ (7;32). Before completing the O 1s orbital analysis, an XPS scan was completed between 281–294 eV to determine the state of the residual C, and more importantly, the presence of C bonded to O. As displayed in the XPS graph (Figure 2A), carbon has four different chemical states on CeO2 NPs surface; the spectra identified C (284.7 eV), C-O (alcohols and carboxyl at 286.4 eV and 288.4 eV, respectively) and C-N (287.8 eV) remaining on the dried surface (33), which may be the result of surface reactions with the ammonia additives, washing process, and saline suspension in this work. This data provides evidence that the O 1s orbital spectra will display a contribution of the C-O bonding, and this knowledge will need to be considered in the deconvolutions of the O 1s orbital scan.
Figure 2.
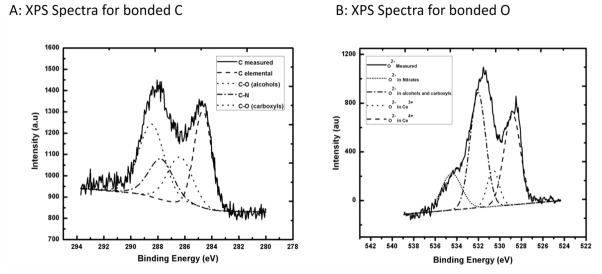
XPS Spectra of the hydrothermally synthesized and dried CeO2 nanoparticles with deconvoluted peaks using a Gaussian fit A) C 1s B) O 1s.
Figure 2B displays the XPS scan of the O 1s orbital scan between the binding energies of 525–538 eV. The data graph displays that oxygen has five different chemical states on the CeO2 NPs surface. As discussed for Figure 2A, the oxygen is bound within alcohols and carboxyls, but the data also provides evidence that a portion of the oxygen is also bound within various nitrates (~534.50 eV for O 1s orbital in nitrates). It is important to note that nearly 50% of O−2 measured was bound within alcohols, carboxyls and nitrates on the CeO2 NPs surface. The remaining part of the O−2 spectra was bound to Ce. By including these contributions within the analysis, the measured XPS spectrum provides evidence that the nanomaterial surface consists of ~19% Ce3+ (530.6 eV for O 1s orbital Ce2O3) and ~81% Ce4+ (529.1 eV for O 1s orbital in CeO2).
Group Characteristics
There were no significant differences found in body weight, age, or heart weight when comparing the control and exposed groups (Table I). A significant difference was found between the 10 μg and 100 μg exposure groups for MAP (Table I). There may also be a significant difference between the control group and the 100 μg group (p=0.055) which warrants further investigation into the changes in MAP after sCeO2 NP exposure.
Table I.
Animal Characteristics
| Groups | N | Age (weeks) | Weight (g) | MAP (mm Hg) | Heart Weight (g) |
|---|---|---|---|---|---|
| Control-Saline | 34 | 10 ± 0.4 | 357 ± 4 | 103 ± 2 | 1.27 ± 0.02 |
| 10 μg CeO2 NPs | 12 | 8 ± 0.3 | 370 ± 11 | 90 ± 4 | 1.29 ± 0.05 |
| 50 μg CeO2 NPs | 17 | 9 ± 0.2 | 366 ± 7 | 101 ± 3 | 1.33 ± 0.04 |
| 100 μg CeO2 NPs | 35 | 10 ± 0.4 | 352 ± 4 | 111 ± 3* | 1.23 ± 0.02 |
| 200 μg CeO2 NPs | 14 | 9 ± 0.3 | 362 ± 7 | 102 ± 2 | 1.29 ± 0.05 |
| 400 μg CeO2 NPs | 14 | 9 ± 0.3 | 374 ± 6 | 100 ± 2 | 1.33 ± 0.04 |
Values are means ± SE. N=number of animals. MAP=Mean Arterial Pressure
P≤0.05 vs. 10 μg CeO2 NPs
Pulmonary Inflammation
BAL was performed to assess pulmonary inflammation post CeO2 NP exposure. There was a significant increase in LDH 24 hr post instillation in the 100 and 400 μg CeO2 NP exposure groups (Figure 3A). This indicated an increase in cytotoxicity; however, there was no change in albumin indicating the epithelial-endothelium gas exchange barrier was intact (Figure 3B). The activation of AM was also measured through zymogen stimulated chemiluminescence. There was a significant increase in the activated AM after exposure to 100 and 400 μg CeO2 NPs (Figure 3C). Finally, there was a significant increase in PMNs in the groups exposed to the two highest doses of CeO2 NPs (Figure 3D). Taken together, these data provide evidence that dose-dependent pulmonary inflammation is present after exposure to CeO2 NPs.
Figure 3.

Pulmonary inflammation was altered after exposure to CeO2 NPs. There was a significant increase in LDH (A), AM activation (C), and PNM inflitration (D). However, there was no change in albumin (B) levels after exposure. Values are means ± SE. † p ≤ 0.05 vs. control; ^ p ≤ 0.05 vs. 100 μg CeO2 NPs.
Vessel Characteristics
There were no significant differences in vessel size, spontaneous tone, wall to lumen ratio or wall thickness between the control and exposed coronary arterioles; similar results were obtained in the mesenteric arterioles (Table II). This provides evidence that basal arteriolar tone and/or anatomy are not affected after CeO2 NP exposure. However, this assessment was made in vitro, and while the effects on basal tone in vivo may be different; this assessment is outside the scope of this manuscript.
Table IIA.
Mesentery Arteriole Characteristics
| Groups | n | Diameter (μm) | Tone (%) | WT (μrn) | WLR | |
|---|---|---|---|---|---|---|
| Steady State | Max | |||||
| Control-Saline | 31 | 70 ± 3 | 101 ± 3 | 31 ± 1 | 11 ± 1 | 0.11 ± 0.01 |
| 10 μ CeO2 NPs | 14 | 73 ± 4 | 105 ± 5 | 31 ± 2 | 10 ± 1 | 0.09 ± 0.01 |
| 50 μg CeO2 NPs | 15 | 73 ± 3 | 101 ± 4 | 28 ± 1 | 10 ± 1 | 0.10 ± 0.01 |
| 100 μg CeO2 NPs | 24 | 76 ± 3 | 109 ± 3 | 31 ± 1 | 10 ± 1 | 0.10 ± 0.01 |
| 200 μg CeO2 NPs | 13 | 72 ± 4 | 105 ± 5 | 31 ± 2 | 10 ± 1 | 0.10 ± 0.01 |
| 400 μg CeO2 NPs | 12 | 68 ± 3 | 96 ± 4 | 30 ± 2 | 11 ± 1 | 0.11 ± 0.01 |
Values are means ± SE. n=number of vessels. WT= Wall Thickness WLR= Wall to Lumen Ratio
Endothelium-Dependent Dilation
Endothelium-dependent dilation was stimulated with increasing concentrations of either ACh or A23187. There was a reduced endothelium-dependent response to ACh in coronary and mesenteric arterioles (Figure 3A and B). Additionally, from the CeO2 NP dose response curve, 100 μg CeO2 NPs were determined to be maximum effect dose in the mesenteric arterioles (Figure 4A) and 200 μg CeO2 NPs in coronary arterioles (Figure 4B). The lowest observable dose could not be determined based on the concentrations used for these experiments (Figure 4A and B).
Figure 4.

ACh-induced vasodilation was impaired in mesenteric (A; n=8–13) and coronary (B; n=7–9) arterioles from groups 24 hr post-exposure to CeO2 NPs. Values are means ± SE. † p ≤ 0.05 vs. control; * p ≤ 0.05 vs. 10 μg CeO2 NPs. The right panel represents the responses of the various doses of CeO2 NPs and was analyzed by nonlinear regression. The left panel highlights the point-to-point differences between the control and CeO2 NP exposed group.
Because ACh activates additional pathways other than nitric oxide (NO) production, A23187, a Ca2+ iontophore, was also used to more directly activate nitric oxide synthase (NOS). Arterioles from both microvascular beds showed a significant impairment in responsiveness to increasing concentrations of A23187 (Figure 5A and B). When analyzing the responses to A23187 for mesenteric microvessels, it was noted that at 1 × 10⁻⁵ M, the arterioles constricted. This may indicate that either exposure to CeO2 NPs alters the arterioles sensitivity of A23187 or this concentration of A23187 is stimulating greater changes in smooth muscle intracellular Ca2+, which would promote constriction (Figure 5A). Due to this constriction, 1 × 10⁻⁶ M was used to determine the maximum effect dose (200 μg) of CeO2 NPs for mesenteric arterioles. The constriction, at 1 × 10⁻⁵ M was not observed in the coronary arterioles; therefore this concentration of A23187 was used to determine the maximum effect dose (200 μg) of CeO2 NPs. Taken together, these data provided evidence of an impaired endothelium-dependent dilation after CeO2 NP exposure.
Figure 5.

The Ca2+ iontophore (A23187)-induced vasodilation was impaired in mesenteric (A; n=6–11) and coronary (B; n=6–8) arterioles from groups 24 hr post-exposure to CeO2 NPs. Values are means ± SE. † p ≤ 0.05 vs. control. The right panel represents the responses of the various doses of CeO2 NPs and was analyzed by nonlinear regression. The left panel highlights the point-to-point differences between the control and CeO2 NP exposed group.
Endothelium-Independent Dilation
Vascular smooth muscle (VSM) NO sensitivity was assessed with the NO donor, SNP. In both coronary and mesenteric arterioles, there was a decreased NO sensitivity 24 hr after exposure to 100 μg CeO2 NPs (Figure 6A and B), which impairs the arterioles ability to dilate. However, since SNP needs to contact a biological membrane in order to release NO, we also used a spontaneous NO donor, SPR, to exclude the possibility that the results obtained from SNP were due to the differential release of NO from SNP (34). A similar attenuated dilation was observed in response to SPR (Figure 7A and B). This response appeared to be dependent on the CeO2 NP dose and the maximal effect dose for both microvascular beds was 200 μg CeO2 NPs (Figure 7A and B). Taken together, the data for the NO donor provides evidence that impaired endothelium-independent dilation may be attributed to a decrease in NO sensitivity after CeO2 NP exposure.
Figure 6.

SNP-induced vasodilation was impaired in mesenteric (A; n=9–11) and coronary (B; n=6–13) arterioles from groups 24 hr post-exposure to CeO2 NPs. Values are means ± SE. † p ≤ 0.05 vs. control.
Figure 7.

SPR-induced vasodilation was impaired in mesenteric (A; n=6–12) and coronary (B; n=6–8) arterioles from groups 24 hr post-exposure to CeO2 NPs. Values are means ± SE. † p ≤ 0.05 vs. control; * p ≤ 0.05 vs. 10 μg CeO2 NPs; ‡ p ≤ 0.05 vs. 50 μg CeO2 NPs; ^ p ≤ 0.05 vs. 100 μg CeO2 NPs. The right panel represents the responses of the various doses of CeO2 NPs and was analyzed by nonlinear regression. The left panel highlights the point-to-point differences between the control and CeO2 NP exposed group.
Vasoconstriction
Arteriolar vasoconstriction was assessed initially by exposing the vessel to the α-adrenergic receptor agonist, PE. There were no significant differences in the response to increases in PE regardless of CeO2 NP concentration or microvascular bed (Figure 8A and B). Since PE is a poor vasoconstrictor in the coronary vasculature, a more equitable vasoconstrictor was also used. Serotonin caused a constriction in both microvascular beds (Figure 9A and B). There were no significant differences in mesenteric arterioles, but there was an augmented response in coronary arterioles after pulmonary exposure to 400 μg CeO2 NPs (Figure 9A and B). These data provide evidence that adrenergic and 5-HT sensitivity are intact after exposure to CeO2 NPs.
Figure 8.

PE-induced vasoconstriction was not significantly impaired in mesenteric (A; n=5–13) and coronary (B; n=6–9) arterioles from groups 24 hr post-exposure to CeO2 NPs. Values are means ± SE. The right panel represents the responses of the various doses of CeO2 NPs and was analyzed by nonlinear regression. The left panel highlights the point-to-point differences between the control and CeO2 NP exposed group.
Figure 9.

5-HT-induced vasoconstriction was not significantly impaired in mesenteric (A; n=6–10) arterioles. An attenuated response was observed only in coronary (B; n=6–8) arterioles from groups 24 hr post-exposure to 400 μg CeO2 NPs. Values are means SE. ‡ p ≤ 0.05 vs. 50 μg CeO2 NPs; ^ p ≤ 0.05 vs. 100 μgCeO2 NPs. The right panel represents the responses of the various doses ofCeO2 NPs and was analyzed by nonlinear regression. The left panel highlights the point-to-point differences between the control and CeO2 NP exposed group.
CeO2 Nanoparticle EC50
The calculated EC50 was determined for each agonist and ranged from 15 to 101 μg of CeO2 NPs (Table III). The EC50 was dependent not only on the chemical agonist, but also the microvascular bed. The differential EC50 may be attributed to the different metabolic demands of the tissue beds investigated and/or direct or indirect exposure toCeO2 NPs.
Table III.
CeO2 Nanoparticles EC50
| Chemical | Coronary | Mesentery |
|---|---|---|
| ACh | 100.60 μg | 61.95 μg |
| A23187 | 64.24 μg | 88.51 μg |
| SPR | 69.50 μg | 69.08 μg |
| PE | 15.00 μg | 49.82 μg |
| 5-HT | 23.34 μg | 18.48 μg |
Values are the calculated EC50 for each dose curve.
Myogenic Responsiveness
Independent of microvascular bed or CeO2 NP exposure, the arterioles responded similarly to changes in transmural pressure (Figure 10A and B). These data provide evidence that the arteriolar myogenic responsiveness is intact after CeO2 NP instillation.
Figure 10.

Myogenic responsiveness was not impaired in mesenteric (A; n=10–15) and coronary (B; n=6–9) arterioles from groups 24 hr post-exposure to CeO2 NPs. Values are means ± SE. The right panel represents the responses of the various doses of CeO2 NPs and was analyzed by nonlinear regression. The left panel highlights the point-to-point differences between the control and CeO2 NP exposed group.
Discussion
This study is the first to investigate the influence of pulmonary CeO2 NP exposure on microvascular function. The major finding of this paper is: microvascular dysfunction follows pulmonary CeO2 NP exposure, characterized by impaired endothelium-dependent and -independent dilation.
One of the primary objectives of this investigation was to determine the microvascular function following CeO2 NP exposure at occupationally relevant doses. To accomplish this, rats were exposed by IT instillation to CeO2 NP doses which ranged up to 400 μg per rat. In order to evaluate the relevance of the doses used in this in vivo rat study to humans, we need to determine if the CeO2 NP doses tested in rats are relevant to human exposures. With a rat alveolar epithelium surface area of 0.4 m2 (35), the 400 μg CeO2 NP lung burden would result in 1 mg CeO2/m2 alveolar epithelium. For a 5 μg/m3 aerosol of CeO2 NPs with a mass median aerodynamic diameter (MMAD)=1.5 μm, minute ventilation of 20 L/minute for a person performing light work (36), a deposition fraction of 30% (37) and human alveolar epithelium surface area of 102 m2 (35), the 400 μg CeO2 NP lung burden in rat approximates deposition for a person performing light work for 30 years (assuming 240 work days per year). Currently, no exposure limits for CeO2 have been set by OSHA, and thus the Permissible Exposure Limit (PEL) for CeO2 is that for Particulates Not Otherwise Regulated (PNOR), which is 5 mg/m3 for the respirable fraction. Thus, the highest rat CeO2 NP dose in this study approximates a human working for 30 years at an exposure level 1,000-fold below the current OSHA PEL for CeO2. The current study focused on identifying the microvascular effects in young healthy male rats, representative of a similar human population; however, we speculate that human populations with increased susceptibility to cardiovascular disease (i.e. age, smoking, diagnosed cardiovascular risk factors), the observed microvascular dysfunction may appear more severe or appear at lower lung burdens than those in this study.
BAL analysis revealed the presence of pulmonary inflammation following CeO2 NP exposure in a dose dependent manner. The change in inflammatory status after pulmonary CeO2 NP exposure was similar to previously reported studies that found an increase in LDH, AM activation and PMN infiltration 24 hr after exposure, however, an increase in albumin in the BAL fluid after CeO2 NP exposure has been reported (16). In our study, the lack of an increase in albumin in the BAL fluid indicates that the lung epithelial-endothelial barrier is intact, and a similar lack of albumin was observed with low doses of TiO2 and residual oil fly ash (ROFA) (25). These differences in the inflammatory profile may be due to changes in the valence state of CeO2 NPs; however, alterations in the Ce3+/Ce4+ concentration is difficult to monitor in a biologic system, due to the ability of CeO2 NPs to readily switch between these two valences (11). Because CeO2 NPs exist in two states, and each state appears to influence different biological outcomes, the role of Ce3+/Ce4+ warrants further investigation, but is currently outside the scope of this study (11;12).
The results of this study have shown the presence of microvascular dysfunction following CeO2 NP exposure even in the absence of overt pulmonary inflammation (Figure 3). Previous studies have also shown microvascular dysfunction despite relatively minor inflammation following exposure to ROFA and fine TiO2 (38). This suggests that pulmonary inflammation is not a pre-requisite for systemic dysfunction; however, because at high doses of particles pulmonary and systemic effects are present, it is important to assess the inflammatory state of the lungs. Additionally, it is reasonable to speculate that pulmonary inflammation is not significantly influencing systemic microvascular function at low doses of CeO2 NPs (10 μg) but does, at least in part, influence microvascular function at higher doses of CeO2 NPs (100 and 400 μg).
The sizes of the agglomerates are relevant to occupational and environmental exposures. Studies with particulate matter and diesel exhaust particles have shown that agglomerates between 100 and 1000 nm deposit in the lungs, however only particles 250 nm or less preferentially deposit in the respiratory zone of the lungs (15;39). Therefore, the agglomerates in this study are capable of reaching the respiratory zone of the lungs.
Normal microvascular function was assessed by endothelium-dependent dilation and -independent dilation, VSM constriction, and myogenic responsiveness. VSM constriction and myogenic responsiveness appear to be intact in both microvascular beds regardless of the dose of CeO2 NPs used and is consistent with previously reported nanomaterials (27;40;41). This may be due to overlapping VSM signaling cascades in response to these stimuli. In regards to normal arteriolar dilation, our results provide evidence that there is a significantly impaired response to endothelium-dependent dilators, ACh and A23187. This response was consistent with microvascular impairments that were observed 24 hr after pulmonary exposure to multi-walled carbon nanotubes, ultrafine TiO2, and PM (27;40;41). However, exposure to CeO2 NPs also produced an unique endothelium-independent impairment in coronary and mesenteric arterioles.
Endothelium-independent dysfunction following particle exposure was first observed in pulmonary arteries following PM exposure by Courtois et al. (42), and this finding is now extended to the systemic microcirculation after CeO2 NP exposure. The results in this study provide evidence that arteriolar VSM NO sensitivity is altered after CeO2 NP exposure. Because PM and ENM are fundamentally different the likelihood of disparate mechanisms is high. This warrants further investigation to the mechanism(s) of CeO2 NP exposure, which may potentially be linked to alterations in NO bioavailability, signaling and/or sensing.
The observed microvascular dysfunction could be due to either impaired NO production, a shift in arachindonic acid metabolites, impaired VSM or a combination of the three. The use of A23187 specifically examined endothelium NO production, however, VSM impairments to NO may interfere with these results. Therefore, at this time we cannot definitely determine the role of NO production and shifts in arachindonic acid metabolites in the observed microvascular dysfunction. Future experiments, through the use of inhibitors and denuted arterioles, are necessary to definitely determine the influence of these factors. In this study, we can infer that the endothelium is at least partially functional because after stimulation with the Ca2+ iontophore A23187 there is an impaired dilation. Without this limited endothelial function the A23187 would act primarily on the VSM, resulting in a net constriction. Typically, NO is released from the endothelial cells as a byproduct of L-arginine conversion to L-citrulline. The NO then defuses to adjacent smooth muscle where it interacts with soluble guanylyl cyclase and activates a signaling cascade that ultimately sequesters Ca2+ and causes smooth muscle relaxation. A disruption at any point in this pathway may result in a blunted dilation. One such disruption could be an increase of hemoglobin α in the endothelial cell, In this study the level of hemoglobin α is inversely proportional to NO bioavailability (43). In this case, if hemoglobin α concentration is increased, endothelium derived NO could be bound to hemoglobin α; thus reducing NO bioavailiblity which could contribute to an impaired dilation. Alternatively, when hemoglobin α binds NO the iron valence state changes, which is interestingly similar to the valence state changes of CeO2 NPs (43). If CeO2 nanoparticles translocate, it is reasonable to speculate that CeO2 nanoparticles may also bind available NO thus decreasing NO bioavailability It remains to be determined if this is the case for CeO2 NP exposures.
A previous study attributed the VSM dysfunction following PM exposure to changes in the inflammatory state of the animals, independent of changes in oxidative stress; whereas others have attributed impaired microvascular dysfunction to changes in oxidative stress (40;42). The relationship between CeO2 NPs and changes in oxidative stress warrants further investigation. Due to the changes in valence state, CeO2 NPs has the ability to react with free radicals like superoxide, thus decreasing the level of oxidative stress (12). Others have indicated that the level of free radicals increases after exposure (44). Therefore, local oxidative stress must be assessed in the vascular wall to determine its influence after exposure and if these changes affect reactivity.
In this study, it is important to note that there are distinct differences in microvascular function and sensitivity between mesenteric and coronary arterioles. This illustrates the importance of selecting the most appropriate microvascular bed for a given research question because the findings from one microvascular bed may not be implicitly extrapolated to another bed. These functional changes may arise from inherent differences between the two microvascular bed such as time blood supply is received (systolic vs. diastolic), metabolic demand (low vs. high), and response to changes in blood flow (varying vs. constant). Each microvascular bed studied in this manuscript is of equal importance but may be influenced by differing mechanisms. Additionally, modest changes in the coronary microvasculature can result dire consequences for the heart due to local ischemia; however, this same local ischemia maybe associated with less deleterious effects in the mesentery where the microcirculation is accustom to changing blood flow and oxygen levels.
Alterations in microvascular function can have serious health consequences. Notable common pathologies such as hypertension and diabetes initiate at the microvascular level as a result of endothelial dysfunction (18). Of the many ENM we have studied, CeO2 NPs are the first ENM we have observed to cause a significant increase in MAP (Table I). This change in MAP may be a consequence of the observed alterations in smooth muscle sensitivity to NO. MAP may also be influenced by changes in total peripheral resistance and/or changes in cardiac output. The current ex vivo experimental plan cannot accurately assess cardiac output, total peripheral resistance or their interdependency. Thus in vivo experiments that address these potential outcomes must to be performed in the future. Alternatively, this change in MAP at the 100 μg dose may also be a consequence of changes in autonomic control as a result of CeO2 NP exposure. Evidence of this potential change may be represented by the lack of an increase in MAP at higher doses. In order assess changes in MAP future studies should use chronic arterial pressure monitoring to determine the influence of dose, time, and mechanistic interactions.
The microvascular dysfunction observed at the 10 μg exposure may also be due to direct exposure and/or changes in autonomic control. It has been reported that dependent on the time after pulmonary exposure, 20 to 50% of the ENM can be cleared from the lungs (45;46). These cleared nanomaterials have several potential fates. The ENM may transition into the systemic blood stream directly from the lung or they may be cleared via the mucociliary escalator (45;46). In animals, ENM cleared from the lungs are ingested and can be either absorbed into the blood, excreted in feces, or remain in the gut wall (45;46). The clearance of CeO2 NPs from the lungs is significant because it may account for the differences in the calculated EC50 for the vascular beds. The mesenteric arterioles may be exposed both directly and indirectly to the effects of CeO2, NPs whereas the coronary arterioles are only indirectly exposed to CeO2 NPs. Additionally, the clearance of CeO2 NPs is significant because calculated lung exposure would be less than reported; however, it should also be noted that the actual deposition in the lungs of CeO2 NPs post-24 hr was not calculated in this investigation.
In conclusion, this study provides evidence that pulmonary CeO2 NP exposure causes alterations in MAP, in addition to endothelium-dependent and -independent arteriolar impairment. The mechanism underlying this dysfunction warrants further investigation due to the many potential uses of this ENM that may benefit human health. Additionally, alternate exposure routes must be investigated to determine if this response is unique to the lung exposures.
Table IIB.
Coronary Arteriole Characteristics
| Groups | n | Diameter (μm) | Tone (%) | WT (μm) | WLR | |
|---|---|---|---|---|---|---|
| Steady State | Max | |||||
| Control-Saline | 21 | 83 ± 5 | 119 ± 6 | 31 ± 2 | 21 ± 1 | 0.18 ± 0.01 |
| 10 μg CeO2 NPs | 8 | 67 ± 4 | 100 ± 6 | 32 ± 3 | 16 ± 2 | 0.16 ± 0.02 |
| 50 μg CeO2 NPs | 10 | 78 ± 6 | 116 ± 5 | 33 ± 4 | 17 ± 1 | 0.15 ± 0.01 |
| 100 μg CeO2 NPs | 22 | 78 ± 4 | 111 ± 5 | 30 ± 2 | 21 ± 2 | 0.20 ± 0.02 |
| 200 μg CeO2 NPs | 10 | 82 ± 6 | 114 ± 7 | 29 ± 1 | 15 ± 1 | 0.13 ± 0.01 |
| 400 μg CeO2 NPs | 10 | 77 ± 6 | 115 ± 7 | 33 ± 3 | 17 ± 2 | 0.15 ± 0.02 |
Values are means ± SE. n=number of vessels. WT= Wall Thickness WLR= Wall to Lumen Ratio
Acknowledgments
The authors would like to thank Carroll McBride and Kimberly Wix for their expert technical assistance in this study. The authors would also like to thank Katarzyna Sabolsky for assistance with the TEM characterization of the CeO2 nanoparticles. This work is supported by the National Institutes of Health RO1-ES015022, RC1-ES018274 (TRN), F32-ES023435 (PAS) and the National Science Foundation Cooperative Agreement- 1003907 (TRN and VCM).
Footnotes
Disclaimer: The findings and conclusions in this report are those of the authors and do not necessarily represent the views of the National Institute for Occupational Safety and Health
Reference List
- 1.Borm PJ, Robbins D, Haubold S, Kuhlbusch T, Fissan H, Donaldson K, Schins R, Stone V, Kreyling W, Lademann J, Krutmann J, Warheit D, Oberdorster E. The potential risks of nanomaterials: a review carried out for ECETOC. Part Fibre Toxicol. 2006;3:11. doi: 10.1186/1743-8977-3-11. [DOI] [PMC free article] [PubMed] [Google Scholar]
- 2.Hanson N, Harris J, Joseph LA, Ramakrishnan K, Thompson T. EPA Needs to Manage Nanomaterial Risks More Effectively. 2011. Report No.: 12-P-0162. [Google Scholar]
- 3.Borm PJ, Muller-Schulte D. Nanoparticles in drug delivery and environmental exposure: same size, same risks? Nanomedicine (Lond) 2006;1(2):235–49. doi: 10.2217/17435889.1.2.235. [DOI] [PubMed] [Google Scholar]
- 4.Aitken RJ, Chaudhry MQ, Boxall AB, Hull M. Manufacture and use of nanomaterials: current status in the UK and global trends. Occup Med (Lond) 2006;56(5):300–6. doi: 10.1093/occmed/kql051. [DOI] [PubMed] [Google Scholar]
- 5.Cassee FR, van Balen EC, Singh C, Green D, Muijser H, Weinstein J, Dreher K. Exposure, health and ecological effects review of engineered nanoscale cerium and cerium oxide associated with its use as a fuel additive. Crit Rev Toxicol. 2011;41(3):213–29. doi: 10.3109/10408444.2010.529105. [DOI] [PubMed] [Google Scholar]
- 6.Cassee FR, Campbell A, Boere AJ, McLean SG, Duffin R, Krystek P, Gosens I, Miller MR. The biological effects of subacute inhalation of diesel exhaust following addition of cerium oxide nanoparticles in atherosclerosis-prone mice. Environ Res. 2012;115:1–10. doi: 10.1016/j.envres.2012.03.004. [DOI] [PMC free article] [PubMed] [Google Scholar]
- 7.Preisler EJ, Marsh OJ, Beach RA, McGill TC. Stability of cerium oxide on silicon studied by x-ray photoelectron spectroscopy. Journal of Vacuum Science and Technology B. 2001;19(4):1611–8. [Google Scholar]
- 8.Geraets L, Oomen AG, Schroeter JD, Coleman VA, Cassee FR. Tissue distribution of inhaled micro- and nano-sized cerium oxide particles in rats: results from a 28-day exposure study. Toxicol Sci. 2012;127(2):463–73. doi: 10.1093/toxsci/kfs113. [DOI] [PubMed] [Google Scholar]
- 9.Yokel RA, Au TC, Macphail R, Hardas SS, Butterfield DA, Sultana R, Goodman M, Tseng MT, Dan M, Haghnazar H, Unrine JM, Graham UM, Wu P, Grulke EA. Distribution, Elimination, and Biopersistence to 90 Days of a Systemically Introduced 30 nm Ceria-Engineered Nanomaterial in Rats. Toxicol Sci. 2012;127(1):256–68. doi: 10.1093/toxsci/kfs067. [DOI] [PubMed] [Google Scholar]
- 10.Pairon JC, Roos F, Sebastien P, Chamak B, bd-Alsamad I, Bernaudin JF, Bignon J, Brochard P. Biopersistence of cerium in the human respiratory tract and ultrastructural findings. Am J Ind Med. 1995;27(3):349–58. doi: 10.1002/ajim.4700270304. [DOI] [PubMed] [Google Scholar]
- 11.Celardo I, Traversa E, Ghibelli L. Cerium oxide nanoparticles: a promise for applications in therapy. J Exp Ther Oncol. 2011;9(1):47–51. [PubMed] [Google Scholar]
- 12.Heckert EG, Karakoti AS, Seal S, Self WT. The role of cerium redox state in the SOD mimetic activity of nanoceria. Biomaterials. 2008;29(18):2705–9. doi: 10.1016/j.biomaterials.2008.03.014. [DOI] [PMC free article] [PubMed] [Google Scholar]
- 13.Colon J, Herrera L, Smith J, Patil S, Komanski C, Kupelian P, Seal S, Jenkins DW, Baker CH. Protection from radiation-induced pneumonitis using cerium oxide nanoparticles. Nanomedicine. 2009;5(2):225–31. doi: 10.1016/j.nano.2008.10.003. [DOI] [PubMed] [Google Scholar]
- 14.Kim CK, Kim T, Choi IY, Soh M, Kim D, Kim YJ, Jang H, Yang HS, Kim JY, Park HK, Park SP, Park S, Yu T, Yoon BW, Lee SH, Hyeon T. Ceria nanoparticles that can protect against ischemic stroke. Angew Chem Int Ed Engl. 2012;51(44):11039–43. doi: 10.1002/anie.201203780. [DOI] [PubMed] [Google Scholar]
- 15.Stapleton PA, Minarchick VC, McCawley M, Knuckles TL, Nurkiewicz TR. Xenobiotic Particle Exposure and Microvascular Endpoints: A Call to Arms. Microcirculation. 2011 doi: 10.1111/j.1549-8719.2011.00137.x. [DOI] [PMC free article] [PubMed] [Google Scholar]
- 16.Ma JY, Zhao H, Mercer RR, Barger M, Rao M, Meighan T, Schwegler-Berry D, Castranova V, Ma JK. Cerium oxide nanoparticle-induced pulmonary inflammation and alveolar macrophage functional change in rats. Nanotoxicology. 2011;5(3):312–25. doi: 10.3109/17435390.2010.519835. [DOI] [PubMed] [Google Scholar]
- 17.Toya T, Takata A, Otaki N, Takaya M, Serita F, Yoshida K, Kohyama N. Pulmonary toxicity induced by intratracheal instillation of coarse and fine particles of cerium dioxide in male rats. Ind Health. 2010;48(1):3–11. doi: 10.2486/indhealth.48.3. [DOI] [PubMed] [Google Scholar]
- 18.Schwartzkopff B, Mundhenke M, Strauer BE. Alterations of the architecture of subendocardial arterioles in patients with hypertrophic cardiomyopathy and impaired coronary vasodilator reserve: a possible cause for myocardial ischemia. J Am Coll Cardiol. 1998;31(5):1089–96. doi: 10.1016/s0735-1097(98)00036-9. [DOI] [PubMed] [Google Scholar]
- 19.Prewitt RL, Rice DC, Dobrian AD. Adaptation of resistance arteries to increases in pressure. Microcirculation. 2002;9(4):295–304. doi: 10.1038/sj.mn.7800143. [DOI] [PubMed] [Google Scholar]
- 20.Zweifach BW. In: Pressure-flow relations in blood and lymph microcirculation, in Handbook of Physiology. Renkin EM, Michel CC, editors. American Physiological Society; Bethesda, MD: 1984. pp. 251–308. [Google Scholar]
- 21.Renkin EM. Control of microcirculation and blood-tissue exchange. In: Renkin EM, Michel CC, editors. Handbook of Physiology. American Physiology Society; Bethesda, MD: 1984. pp. 627–87. [Google Scholar]
- 22.Wingard CJ, Walters DM, Cathey BL, Hilderbrand SC, Katwa P, Lin S, Ke PC, Podila R, Rao A, Lust RM, Brown JM. Mast cells contribute to altered vascular reactivity and ischemia-reperfusion injury following cerium oxide nanoparticle instillation. Nanotoxicology. 2011;5(4):531–45. doi: 10.3109/17435390.2010.530004. [DOI] [PMC free article] [PubMed] [Google Scholar]
- 23.Nalabotu SK, Kolli MB, Triest WE, Ma JY, Manne ND, Katta A, Addagarla HS, Rice KM, Blough ER. Intratracheal instillation of cerium oxide nanoparticles induces hepatic toxicity in male Sprague-Dawley rats. Int J Nanomedicine. 2011;6:2327–35. doi: 10.2147/IJN.S25119. [DOI] [PMC free article] [PubMed] [Google Scholar]
- 24.LeBlanc AJ, Cumpston JL, Chen BT, Frazer D, Castranova V, Nurkiewicz TR. Nanoparticle inhalation impairs endothelium-dependent vasodilation in subepicardial arterioles. J Toxicol Environ Health A. 2009;72(24):1576–84. doi: 10.1080/15287390903232467. [DOI] [PMC free article] [PubMed] [Google Scholar]
- 25.Nurkiewicz TR, Porter DW, Barger M, Millecchia L, Rao KM, Marvar PJ, Hubbs AF, Castranova V, Boegehold MA. Systemic microvascular dysfunction and inflammation after pulmonary particulate matter exposure. Environ Health Perspect. 2006;114(3):412–9. doi: 10.1289/ehp.8413. [DOI] [PMC free article] [PubMed] [Google Scholar]
- 26.Tok AIY, Du SW, Boey FYC, Chong WK. Hydrothermal sysnthesis and characterization of rare earth doped ceria nanoparticles. Mater Sci Eng. 2013;(466):223–9. [Google Scholar]
- 27.Nurkiewicz TR, Porter DW, Barger M, Castranova V, Boegehold MA. Particulate matter exposure impairs systemic microvascular endothelium-dependent dilation. Environ Health Perspect. 2004;112(13):1299–306. doi: 10.1289/ehp.7001. [DOI] [PMC free article] [PubMed] [Google Scholar]
- 28.Porter DW, Barger M, Robinson VA, Leonard SS, Landsittel D, Castranova V. Comparison of low doses of aged and freshly fractured silica on pulmonary inflammation and damage in the rat. Toxicology. 2002;175(1–3):63–71. doi: 10.1016/s0300-483x(02)00061-6. [DOI] [PubMed] [Google Scholar]
- 29.Sun D, Messina EJ, Kaley G, Koller A. Characteristics and origin of myogenic response in isolated mesenteric arterioles. Am J Physiol. 1992;263(5 Pt 2):H1486–H1491. doi: 10.1152/ajpheart.1992.263.5.H1486. [DOI] [PubMed] [Google Scholar]
- 30.Chilian WM, Eastham CL, Marcus ML. Microvascular distribution of coronary vascular resistance in beating left ventricle. Am J Physiol. 1986;251(4 Pt 2):H779–H788. doi: 10.1152/ajpheart.1986.251.4.H779. [DOI] [PubMed] [Google Scholar]
- 31.Kotani A, Jo T, Parlebas JC. Many-body effects in core-level spectroscopy of rare-earth compounds. Adv Phys. 2013;37:8952–61. [Google Scholar]
- 32.Burroughs P, Hamnett A, Orchard AF, Thomton G. Satellite structure in the X-ray photoelectron spectra of some binary and mixed oxides of lanthanum and cerium. J Chem Soc Dalton Trans. 2013;17:1686–98. [Google Scholar]
- 33.Kumar S, Butcher KSA, Tansley TL. X-ray photoelectron spectroscopy characterization of radio frequency reactively sputtered carbon nitride thin films. J Vac Sci Technol A. 2013;14(5):2687–92. [Google Scholar]
- 34.Grossi L, D’Angelo S. Sodium nitroprusside: mechanism of NO release mediated by sulfhydryl-containing molecules. J Med Chem. 2005;48(7):2622–6. doi: 10.1021/jm049857n. [DOI] [PubMed] [Google Scholar]
- 35.Stone KC, Mercer RR, Gehr P, Stockstill B, Crapo JD. Allometric relationships of cell numbers and size in the mammalian lung. Am J Respir Cell Mol Biol. 1992;6(2):235–43. doi: 10.1165/ajrcmb/6.2.235. [DOI] [PubMed] [Google Scholar]
- 36.Galer DM, Leung HW, Sussman RG, Trzos RJ. Scientific and practical considerations for the development of occupational exposure limits (OELs) for chemical substances. Regul Toxicol Pharmacol. 1992;15(3):291–306. doi: 10.1016/0273-2300(92)90040-g. [DOI] [PubMed] [Google Scholar]
- 37.Phalen RF. Inhalation Studies: Foundattions and Techniques. CRC Press; Boca Raton: 1984. Basic Morphology and Physiology of the Respiratory Tract. [Google Scholar]
- 38.Nurkiewicz TR, Porter DW, Hubbs AF, Stone S, Moseley AM, Cumpston JL, Goodwill AG, Frisbee SJ, Perrotta PL, Brock RW, Frisbee JC, Boegehold MA, Frazer DG, Chen BT, Castranova V. Pulmonary particulate matter and systemic microvascular dysfunction. Res Rep Health Eff Inst. 2011;(164):3–48. [PubMed] [Google Scholar]
- 39.Menache MG, Miller FJ, Raabe OG. Particle inhalability curves for humans and small laboratory animals. Ann Occup Hyg. 1995;39(3):317–28. [PubMed] [Google Scholar]
- 40.LeBlanc AJ, Moseley AM, Chen BT, Frazer D, Castranova V, Nurkiewicz TR. Nanoparticle inhalation impairs coronary microvascular reactivity via a local reactive oxygen species-dependent mechanism. Cardiovasc Toxicol. 2010;10(1):27–36. doi: 10.1007/s12012-009-9060-4. [DOI] [PMC free article] [PubMed] [Google Scholar]
- 41.Stapleton PA, Minarchick VC, Cumpston AM, McKinney W, Chen BT, Sager TM, Frazer DG, Mercer RR, Scabilloni J, Andrew ME, Castranova V, Nurkiewicz TR. Impairment of coronary arteriolar endothelium-dependent dilation after multi-walled carbon nanotube inhalation: a time-course study. Int J Mol Sci. 2012;13(11):13781–803. doi: 10.3390/ijms131113781. [DOI] [PMC free article] [PubMed] [Google Scholar]
- 42.Courtois A, Andujar P, Ladeiro Y, Baudrimont I, Delannoy E, Leblais V, Begueret H, Galland MA, Brochard P, Marano F, Marthan R, Muller B. Impairment of NO-dependent relaxation in intralobar pulmonary arteries: comparison of urban particulate matter and manufactured nanoparticles. Environ Health Perspect. 2008;116(10):1294–9. doi: 10.1289/ehp.11021. [DOI] [PMC free article] [PubMed] [Google Scholar]
- 43.Straub AC, Lohman AW, Billaud M, Johnstone SR, Dwyer ST, Lee MY, Bortz PS, Best AK, Columbus L, Gaston B, Isakson BE. Endothelial cell expression of haemoglobin alpha regulates nitric oxide signalling. Nature. 2012;491(7424):473–7. doi: 10.1038/nature11626. [DOI] [PMC free article] [PubMed] [Google Scholar]
- 44.Park EJ, Choi J, Park YK, Park K. Oxidative stress induced by cerium oxide nanoparticles in cultured BEAS-2B cells. Toxicology. 2008;245(1–2):90–100. doi: 10.1016/j.tox.2007.12.022. [DOI] [PubMed] [Google Scholar]
- 45.Driscoll KE, Costa DL, Hatch G, Henderson R, Oberdorster G, Salem H, Schlesinger RB. Intratracheal instillation as an exposure technique for the evaluation of respiratory tract toxicity: uses and limitations. Toxicol Sci. 2000;55(1):24–35. doi: 10.1093/toxsci/55.1.24. [DOI] [PubMed] [Google Scholar]
- 46.He X, Zhang H, Ma Y, Bai W, Zhang Z, Lu K, Ding Y, Zhao Y, Chai Z. Lung deposition and extrapulmonary translocation of nano-ceria after intratracheal instillation. Nanotechnology. 2010;21(28):285103. doi: 10.1088/0957-4484/21/28/285103. [DOI] [PubMed] [Google Scholar]