Abstract
Zinc sulfide-coated copper indium sulfur selenide (CuInSexS2-x/ZnS core/shell) nanocrystals were synthesized with size-tunable red to near infrared (NIR) fluorescence with high quantum yield (40%) in water. These nanocrystals were tested as an imaging agent to track a microparticle-based oral vaccine administered to mice. Poly(lactic-co-glycolic acid) (PLGA) microparticle-encapsulated CuInSexSe2-x/ZnS quantum dots were orally administered to mice and were found to provide a distinct visible fluorescent marker in the gastrointestinal tract of living mice.
Keywords: Quantum dots, CuInSe2, CuInS2, near infrared, in vivo imaging, bioimaging, photoluminescence
Semiconductor nanocrystal quantum dots can exhibit bright and stable fluorescence with color that can be tuned over a wide wavelength range by changing size and composition, making them suitable as fluorescent bioimaging probes.1–4 For biological imaging, nanocrystals with near infrared (NIR) optical signal are of particular interest because there is a spectral window through tissue and water between 650 and 900 nm.5,6 Fluorescent quantum dots can also be photoexcited over a very wide range of wavelengths, enabling multispectral imaging.7, 8 In contrast, there are few bright molecular fluorophores with excitation or emission wavelengths in these ranges.9 One other advantage of fluorescent quantum dots over molecular dyes is that they can be photoexcited over a very wide range of wavelengths, which is important for multispectral imaging.7,8 Bioimaging using quantum dots has been demonstrated a number of times, typically administered using intravenous routes.10,11
Here, we report the synthesis of ZnS-coated copper indium sulfide-selenide (CuInSexS2-x) quantum dots with bright fluorescence with quantum yields in water of up to 40% and their use as fluorescent contrast agents for in vivo imaging of orally administered microparticles. Room-temperature photoluminescence (PL) is rarely observed from bulk CuInSexS2-x or other ternary I-III-VI compounds due to nonradiative recombination at defects,12 but quantum dots of several related materials have been made with bright room temperature PL, including Cu(InxGa1-x)Se213, CuInS2, CuInSe214, Cu2ZnSnS415 and I-III-VI ordered vacancy compound nanocrystals,16 and ZnS-coated CuInS2.17 The peak emission wavelength of the core/shell CuInSexS2-x/ZnS quantum dots could be tuned by size through a range of red/NIR wavelengths suitable for in vivo biological imaging. Furthermore, the CuInSexS2-x/ZnS quantum dots do not contain toxic elements (such as Cd, Pb, Hg, or As) like most other NIR-emitting nanocrystals, such as Pb chalcogenides,18,19 CdTe,20 InAs,21 and Cd3As2.22 In addition to bioimaging, these quantum dots could be attractive for optoelectronic applications such as solar cells and light-emitting diodes.23 As proof-of-principle in vivo imaging, CuInSexS2-x/ZnS quantum dots were used to track the movement of orally-administered poly(lactic-co-glycolic acid) (PLGA) microparticles in mice. The quantum dots were encapsulated in PLGA microparticles functionalized with the bacterial protein invasin to facilitate mucosal vaccine delivery. Using in vivo whole animal fluorescence imaging, the microparticles were observed to accumulate in deep tissue within the gastrointestinal tract of the mouse. This experiment demonstrates the feasibility of fluorescent nanocrystal quantum dots for in vivo imaging of orally administered particles.
CuInSexS2-x nanocrystals were synthesized by arrested precipitation in octadecene at 220°C with Cu(acac), In(acac)3 (2.5 g), tributylphosphine selenide (TBP:Se) and dodecanethiol as capping ligand and sulfur source. (See Supporting Information for details.) Tuan and coworkers recently synthesized CuInSexS2-nanocrystals in gram scale quantities using elemental Se and S as chalcogen sources,24 however those nanocrystals were too large (>10 nm) to be luminescent. We find that using a combination of dodecanethiol and tertiary phosphine selenides as chalcogen sources allows for slow growth necessary to control the size in the 1 to 3 nm diameter range. It was, however, also not possible using this method to effectively make nanocrystals in the larger size range (>3 nm diameter). McDaniel, et al.25 used a similar synthesis approach to CuInSexS2-x quantum dots for use in solar cells, but did not show the ability to control the nanocrystal size.
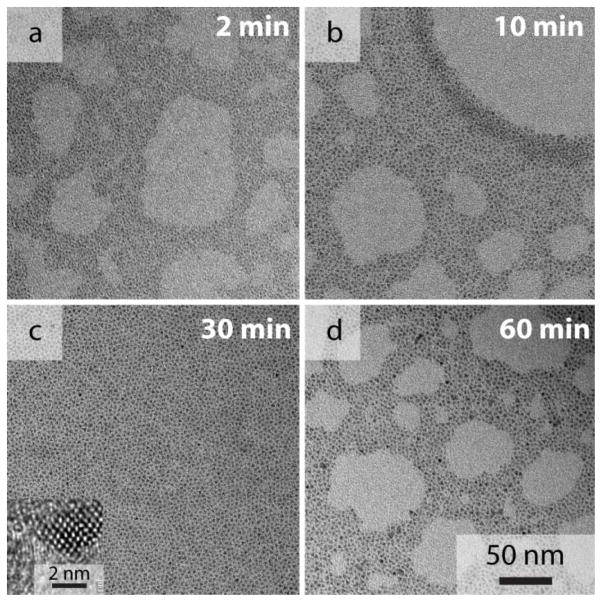
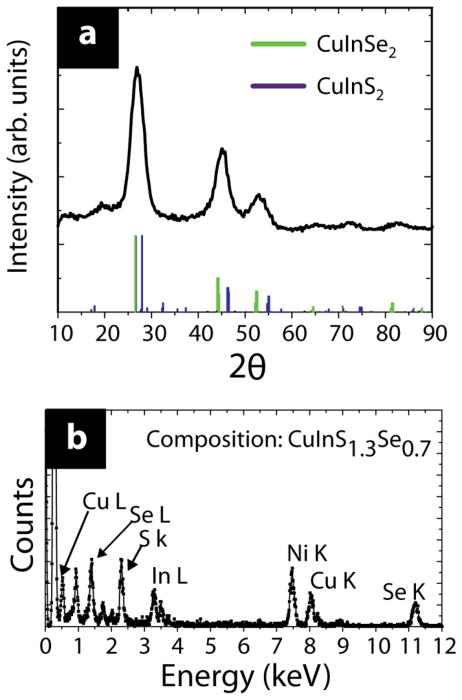
Figure 1 shows TEM images of CuInSexS2-nanocrystals isolated at different times during the reaction. The nanocrystals become progressively larger, increasing from 1.1 nm after 2 min to 3.1 nm in diameter after 60 min. Longer reaction times did not lead to significantly larger nanocrystals. Figure 2 shows X-ray diffraction (XRD) of the nanocrystals made with 750 nm peak emission wavelength. XRD (Figure 2) is consistent with sphalerite or chalcopyrite CuInSexS2-and no other phases are present in the reaction product. Chalcopyrite (tetragonal) CuInSe2 (CuInS2) should exhibit diffraction peaks at ~17(18)° and ~35(37)° corresponding to the (101) and (211) lattice planes. The sphalerite (111) peak (chalcopyrite (112) peak) lies at 2Θ=27.1° (d=3.29 Å), in between the (112) peak positions for chalcopyrite copper indium selenide and copper indium sulfide (JCPDS #97-006-892, 082-1702), indicating that the nanocrystals are an S-Se alloy. The lattice spacing measured in the high resolution TEM image in Figure 1C is 3.25 Å, consistent with (112) lattice planes of chalcopyrite CuInSexS2. A core/shell structure, or gradient in S-Se composition within the nanocrystals cannot be ruled out, however, given that the diffraction peaks are relatively broad. Using Vegard’s law to estimate the composition based on the lattice spacing determined from the (112) XRD peak, the S:Se composition is 1.1:0.9. The Cu:In:S:Se composition determined by EDS was 1.0:1.0:1.3:0.7. EDS provides an overestimate of the S composition in the nanocrystal core due to the presence of the thiol capping ligands in the sample. The S:Se composition of nanocrystals made at longer reaction times measured by EDS did not vary significantly with reaction time. Nanocrystals synthesized at lower temperatures, at 200°C and less, were richer in Se, indicating that dodecanethiol is less reactive as a sulfur source than TBP:Se as a Se source at lower temperatures. Nanocrystals synthesized at these lower temperatures also exhibited substantially lower PL quantum yields. At reaction temperatures higher than 240°C, it was not possible to maintain narrow size distributions and obtain sizes in the range needed for quantum confinement and luminescence. The reaction product would begin to precipitate within within a few minutes of injecting the reactants.
Figure 1.
TEM of CuInSexS2-nanocrystals isolated at different times after reactant injection: (a) 2 min (1.1±0.3 nm), (b) 10 min (2.4±0.5), (c) 30 min (2.9±0.5), and (d) 1 hr (3.1±0.3). Inset in (c): High resolution TEM image of a CuInSexS2-nanocrystal.
Figure 2.
(A) XRD and (B) EDS of CuInSexS2-x nanocrystals with emission at 750 nm (2.9 nm diameter). Reference patterns are provided in (A) for CuInSe2 (green, JCPDS #97-006-892) and CuInS2 (purple, JCPDS #082-1702).
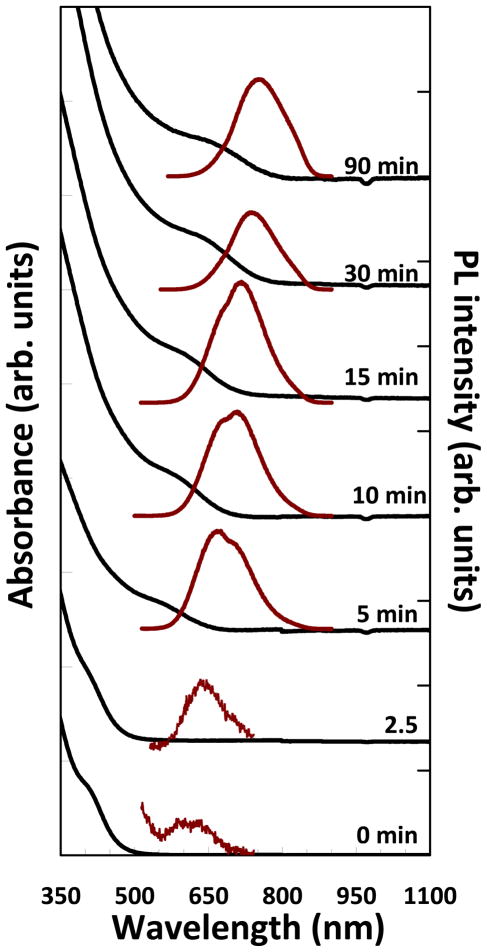
Figure 3 shows absorbance and PL spectra of the CuInSexS2-x nanocrystals. Nanocrystals isolated immediately after TBP:Se injection (0 min) exhibited an absorbance shoulder at approximately 380 nm and weak PL at 610 nm (QY < 0.01%). As the reaction proceeds and the CuInSexS2-nanocrystals grow, the absorbance shoulder and PL shift to longer wavelength, consistent with quantum confinement. Bulk CuInSexS2-with the same composition calculated from the CuInSexS2 composition determined by EDS has band gap of about 1.2 eV (1030 nm). Between 5 and 15 min, the PL spectra appear to have a slightly bimodal emission, similar to what has previously been observed in CuInS2 quantum dots and attributed to defect-related emission.17, 26 Overcoating with ZnS resulted in a significant increase of PL quantum yield to 40% and a slight redshift in the peak position of ~20 nm (Supporting Information, S1). The ZnS overcoated nanocrystals retained their bright fluorescence for several months even when stored in air.
Figure 3.
Room temperature absorbance (black) and PL (λexc=400 nm) (red) spectra of uncoated CuInSexS2-nanocrystals isolated at various times after reactant injection. The nanocrystals were dispersed in toluene.
CuInSexS2-/ZnS quantum dots were integrated into a microparticle-based oral vaccine system. Previous work has shown that the Y. pseudotuberculosis–derived protein invasin targets intestinal M cells by binding the α5β1 integrin with high specificity and affinity. M cells are present in the gastrointestinal tract, occurring at a frequency of ~1 in 107 enterocytes.27 They represent the first line of intestinal immune responses, sampling material present in the gut lumen and delivering it to underlying lymphocytes. These cells in turn mediate mucosal immune responses, for instance, to combat bacterial or viral pathogens.25, 26 Since access to lymphocytes is a major limitation in oral delivery of subunit vaccines, targeting M cells has emerged as a general strategy for oral vaccine delivery. 30–34 Wild-type invasion binds the α5β1 integrin with high affinity, but a single amino acid substitution, replacement of an aspartic acid residue at position 911 with an alanine (D911A), completely abrogates binding.35 Both variants are readily expressed and purified in high yield from a heterologous E. coli expression system comprised of the extracellular D1–D5 invasin domains fused downstream of the soluble carrier protein, maltose binding protein (MBP), hereafter referred to as invasin. The fluorescent CuInSexS2-/ZnS quantum dots were used to monitor transport of an invasin-functionalized vaccine delivery system in living mice.
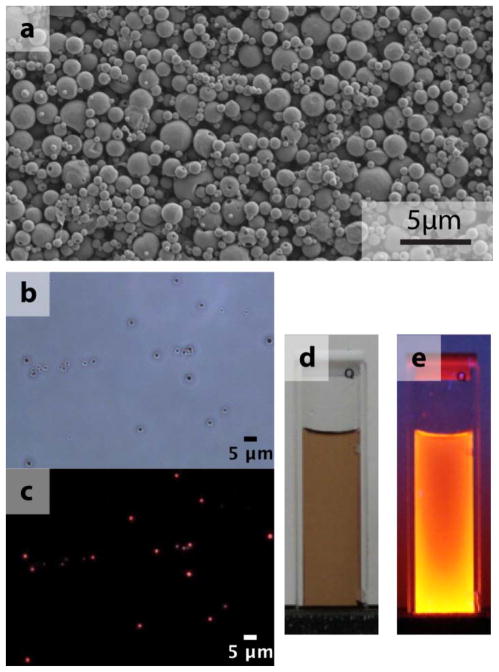
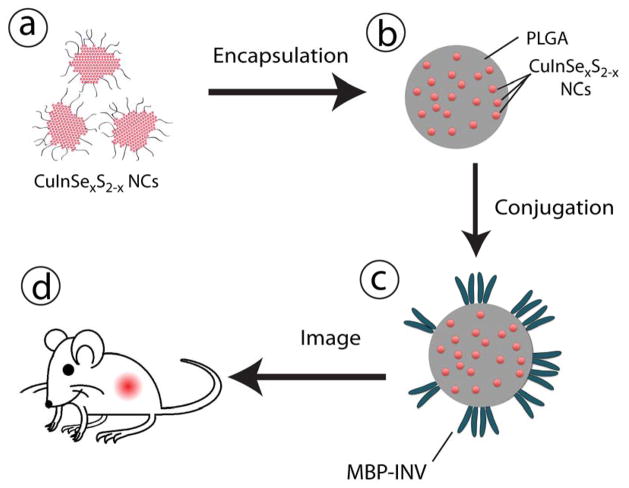
Fluorescent CuInSexS2-nanocrystals were encapsulated in poly (lactic-co-glycolic) acid microparticles formed by a microemulsion method (see Supporting information for experimental details). Figure 4 shows a SEM and fluorescence microscopy images of the micropoarticles containing CuInSexS2-nanocrystals. The microparticles are fluorescent and somewhat polydisperse, ranging in diameter from 500 nm to 2 μm. Figure 4e shows a photograph of a microparticle dispersion illuminated by a UV lamp. To assess in vivo microparticle transport and localization, they were decorated with either wild-type or the non-binding D911A invasin variant via EDC-NHS conjugation. A schematic illustrating the experimental process is shown in Figure 5.
Figure 4.
(a) SEM image of a collection of InvaCuInSexS2-x particles, (b) an optical microscope image in bright field and (c) a corresponding fluorescence image (excitation 480 – 550 nm, emission >590 nm). (d) Photographs show the CuInSexS2-nanocrystals dispersed in toluene in room light and (e) under UV exposure.
Figure 5.
Illustration of the experimental procedure. (a) CuInSexS2-/ZnS quantum dots (NCs) dispersed in dichloromethane (DCM) are (b) encapsulated in PLGA microspheres, prior to (c) conjugation with wild-type invasin or non-binding variant D911A. (d) After intragastric gavage, in vivo fluorescence is monitored.
The mice were placed on an alfalfa free diet to reduce intestinal autofluorescence and fasted for three hours prior to dosing to reduce mouse-to-mouse variability. Invasin functionalized PLGA microparticles (15 mg) encapsulating the CuInSexS2-nanocrystals (InvaCuInSexS2-x) were orally gavaged to mice (three per group) and imaged, using a non-invasive Caliper Life Sciences IVIS Spectrum In Vivo Imaging System, to track the time-dependent fluorescence retention in the gastrointestinal tract. The mice were then anesthetized by isoflurane inhalation and imaged, while maintaining anesthesia. Images were collected at 15 min, 18 hr, and at the terminal time point, two days after dosage. This study was performed with approval by the Institutional Animal Care and Use Committee at the University of Texas at Austin (protocol #AUP-2009-00086) in compliance with guidelines from the Office of Laboratory Animal Welfare. Figure 6 shows whole-animal fluorescence images of mice fed InvaCuInSexS2-x.
Figure 6.
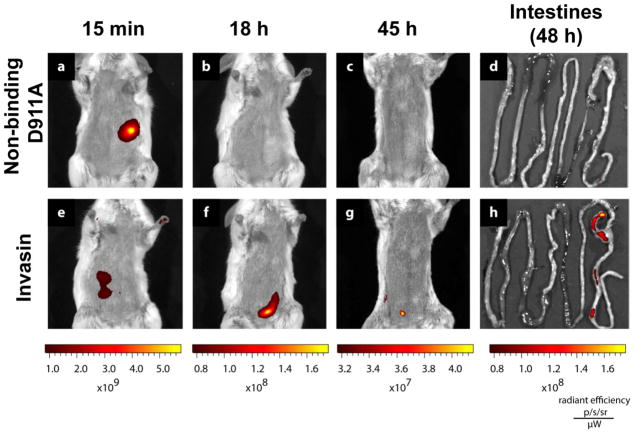
Representative in-vivo fluorescence images tracking the same subjects at 15 min (a,e), 18 h (b,f), 45h (c,g) after oral gavage and the intestines after dissection at 48h (d,h). Mice (n= 3) were administered 15 mg InvaCuInSexS2-x microparticles conjugated with (e-h) wild type invasin or (a-d) the non-binding D911A variant.
Quantum dot fluorescence was clearly visible in the whole-animal images and identified the location of the microparticles in vivo. At 15 minutes, any material orally gavaged would be primarily found in the stomach, as the exponential decay constant of stomach emptying in the mouse is 72 min.36 The fluorescence signal in figures 6(a) and (e) is located where the stomach should be located. At 18 and 45 hours, the majority of ingested material that is not mucoadhesive or transported across the intestinal wall is expected to be excreted. Figure 6(h) shows the fluorescence signal is restricted to the cecum and the colon. In mice, M cells are found along the gastrointestinal tract in Peyer’s patches in the distal small intestine, isolated lymphoid follicles, cecal patches, and colonic patches.37, 38 The bulk of the invasin-conjugated particles appear to be retained in this region. Quantitative analysis was performed by integrating the fluorescence intensity over a region of interest encompassing the entire abdomen using multiple filter sets (Figure 7). For images with weaker signals (18h, 45h, intestines), the images were spectrally unmixed using Living Image 4.0 to distinguish tissue autofluorescence from nanocrystal fluorescence (supporting information for details). Comparisons between samples groups show a slight trend in increased intestinal retention at 48 h for the wild-type invasin group. Factors such as protease degradation of invasion during gastrointestinal tract transit may reduce the differences between these groups.
Figure 7.
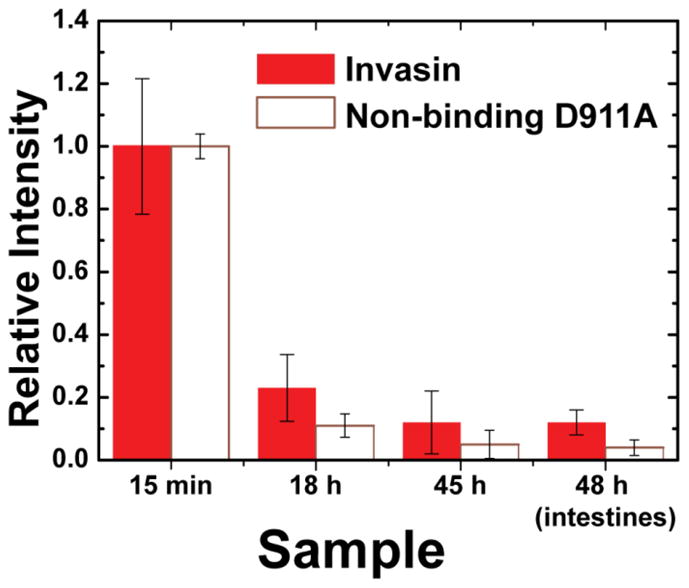
Comparison of fluorescence signal from the nanocrystals at 15 min, 18 h, 45 h in vivo, and the intestines at 48 hours post-mortem. Error bars correspond to the standard deviation of measurements of individual mice for each sample group (wild-type n=3 and non-binding D911A n=2).
Conclusions
Colloidal ZnS-coated CuInSexS2-x quantum dots with size-dependent, bright PL were synthesized. The ZnS shell increased the PL quantum yield of the CuInSexS2-nanocrystals from around 10% to 40% and stabilized the PL in aqueous media. These nanocrystals are attractive for medical imaging since they emit red/NIR light and do not contain toxic heavy metals. As a proof-of-principle, CuInSexS2-nanocrystals were loaded into invasion-functionalized PLGA microparticles and were observed in deep tissue within the gastrointestinal tract by in vivo whole animal fluorescence imaging. The CuInSexS2-nanocrystals are promising new biocompatible diagnostic agents.
Supplementary Material
Acknowledgments
Funding was provided by the Robert A. Welch Foundation (grant no. F-1464 to BAK and F-1767 to JAM), the Gates Foundation Grand Challenges (to JAM) and the National Institutes of Health (Grant No. R01 CA132032 to BAK). We thank Ralph Isberg (Tufts University) for the pRI203 plasmid, and Krishnendu Roy and Keith Johnston (UT Austin) for use of their facilities to make the PLGA particles.
Footnotes
Experimental details, analysis of in vivo fluorescence imaging data, and photoluminescence spectra. This material is available free of charge via the Internet at http://pubs.acs.org.
References
- 1.Michalet X, Pinaud FF, Bentolila LA, Tsay JM, Doose S, Li JJ, Sundaresan G, Wu AM, Gambhir SS, Weiss S. Science. 2005;307:538–544. doi: 10.1126/science.1104274. [DOI] [PMC free article] [PubMed] [Google Scholar]
- 2.Medintz IL, Uyeda HT, Goldman ER, Mattoussi H. Nature Mater. 2005;4:435–446. doi: 10.1038/nmat1390. [DOI] [PubMed] [Google Scholar]
- 3.Hessel CM, Rasch MR, Hueso JL, Goodfellow BW, Akhavan VA, Puvanakrishnan P, Tunnel JW, Korgel BA. Small. 2010;6:2026–2034. doi: 10.1002/smll.201000825. [DOI] [PMC free article] [PubMed] [Google Scholar]
- 4.Kairdolf BA, Smith AM, Stokes TD, Wang MD, Young AN, Nie S. Ann Rev Anal Chem. 2013;6 doi: 10.1146/annurev-anchem-060908-155136. [DOI] [PMC free article] [PubMed] [Google Scholar]
- 5.Farokhzad OC, Langer R. Adv Drug Delivery Rev. 2006;58:1456–1459. doi: 10.1016/j.addr.2006.09.011. [DOI] [PubMed] [Google Scholar]
- 6.Madelung O. Semiconductors other than Group IV Elements and III-V Compounds. New York: 1992. [Google Scholar]
- 7.Resch-Genger U, Grabolle M, Cavaliere-Jaricot S, Nitschke R, Nann T. Nature Methods. 2008;5:763–775. doi: 10.1038/nmeth.1248. [DOI] [PubMed] [Google Scholar]
- 8.Fountaine TJ, Wincovitch SM, Geho DH, Garfield SH, Pittaluga S. Mod Pathol. 2006;19:1181–1191. doi: 10.1038/modpathol.3800628. [DOI] [PubMed] [Google Scholar]
- 9.Frangioni JV. Curr Op Chem Bio. 2003;7:626–634. doi: 10.1016/j.cbpa.2003.08.007. [DOI] [PubMed] [Google Scholar]
- 10.Ballou B, Lagerholm BC, Ernst LA, Bruchez MP, Waggoner AS. Bioconjugate chemistry. 2003;15(1):79–86. doi: 10.1021/bc034153y. [DOI] [PubMed] [Google Scholar]
- 11.Pons T, Pic E, Lequeux N, Cassette E, Bezdetnaya L, Guillemin F, Marchal F, Dubertret B. ACS Nano. 2010;4(5):2531–2538. doi: 10.1021/nn901421v. [DOI] [PubMed] [Google Scholar]
- 12.Chichibu S. Appl Phys Lett. 1997;70:1840–1842. [Google Scholar]
- 13.Panthani MG, Akhavan V, Goodfellow B, Schmidtke JP, Dunn L, Dodabalapur A, Barbara PF, Korgel BA. J Am Chem Soc. 2008;130:16770–16777. doi: 10.1021/ja805845q. [DOI] [PubMed] [Google Scholar]
- 14.Zhong H, Wang Z, Bovero E, Lu Z, van Veggel FCJM, Scholes GD. J Phys Chem C. 2011;115:12396–12402. [Google Scholar]
- 15.Steinhagen C, Panthani MG, Akhavan V, Goodfellow B, Koo B, Korgel BA. J Am Chem Soc. 2009;131:12554–12555. doi: 10.1021/ja905922j. [DOI] [PubMed] [Google Scholar]
- 16.Allen PM, Bawendi MG. J Am Chem Soc. 2008;130:9240–9241. doi: 10.1021/ja8036349. [DOI] [PMC free article] [PubMed] [Google Scholar]
- 17.Li L, Daou TJ, Texier I, Kim Chi TT, Liem NQ, Reiss P. Chem Mater. 2009;21:2422–2429. [Google Scholar]
- 18.Harbold JM, Du H, Krauss TD, Cho KS, Murray CB, Wise FW. Phys Rev B. 2005;72:195312. [Google Scholar]
- 19.Murphy JE, Beard MC, Norman AG, Ahrenkiel SP, Johnson JC, Yu P, Micic OI, Ellingson RJ, Nozik AJ. J Am Chem Soc. 2006;128:3241–3247. doi: 10.1021/ja0574973. [DOI] [PubMed] [Google Scholar]
- 20.Peng ZA, Peng X. J Am Chem Soc. 2000;123:183–184. doi: 10.1021/ja003633m. [DOI] [PubMed] [Google Scholar]
- 21.Guzelian AA, Banin U, Kadavanich AV, Peng X, Alivisatos AP. Appl Phys Lett. 1996;69:1432–1434. [Google Scholar]
- 22.Harris DK, Allen PM, Han HS, Walker BJ, Lee J, Bawendi MG. J Am Chem Soc. 2011;133:4676–9. doi: 10.1021/ja1101932. [DOI] [PubMed] [Google Scholar]
- 23.Panthani MG, Korgel BA. Ann Rev Chem Biomol Eng. 2012;3:287–311. doi: 10.1146/annurev-chembioeng-062011-081040. [DOI] [PubMed] [Google Scholar]
- 24.Chiang MY, Chang SH, Chen CY, Yuan FW, Tuan HY. J Phys Chem C. 2011;115:1592–1599. [Google Scholar]
- 25.McDaniel H, Fuke N, Pietryga JM, Klimov VI. J Phys Chem Lett. 2013;4:355–361. doi: 10.1021/jz302067r. [DOI] [PubMed] [Google Scholar]
- 26.Zhong H, Zhou Y, Ye M, He Y, Ye J, He C, Yang C, Li Y. Chem Mater. 2008;20:6434–6443. [Google Scholar]
- 27.Tyrer PC, Ruth Foxwell A, Kyd JM, Otczyk DC, Cripps AW. Vaccine. 2007;25:3204–3209. doi: 10.1016/j.vaccine.2007.01.028. [DOI] [PubMed] [Google Scholar]
- 28.Clark MA, Hirst BH, Jepson MA. Infect Immun. 1998;66:1237–1243. doi: 10.1128/iai.66.3.1237-1243.1998. [DOI] [PMC free article] [PubMed] [Google Scholar]
- 29.Hussain N, Florence AT. Pharmaceutical Res. 1998;15:153–156. doi: 10.1023/a:1011981610840. [DOI] [PubMed] [Google Scholar]
- 30.Palumbo RN, Wang C. Curr Drug Delivery. 2006;3:47–53. doi: 10.2174/156720106775197475. [DOI] [PubMed] [Google Scholar]
- 31.Shukla A, Katare OP, Singh B, Vyas SP. Int J Pharmaceutics. 2010;385:47–52. doi: 10.1016/j.ijpharm.2009.10.027. [DOI] [PubMed] [Google Scholar]
- 32.Nochi T, Yuki Y, Matsumura A, Mejima M, Terahara K, Kim DY, Fukuyama S, Iwatsuki-Horimoto K, Kawaoka Y, Kohda T, Kozaki S, Igarashi O, Kiyono H. J Exp Med. 2007;204:2789–2796. doi: 10.1084/jem.20070607. [DOI] [PMC free article] [PubMed] [Google Scholar]
- 33.KuoLee R, Chen W. Exp Op Drug Delivery. 2008;5:693–702. doi: 10.1517/17425247.5.6.693. [DOI] [PubMed] [Google Scholar]
- 34.Fievez V, Plapied L, des Rieux A, Pourcelle V, Freichels H, Wascotte V, Vanderhaeghen M-L, Jerôme C, Vanderplasschen A, Marchand-Brynaert J, Schneider Y-J, Préat V. Eur J Pharmaceutics and Biopharmaceutics. 2009;73:16–24. doi: 10.1016/j.ejpb.2009.04.009. [DOI] [PubMed] [Google Scholar]
- 35.Leong JM, Morrissey PE, Marra A, Isberg RR. EMBO J. 1995;14:422–431. doi: 10.1002/j.1460-2075.1995.tb07018.x. [DOI] [PMC free article] [PubMed] [Google Scholar]
- 36.Schwarz R, Kaspar A, Seelig J, Kunnecke B. Magnetic Resonance in Medicine. 2002;48:255–261. doi: 10.1002/mrm.10207. [DOI] [PubMed] [Google Scholar]
- 37.Hase K, Kawano K, Nochi T, Pontes GS, Fukuda S, Ebisawa M, Kadokura K, Tobe T, Fujimura Y, Kawano S, Yabashi A, Waguri S, Nakato G, Kimura S, Murakami T, Iimura M, Hamura K, Fukuoka SI, Lowe AW, Itoh K, Kiyono H, Ohno H. Nature. 2009;462:226–U101. doi: 10.1038/nature08529. [DOI] [PubMed] [Google Scholar]
- 38.McConnell EL, Basit AW, Murdan S. J Pharmacy and Pharmacology. 2008;60:63–70. doi: 10.1211/jpp.60.1.0008. [DOI] [PubMed] [Google Scholar]
Associated Data
This section collects any data citations, data availability statements, or supplementary materials included in this article.


