

Abstract
In this study, we determined the genotype distribution of two single nucleotide polymorphisms (SNPs) in secreted frizzled related protein 1 (SFRP1), rs3242 and rs921142, in a Caucasian bladder cancer case-control study. Allelic variants of the SNPs were determined using restriction fragment length polymorphism (RFLP) analysis and partly verified by sequencing analysis. Overall, DNA from 188 consecutive and 215 early-onset bladder cancer patients (≤45 years) as well as from 332 controls was investigated. Potential microRNA binding sites were determined for rs3242, and microRNA expression was analysed in cell lines and tumour specimens. We observed a remarkable distribution difference in rs3242 between bladder cancer patients and healthy controls (p=0.05). Additionally, we found a significant difference in genotype distribution (p=0.032), resulting from the difference of early-onset patients and the control group (p=0.007). The risk allele T showed increased frequency in the early-onset patient group (p=0.002). Genotype-dependent differences of microRNA binding capacity were predicted in SFRP1 mRNA for two microRNAs. Hsa-miR-3646 showed strong expression in cell lines and tumour tissue, whereas hsa-miR-603 exhibited weak expression. The rs921142 SNP showed no significant association with bladder cancer risk. This is the first study to describe an association of the SFRP1 SNP rs3242 and bladder cancer risk as well as the influence of rs3242 on genotype-dependent microRNA capacity on SFRP1 mRNA. The onset of bladder seems to be associated with the increased occurrence of the T-allele in rs3242.
Keywords: SFRP1, SNP, bladder cancer, microRNA, Wnt signalling pathway
Introduction
The canonical Wnt-signalling pathway appears to be one of the most relevant cellular pathways involved in normal cell growth and differentiation, but also in the development of many malignancies. The main signal transducing molecule in Wnt-signalling is beta-Catenin (CTNNB1), mediating the cellular signal from the cell surface to the nucleus to activate or inhibit transcription of downstream target genes like CCND1 (Cyclin D1), CMYC, AXIN2, BMP4, BIRC5 (Survivin), CD44 and others [1]. After Wnt pathway activation, the Wnt ligands (WNTs) bind to the transmembranous receptor Frizzled (FZD) which leads to inactivation of the CTNNB1 destruction complex consisting of APC-AXIN-GSK38 and subsequently to the stabilisation of CTNNB1 and its translocation to the nucleus. In the absence of WNTs or the presence of WNT inhibitors, like Dickkopf (DKK), Wnt-inhibitory factor 1 (WIF-1) or secreted frizzled related protein 1 (SFRP1), CTNNB1 is recruited into the destruction-complex, where it is phosphorylated and ubiquitinated. This leads to the degradation of CTNNB1 in the proteasome and the decreased translocation into the nucleus [1].
Aberrant Wnt-signalling is known to be associated with various diseases, like osteoarthritis, pulmonary fibrosis, schizophrenia and cancer, e.g. colorectal and hepatocellular carcinoma [2-5].
Aberrant regulation of the inhibitory Wnt-signalling regulator SFRP1, especially loss of expression caused by epigenetic silencing, is a well-known phenomenon in several types of cancer, including colon, breast, kidney and hepatocellular cancer [6-10]. Expression of SFRP1 is frequently down-regulated in human urothelial carcinoma of the bladder via promoter hypermethylation, and we previously showed that SFRP1 could be a progression marker in papillary bladder cancer [11-13]. However, to date there are no studies investigating the SFRP1 gene for SNPs and their potential impact on cancer development, progression and prognosis. According to the NCBI SNP database dbSNP, (http://www.ncbi.nlm.nih.gov/snp) there are 1054 SNPs known in human SFRP1 up to date (state 13/08/2013), of whom only two are cited in PubMed. Although the search for inherited cancer susceptibility markers is a major focus in cancer research, there are no data available about SNPs in SFRP1 and cancer risk. To our knowledge, only three study groups analysed the association between SNPs in SFRP1 and disease risk in humans, however focusing on bone mineral density (BMD), bone mineral content (BMC) and inflammatory disease of the airways. Sims et al reported a significant association between bone density and four SNPs in SFRP1: rs921142, rs4736965, rs10106678 and rs7832749 [14]. According to their work, rs921142 is located in the 3’UTR of SFRP1 and has an A/G variant with A being the ancestral allele. In 2009, Ohnaka et al found that two single nucleotide polymorphisms in SFRP1 (rs3242 and rs16890444) are associated with the lumbar spine BMD value [15]. The SNP rs3242 is also located in the 3’UTR region of SFRP1 on chromosome 8p and is a C/T sequence variant with C being the ancestral allele. In rs3242 the non-ancestral allele was associated with low BMD. Regarding asthma no correlation was found [16]. As the two SNPs rs3242 and rs921142 were significantly associated with bone mineral density and bone mineral content, an association with disease could be presumed.
Based on these data and the localisation in potential regulatory regions of the gene, we analysed the distribution of rs3242 and rs921142 SNPs in SFRP1 in 403 bladder cancer patients and 332 healthy controls to investigate a correlation between specific allele variants and cancer risk.
Material and methods
Patient samples
Overall, 403 Caucasian bladder cancer patients, consisting of 188 consecutive bladder cancer patients and 215 patients with early-onset bladder cancer (≤45 years), were included in our study. For rs3242 all DNA samples could be analysed; however, due to limited DNA availability, for rs921142 only 184 of the consecutive bladder cancer patient cohort and 106 early-onset patients were investigated. Peripheral blood or formalin-fixed and paraffin-embedded non-tumour tissue samples from these patients were used for DNA isolation. For comparison, 332 DNA samples from a Caucasian control group of patients without any malignancy were investigated (328 in rs921142 SNP).
All tumours were diagnosed according to the 1973 WHO classification of tumours of the urinary system [17] and staged according to the TNM system [18]. Clinicopathological characteristics of the study participants are summarised in Table 1. Written informed consent for participation in the study was obtained from participants of the consecutive bladder cancer cohort and the control group. IRB approval therefor was obtained from the ethics committee of the medical faculty of the Friedrich-Alexander University of Erlangen. The early-onset bladder cancer group consisted of anonymised samples retrospectively collected from the archive. The usage of this cohort was approved by the local ethics committee of the University of Regensburg.
Table 1.
Characteristics of study participants for single nucleotide polymorphism analysis of rs3242 and rs921142
| rs3242 | Consecutive Study | Early Onset (≤45) | All cases | Controls | ||
|
| ||||||
| Number: | n=188 | n=215 | n=403 | n=332 | ||
| Age: | Median: 69 | Range: 27-88 | Median: 41 | Range: 17-45 | Median: 69 | Range: 24-94 |
| Mean: 67.06 | (±12.55) | Mean: 38.61 | (±5.74) | Mean: 67.65 | (±10.75) | |
| Stage: | pTa | n=84 | pTa | n=102 | ||
| pT1 | n=37 | pT1 | n=33 | |||
| pT2-pT4 | n=28 | pT2-pT4 | n=44 | |||
| Others (incl. CIS + pTx) | n=39 | Others (incl. CIS + pTx) | n=15 | |||
| N.a. | n=0 | N.a. | n=21 | |||
| Grade: | G1 | n=42 | G1 | n=64 | ||
| G2 | n=69 | G2 | n=68 | |||
| G3 | n=66 | G3 | n=59 | |||
| N.a. | n=11 | N.a. | n=24 | |||
|
| ||||||
| rs921142 | Consecutive Study | Early Onset (≤45) | All cases | Controls | ||
|
| ||||||
| Number: | n=184 | n=106 | n=290 | n=328 | ||
| Age: | Median: 70 | Range: 27-88 | Median: 41 | Range: 17-45 | Median: 69 | Range: 24-94 |
| Mean: 67.2 (±12.9) | Mean: 38.2 (±6.6) | Mean: 67.6 | (±10.8) | |||
| Stage: | ||||||
| pTa | n=82 | pTa | n=47 | |||
| pT1 | n=35 | pT1 | n=11 | |||
| pT2-pT4 | n=29 | pT2-pT4 | n=22 | |||
| Others (incl. CIS + pTx) | n=38 | Others (incl. CIS + pTx) | n=11 | |||
| N.a. | n=0 | N.a. | n=15 | |||
| Grade: | G1 | n=41 | G1 | n=32 | ||
| G2 | n=65 | G2 | n=26 | |||
| G3 | n=67 | G3 | n=28 | |||
| N.a. | n=11 | N.a. | n=20 | |||
Abbreviations: CIS = carcinoma in situ, n.a. = not available.
Tissue microdissection and DNA isolation
DNA was extracted from manually microdissected normal bladder tissue or peripheral blood using the High Pure PCR Template Preparation Kit (Roche, Mannheim, Germany) according to manufacturer’s instructions.
SFRP1 rs3242 and rs921142 SNP analysis
SNP analysis was carried out by restriction fragment length polymorphism (RFLP) analysis of the polymorphic region in SFRP1. The polymorphic region of rs3242 contains an Rsa I recognition site (5’-GT▼AC-3’) in presence of the C-allele, resulting in digestion of the PCR product (137bp => 44bp + 93bp). PCR products containing the T-allele remained unaffected. In rs921142, the polymorphic region contains a Bmr I recognition site (5’-ACTGGG-3’) in presence of the G-allele, which resulted in digestion of the PCR product 7 basepairs downstream of the polymorphic region (5’-ACTGGGGGGGTGA-▼GTGGGG-3’, 218bp => 114bp + 104bp). PCR products containing the A-allele remained unaffected (218bp).
Amplification of genomic variants and RFLP analysis
SNP regions were amplified by PCR using primers (rs3242: sense: 5’-CCAGATGTTTTGATGTTATCG-3’; antisense: 5’-TCACAGCTCACAGTATCATTG-3’, rs921142: sense: 5’-TCAGGAGTGCACTGGATTTAG-3’; antisense: 5’-GAGATTTACTCCTGACTTGGG-3’) obtained from Metabion (Martinsried, Germany) in a total volume of 25 μl containing approximately 100 ng DNA, 0.2 mM dNTP (Promega, Mannheim, Germany), 0.18 μM primers and 0.0025 U/μl GoTaq (Promega, Mannheim, Germany). The thermal cycling conditions were as follows: initial denaturation for 3 min at 95°C, 35 cycles of denaturation at 95°C for 1 min, annealing at 57°C (rs3242) and 57.8°C (rs921142), respectively, for 1 min, elongation at 72°C for 1 min and final primer extension at 72°C for 10 min.
PCR products were incubated for four hours with 5 U Rsa I (New England Biolabs, Frankfurt/Main, Germany) at 37°C (rs3242) and ten hours with 5 U Bmr I (New England Biolabs, Frankfurt/Main, Germany) at 37°C (rs921142) in a total volume of 30 μl to ensure complete digestion. Restriction fragments were separated by electrophoresis using 2.5% agarose gels and visualized under ultraviolet light using 0.05% ethidium bromide. As positive controls, we used DNA from cell lines RT112 (C/C) for rs3242 SNP and BFTC905 (G/G) for rs921142 SNP.
Sequencing analysis
To verify the results ten randomly selected cases for rs3242 and 15 cases for rs921142 were sequenced. After amplification, PCR-products were purified using Dye Ex 2.0 TM Spin Kit (Qiagen, Hilden, Germany) according to manufacturer’s conditions. Sequence analysis was performed with primers mentioned above (3.2 μM) using Big Dye Terminator v1.1 Cycle Sequencing Kit (Applied Biosystems, Darmstadt, Germany) and ABI PRISM 310 Genetic Analyzer (Applied Biosystems, Darmstadt, Germany).
In silico microRNA analysis and mRNA structure prediction
To investigate the effect of allelic variants of the SNP rs3242 and correlating potential mRNA stability as well as microRNA binding capacity, resulting in potential repression of SFRP1 RNA expression, we used computational tools to determine potential microRNA binding sites and to calculate potential mRNA structure. To predict potential binding of microRNAs, dependent on the allelic variant of the rs3242 SNP, we entered parts of the mRNA sequence of SFRP1 (191bp sequence: GTGTTGTTTT TTTAACTGCA TTTTACCAGA TGTTTTGATG TTATCGCTTA TGTTAATAGT AATTCCCGTA Y GTGTTCATTT TATTTTCATG CTTTTTCAGC CATGTATCAA TATTCACTTG ACTAAAATCA CTCAATTAAT CAATGATACT GTGAGCTGTG ACTTTTTTTT CCCACTCAGT CATACACTTC, EMBL AADB02011349) into miRbase (www.mirbase.org) changing only one base at the rs3242 SNP location (Y=C or T).
To predict changes in mRNA secondary structure we used CONTRAfold free software from Stanford University (http://contra.stanford.edu/contrafold/).
Hsa-miR-603 and hsa-miR-3646 expression analysis
Patient material and cell lines
To analyse, if the in silico predicted microRNAs are expressed in bladder carcinomas and tissue, we investigated the expression of hsa-miR-603 and hsa-miR-3646 in human tumour specimens and in bladder cancer cell lines using qRT-PCR. To verify microRNA expression in human bladder tumours, seven new randomly selected fresh-frozen papillary urothelial carcinoma specimens (not part of the SNP cohort) were chosen from the tumour bank of the Institute of Pathology, Erlangen. This cohort consisted of one female and six male patients with mean age of 60 years (Range 46-67, Stage: 5xpTa, 2xpT1, Grade: 2xG1, 3xG2, 2xG3). Patient samples were obtained through the University Hospital Erlangen tumour bank after informed consent and institutional ethics committee approval at the Comprehensive Cancer Center Erlangen (CCC project number 14).
To verify microRNA expression in cell lines, four commercially available bladder cancer cell lines RT112, RT4, J82 and BFTC905 were used [19-22]. Additionally, one immortalised non-malignant cell line derived from normal human urothelium (UROtsa) and one primary urothelial cell line derived from a cystectomy-prostatectomy specimen were screened.
Isolation of total RNA
Pellets from cell lines or microdissected fresh-frozen tumour specimen were mixed with 1 ml Trizol Reagent (Invitrogen by life technologies, Karlsruhe, Germany) and RNA was isolated according to manufacturer’s protocol. RNA was redissolved in 150 μl water and DNase digestion was performed with RNase-free DNaseI (Roche, Mannheim, Germany). RNA quality was measured via spectrum analysis with Synergy 2 Multiplate Reader (BioTek Instruments GmbH, Bad Friedrichshall, Germany). RNA was stored at -80°C.
MicroRNA assay for hsa-miR-603 and hsa-miR-3646
For microRNA expression analysis the PerfeCta microRNA Assay (Quanta Biosciences, Gaithersburg, USA) was used. First, 1 μg RNA was polyadenylated and converted into cDNA using the qScript microRNA cDNA Synthesis Kit (Quanta Biosciences, Gaithersburg, USA) according to manufacturer’s conditions. This was followed by Real-Time SYBR Green qRT-PCR amplification of microRNAs (1 ng total RNA in 25 μl total reaction volume) using specific primers for hsa-miR-603 and hsa-miR-3646 (0.5 μl each, Quanta Biosciences, Gaithersburg, USA), 0.5 μl PerfeCta Universal PCR primer (Quanta Biosciences, Gaithersburg, USA) and 12.5 μl PerfeCta SYBR Green Super Mix (low ROX, Quanta Biosciences, Gaithersburg, USA) per well. RNU6B and SNORD44 were used as endogenous controls. MicroRNAs were amplified using 7500 Fast Real-Time PCR system (Applied Biosystems, Darmstadt, Germany) under the following thermocycling conditions (2-step cycling protocol): 2 min 95°C, (5 sec 95°C, 30 sec 60°C) x40, followed by melt curve analysis.
Statistical analysis
To test whether the genotype distribution followed Hardy-Weinberg equilibrium, the public software at http://ihg.gsf.de/cgi-bin/hw/hwa1.pl was used. Chi square test (two-sided exact) within the SPSS 16.0 software for Windows (SPSS, Chicago, IL, USA) was used to evaluate case-control differences in the distribution of genotypes and to analyse associations between genotypes and age or histopathological characteristics. To determine the distribution of the risk allele versus non-risk allele Fisher’s exact test (two-sided exact) was used. Gene expression was determined using ΔΔCT-method [23] with 7500 software v 5.0.2 from Applied Biosystems (Darmstadt, Germany). P-values <0.05 were interpreted as statistically significant.
Results
Distribution of SFRP1 SNPs rs3242 and rs921142
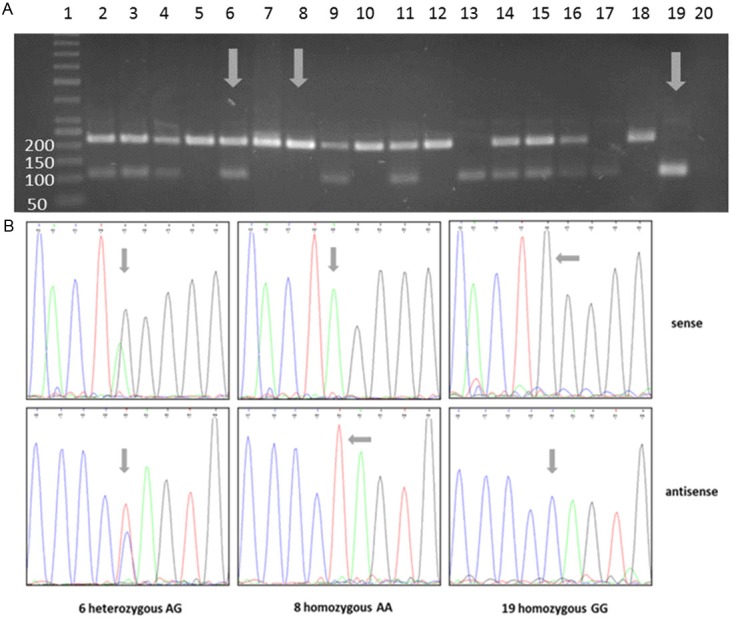
The verification of RFLP analysis by sequencing showed a complete concordance between both methods. Representative examples of genotyping are shown in Figures 1A (rs3242) and 2A (rs921142), representative sequencing results are shown in Figures 1B (rs3242) and 2B (rs921142).
Figure 1.

Genotyping analysis of rs3242: Representative examples of rs3242 genotype determination using RFLP (A) and sequencing analysis (B); RFLP and sequencing analysis showed concordant results. A: Depending on genotype the restriction enzyme RsaI cleaved the 137bp PCR product in two 44bp and 93bp fragments (homozygous C/C, two bands, e.g. lane 3) or left it unaffected (homozygous T/T, one band, e.g. lane 15); in case of heterozygous genotype C/T three DNA bands were observed (e.g. lane 1); Lanes 1-17: DNA from bladder cancer patients, lane 18: negative control (H2O), lane 19: size standard, lane 20: empty. Arrows indicate samples which were used for sequencing analyses. B: Verification of RFLP results was carried out using conventional Sanger sequencing analysis; in case of homozygous C/C genotype a blue C-peak (sense strand) or a black G-peak (antisense strand) was detected in chromatogram; homozygous T/T samples showed red T- (sense-strand) or green A-peak (antisense strand); heterozygous samples showed both peaks; arrows indicate the polymorphic nucleotide.
Figure 2.
Genotyping analysis of rs921142: Representative examples of rs921142 genotype determination using RFLP (A) and sequencing analysis (B); RFLP and sequencing analysis showed concordant results. A: Depending on genotype the restriction enzyme BmrI cleaved the 218bp PCR product in two 104bp and 114bp fragments (homozygous GG, e.g. lane 19) or left it unaffected (homozygous A/A, e.g. lane 8); in case of heterozygous genotype A/G three DNA fragments were present (e.g. lane 6), due to very similar fragment sizes, 104bp- and 114bp-fragments were visible as one band; Lane 1: size standard, lanes 2-19: DNA from bladder cancer patients, lane 20: negative control (H2O). Arrows indicate samples which were used for sequencing analysis. B: Verification of RFLP results via conventional Sanger sequencing analysis. In case of homozygous G/G genotype a black G-peak (sense strand) or a blue C-peak (antisense strand) was detected in chromatogram; homozygous A/A samples showed green A- (sense-strand) or red T-peak (antisense strand); heterozygous samples showed both peaks; arrows indicate the polymorphic nucleotide.
The genotype distribution in our cohorts followed the Hardy-Weinberg equilibrium in all bladder cancer cases (rs3242: p=0.30; rs921142: p=0.26) as well as in the individual groups (consecutive bladder cancer cases rs3242 p=1.00; rs921142 p=0.17; early-onset patients rs3242 p=0.21; rs921142 p=1.00) and controls (rs3242: p=0.12; rs921142: p=0.42). For rs3242, a trend for different genotype distribution between all cases and controls was found (p=0.05, Table 2, Figure 3A). Genotype distribution between the individual groups (controls versus consecutive bladder cancer cases versus early-onset cases) showed significant difference (p=0.032, Table 3, Figure 3A). This was mainly due to the significantly different genotype distribution between early-onset patients and controls (p=0.007, Table 2, Figure 3A), with an increased frequency of the risk allele T in the early-onset patient cohort (p=0.002, OR: 1.754 95% CI: 1.223-2.518, Figure 3B, Table 3). Considering all bladder cancer cases versus the healthy control group, we also determined the significant increase of the T-allele (p=0.028, OR: 1.399, 95% CI: 1.039-1.882, Table 2). No significant difference was detectable between the other groups. Also no significant association was found between allelic distribution of rs3242 and gender (p=0.211) or histopathological characteristics. Distribution of allelic variants and risk allele in the study cohorts are shown in Table 3.
Table 2.
Distribution of allelic variants of SFRP1 single nucleotide polymorphism rs3242 between study cohorts
| Genotype | Controls (%) | All Cases (%) | Comparison | ||
|
| |||||
| C/T | 138 (41.6) | 202 (50.1) | p=0.05 | ||
| C/C | 147 (44.3) | 145 (36.0) | |||
| T/T | 47 (14.1) | 56 (13.9) | |||
|
| |||||
| Genotype | Controls (Co) (%) | Consecutive Study (CS) (%) | Early Onset (EO) (%) | Comparison | |
|
| |||||
| C/T | 138 (41.6) | 87 (46.3) | 115 (53.5) | Co vs. CS vs. EO | Co vs. CS |
| *p=0.032 | p=0.559 | ||||
| C/C | 147 (44.3) | 78 (41.5) | 67 (31.2) | Co vs. EO | |
| *p=0.007 | |||||
| T/T | 47 (14.1) | 23 (12.2) | 33 (15.3) | CS vs. EO | |
| p=0.095 | |||||
Abbreviations: OR = odds ratio, CI = confidence interval, Co = control, CS = consecutive study cohort, EO = early-onset study cohort, vs. = versus.
significant p-values.
Figure 3.
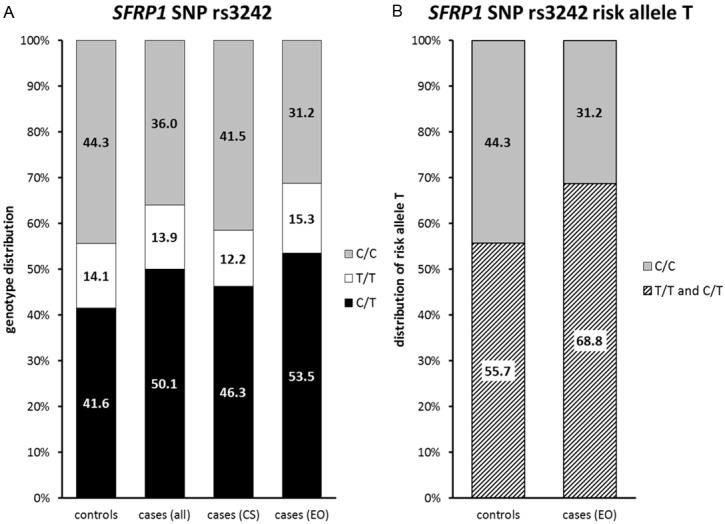
Distribution of rs3242 allele frequencies in study cohorts: Distribution of the SNP rs3242 genotypes C/C, T/T and C/T (A) and the risk allele T (B) within the study cohorts. A: A significant difference between controls and early-onset bladder cancer patients was found; in the control group the following genotype distribution was found: C/T 41.6%, T/T 14.1% and C/C 44.3%; in the early-onset bladder cancer group we found a reduced percentage of C/C (31.2%) and an increased number of heterozygous patients (53.5%); the number of T/T patients, however, almost remained stable (15.3%); in patients of the consecutive study distribution of the genotype proportions were very similar to the controls. B: When comparing only risk allele distribution, differences are more obvious: controls C/C 44.3%, T/T and C/T 55.7%; early-onset group C/C 31.2%, T/T and C/T 68.8%.
Table 3.
Distribution of risk allele in study cohorts of SFRP1 single nucleotide polymorphism rs3242
| Genotype | Controls (%) | All Cases (%) | Comparison | |||
| Risk T/T + C/T | 185 (55.7) | 257 (63.8) | *p=0.028 | OR: 1.399 | 95% CI: 1.039-1.882 | |
| C/C | 147 (44.3) | 145 (36.2) | ||||
|
| ||||||
| Genotype | Controls (Co) (%) | Consecutive Study (CS) (%) | Early Onset (EO) (%) | Comparison | ||
| Risk T/T + C/T | 185 (55.7) | 110 (58.5) | Co vs. CS | OR: 1.121 | 95% CI: 0.780-1.610 | |
| p=0.581 | ||||||
| C/C | 147 (44.3) | 78 (41.5) | ||||
|
| ||||||
| Genotype | Controls (Co) (%) | Consecutive Study (CS) (%) | Early Onset (EO) (%) | Comparison | ||
| Risk T/T + C/T | 185 (55.7) | 148 (68.8) | Co vs. EO | OR: 1.755 | 95% CI: 1.223-2.518 | |
| *p=0.002 | ||||||
| C/C | 147 (44.3) | 67 (31.2) | ||||
|
| ||||||
| Genotype | Controls (Co) (%) | Consecutive Study (CS) (%) | Early Onset (EO) (%) | Comparison | ||
| Risk T/T + C/T | 110 (58.5) | 148 (68.8) | CS vs. EO | OR: 1.566 | 95% CI: 1.040-2.359 | |
| *p=0.037 | ||||||
| C/C | 78 (41.5) | 67 (31.2) | ||||
Abbreviations: OR = odds ratio, CI = confidence interval, Co = control, CS = consecutive study cohort, EO = early-onset study cohort, vs. = versus.
significant p-values.
For rs921142 no significant association between genotype distribution in cases and controls and bladder cancer risk was found (Table 4, Figure 4). Also within all individual groups (controls versus consecutive study patients versus early-onset patients, p=0.432, Table 5) and regarding histopathological stage (p=0.317) no significant correlation was detected. However, the profound analysis of rs921142 revealed, that the SNP is not located within the 3’UTR of SFRP1, as described by Sims et al, but 5’upstream of SFRP1 (www.ensembl.org).
Table 4.
Distribution of allelic variants of SFRP1 single nucleotide polymorphism rs921142 between study cohorts
| Genotype | Controls (%) | All Cases (%) | Comparison | |
|
| ||||
| A/G | 165 (50.3) | 128 (44.1) | ||
| A/A | 116 (35.4) | 114 (39.3) | p=0.306 | |
| G/G | 47 (14.3) | 48 (16.6) | ||
|
| ||||
| Genotype | Controls (Co) (%) | Consecutive Study (CS) (%) | Early Onset (EO) (%) | Comparison |
|
| ||||
| A/G | 165 (50.3) | 79 (42.9) | 49 (46.2) | Co vs. CS vs. EO |
| p=0.432 | ||||
| A/A | 116 (35.4) | 71 (38.6) | 43 (40.6) | |
| G/G | 47 (14.3) | 34 (18.5) | 14 (13.2) | |
Abbreviations: Co = control, CS = consecutive study cohort, EO = early-onset study cohort, vs. = versus.
Figure 4.
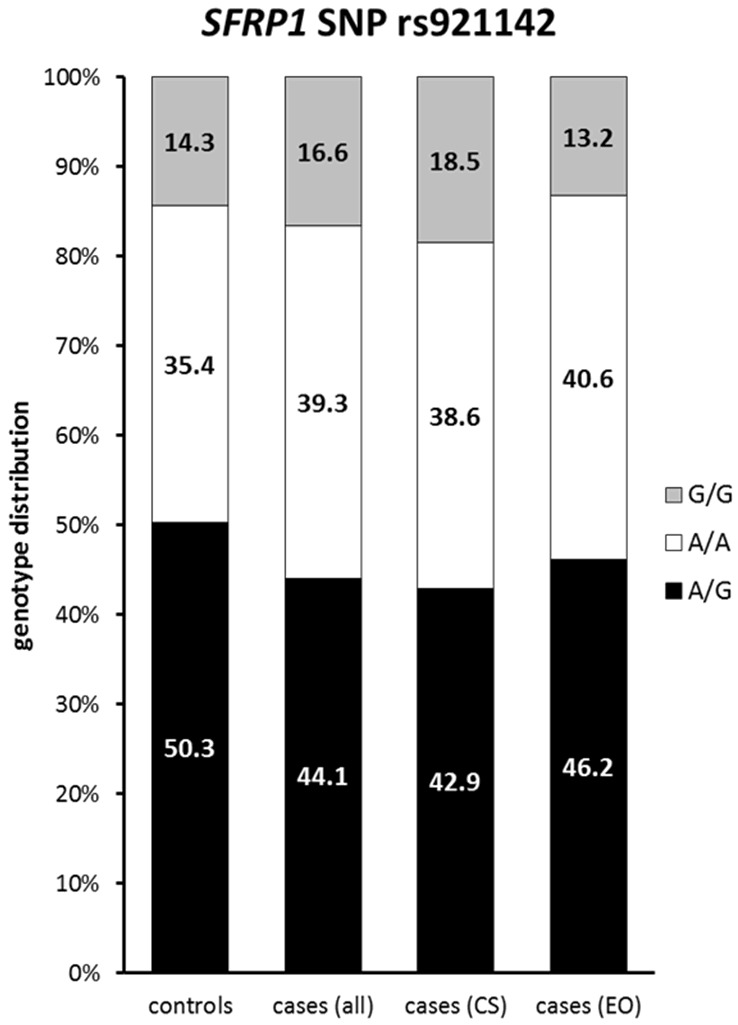
Distribution of rs921142 allele frequencies in study cohorts: Distribution of the SNP rs921142 genotypes within the study cohorts revealed no significant differences between cases and controls.
Table 5.
CT-, ΔCT-, ΔΔCT-values and expression ratios of hsa-miR-3646 microRNA Assay, normalised with RNU6B and SNORD44
| CT 3646 | CT RNU6B | CT SNORD44 | ΔCT | ΔΔCT | RQ | |
|---|---|---|---|---|---|---|
| RT112 | 24.95 | 15.9 | 18.4 | 7.79 | 2.73 | 0.15 |
| RT4 | 24.96 | 15.6 | 18.4 | 8.00 | 2.95 | 0.13 |
| J82 | 24.7 | 15.5 | 18.3 | 7.80 | 2.75 | 0.15 |
| BFTC905 | 23.42 | 17.2 | 21.3 | 4.18 | -0.87 | 1.83 |
| UROtsa | 23.87 | 17.5 | 17.6 | 6.34 | 1.29 | 0.41 |
| Urothelium | 25.47 | 17.6 | 23.3 | 5.06 | 0 | 1 |
| Patient 1 | 26.01 | 22.3 | 25.6 | 2.03 | -3.02 | 8.13 |
| Patient 2 | 27.62 | 22.3 | 25.4 | 3.79 | -1.27 | 2.41 |
| Patient 3 | 25.85 | 22.1 | 24.8 | 2.39 | -2.67 | 6.36 |
| Patient 4 | 25.6 | 22.5 | 24.3 | 2.22 | -2.83 | 7.13 |
| Patient 5 | 24.97 | 21.7 | 22.7 | 2.77 | -2.28 | 4.87 |
| Patient 6 | 24.7 | 20.8 | 23.7 | 1.80 | -3.25 | 9.54 |
| Patient 7 | 23.79 | 20.3 | 23.6 | 1.86 | -3.20 | 9.17 |
Abbreviations: RQ = relative quantification.
In silico analysis of SFRP1 SNP rs3242
To evaluate a possible functional consequence of the rs3242 SNP which would explain the increased incidence of rs3242 T-allele in young bladder cancer patients, we investigated the effect of allelic variants of rs3242 on mRNA structure of SFRP1 and on microRNA binding capacity with SFRP1 mRNA. MicroRNA secondary structure prediction software CONTRAfold revealed no changes in RNA structure, influenced by the rs3242 SNP. Results can be consulted at http://ai.stanford.edu/~chuongdo/cgi-bin/get_job_results.cgi?37544213 for rs3242 T-allele and at http://ai.stanford.edu/~chuongdo/cgi-bin/get_job_results.cgi?118032467 for the C-allele. We found two human microRNAs in miRbase (www.mirbase.org), that showed binding capacity only when T-allele was present in the SNP: hsa-miR-603 (located on chromosome 10p12.1) and hsa-miR-3646 (located on chromosome 20q13.12). Results of these analyses can be found at http://www.mirbase.org/cgi-bin/microRNA_entry.pl?acc=MI0003616 for hsa-miR-603 and at http://www.mirbase.org/cgi-bin/microRNA_entry.pl?acc=MI0016046 for hsa-miR-3646.
Expression analysis of hsa-miR-603 and hsa-miR-3646
To investigate whether these two microRNAs are expressed in bladder cancer cell lines and tissues, we performed microRNA expression assays for hsa-miR-603 and hsa-miR-3646 in RT112, RT4, J82, BFTC905, UROtsa, one primary urothelial cell line and in seven randomly selected papillary tumour samples. To normalise gene expression, we used ΔCT-average values of the two endogenous controls RNU6B and SNORD44. MicroRNA expression in the normal urothelium was defined as 100%. We found, that hsa-miR-3646 is expressed in relatively high levels in cell lines and in tumour samples (CT-values 23.42-27.62, Table 5) compared to hsa-miR-603, which only showed low levels of expression (CT-values >30, Table 6).
Table 6.
CT-, ΔCT-, ΔΔCT-values and expression ratios of hsa-miR-603 microRNA Assay, normalised with RNU6B and SNORD44
| CT 603 | CT RNU6B | CT SNORD44 | ΔCT | ΔΔCT | RQ | |
|---|---|---|---|---|---|---|
| RT112 | 31.34 | 16.54 | 18.91 | 13.62 | -1.19 | 2.28 |
| RT4 | 30.75 | 16.53 | 19.12 | 12.92 | -1.88 | 3.71 |
| J82 | 31.28 | 16.40 | 18.61 | 13.78 | -1.03 | 2.05 |
| BFTC905 | 34.32 | 18.06 | 22.16 | 14.56 | -0.25 | 1.19 |
| UROtsa | 31.58 | 18.33 | 18.31 | 13.25 | -1.56 | 2.94 |
| Urothelium | 37.15 | 18.37 | 24.31 | 14.81 | 0 | 1 |
| Patient 1 | 36.95 | 24.12 | 26.46 | 11.65 | -3.16 | 8.92 |
| Patient 2 | 36.71 | 24.43 | 26.37 | 11.31 | -3.50 | 11.32 |
| Patient 3 | 36.04 | 24.39 | 26.14 | 10.77 | -4.03 | 16.38 |
| Patient 4 | - | 24.06 | 25.34 | - | - | 0 |
| Patient 5 | 35.63 | 22.67 | 24.00 | 12.30 | -2.51 | 5.70 |
| Patient 6 | 37.01 | 22.56 | 24.83 | 13.32 | -1.49 | 2.82 |
| Patient 7 | 36.34 | 22.06 | 24.85 | 12.88 | -1.93 | 3.80 |
Abbreviations: RQ = relative quantification.
The highest expression of hsa-miR-3646 was found in tumour samples, with a 2.4- (patient 2) to a 9.5-fold (patient 6) increased expression compared to normal urothelium. Cell lines showed weaker expressions, ranging from 1.8-fold (BFTC905) to 0.13-fold (RT4). Relative quantification results for hsa-miR-3646 are displayed in Figure 5A. Values are shown in Table 5.
Figure 5.
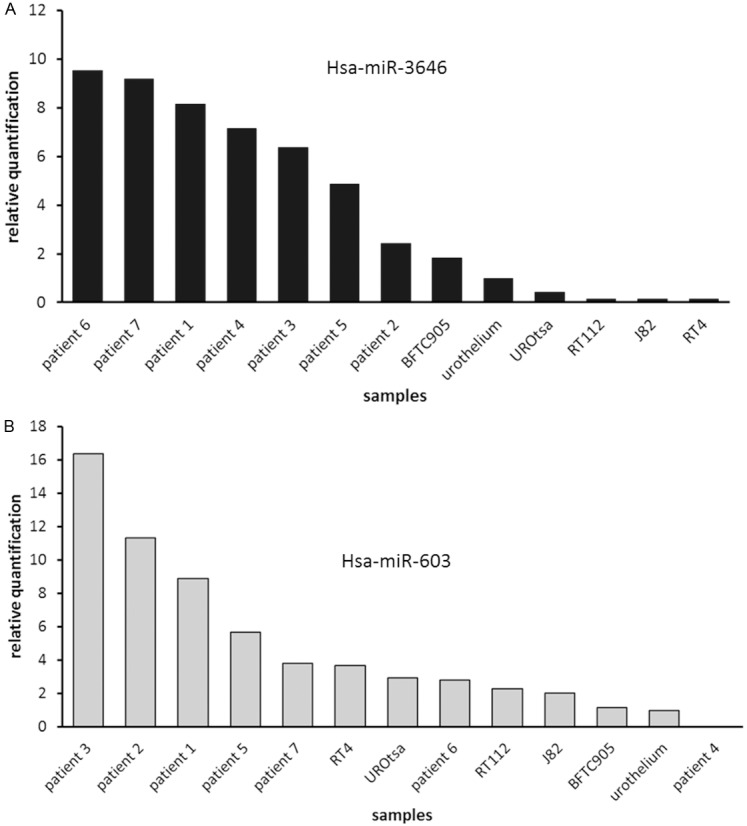
Graphic illustration of quantitative microRNA expression assays: A: Expression of hsa-miR-3646 in bladder cancer- and normal urothelial cell lines and in bladder tumour samples: expression in primary cell line of normal urothelium was defined as 100%; highest microRNA 3646 expression was observed mainly in tumour samples, lowest in RT112, J82 and RT4; B: Expression of hsa-miR-603 in bladder cancer cell lines, bladder tumour samples and normal urothelium; expression in primary cell line of normal urothelium was defined as 100%; in all investigated samples hsa-miR-603 was expressed in only low levels or almost no expression was detected; highest expression levels were found in tumour samples.
Hsa-miR-603 was generally only expressed in low levels in tumour specimens and cell lines. However, all analysed samples, except one tumour sample (patient 4), showed higher expression levels than normal urothelium. Highest expression levels were detected in five patient samples (patient 3, 2, 1, 5 and 7) with a 3.8- (patient 7) to 16.4-fold (patient 3) increased expression compared to normal urothelium. In one tumour sample (patient 4) not any expression was observed. Cell lines showed marginally increased expressions, compared to normal urothelium, with relative quantification values from 3.7 (RT4) to 1.8 (BFTC905). Relative quantification results for has-miR-603 are depicted in Figure 5B. Values are shown in Table 6.
Discussion
To our knowledge, this is the first study reporting the potential correlation of two SFRP1 SNPs and risk for cancer in general and for bladder cancer in particular. In our study, the investigation of the SFRP1 SNP rs3242 in 403 bladder cancer patients and in 332 healthy controls revealed a significant difference in genotype distribution, showing increased presence of risk allele T in cancer patients. It is likely that the occurrence of at least one T-allele or vice versa the loss of one C-allele in the SNP increases the risk for bladder cancer.
Within our analyses we distinguished two age-dependent groups of bladder cancer patients: one highly selected group of patients with disease onset ≤45 years and one group with unselected patients from a consecutive series. We found that the origin of the statistical difference resulted from the genotype difference between early-onset cancer patients and controls, however not from the difference between consecutive-study patients compared to the control group. This finding suggests, that mainly in younger patients, disease risk seems to be associated with an over-representation of the T-allele.
Age-dependent correlations of SNPs with disease risk are known from several studies. Grochola et al could identify one SNP in PPP2R5E (ε-SNP2), which showed a significant association with age at disease onset, with disease risk and with overall survival in soft tissue sarcoma [24].
Also in mediators of the P53-signaling cascade, age-dependent SNPs could be determined. Three independent groups demonstrated, that carriers of P53 mutations (Li-Fraumeni syndrome) with one G-allele in MDM2 SNP 309 showed earlier disease onset of 7, 10 and 16 years, respectively, compared to T-allele carriers [25-27]. But also in G-allele carriers without P53 mutation, earlier disease onset was observed in multiple malignancies [25,28-35].
Due to our findings and to those mentioned above, it seems feasible that disease onset might be influenced significantly by certain SNPs, such as rs3242 in SFRP1. Therefore, it is essential to clarify possible biological mechanisms involving rs3242.
The rs3242 SNP is located in the 3’UTR of SFRP1 and therefore its sequence is non-coding and it is not involved in SNP-dependent modified protein expression. The 3’UTR is however an area for binding sites of proteins and microRNAs that affect stability and transport of the mRNA. The analysis of mRNA stability in consideration of the two different nucleotides in the SNP region revealed no changes in mRNA secondary structure. MicroRNA analysis revealed two microRNAs that are predicted to bind the SFRP1 3’UTR region only if T nucleotide is present in rs3242 SNP of SFRP1 mRNA sequence: hsa-miR-603 and hsa-miR-3646. Binding of those two microRNAs might lead to degradation of the SFRP1 mRNA or to its destabilisation and hence to inhibition or alteration of translation, resulting in Wnt signalling dysregulation. From this point of view, hsa-miR-603 and hsa-miR-3646 could be considered as potential oncogenes in bladder cancer patients that harbour at least one T-allele in the rs3242 SNP of SFRP1.
MicroRNA-dependent activation of progression and malignancy-associated pathways is also known from other pathways such as Shh-pathway, where deregulation of hsa-miR-92A, 19A and 20A was associated with poor overall survival of muscle-invasive bladder cancer and with overexpression of SHH and GLI-inducible target genes [36].
Our findings, however raised the question, why only heterozygous allele distribution was altered in early-onset patients, whereas distribution of homozygous T/T-genotype showed no distinct difference in cases and controls. We would expect even stronger binding of microRNAs in T/T-homozygous patients, which would result in excessive down-regulation of SFRP1 and hence increased malignant potential of the cell. If this was the case, an even higher difference in occurrence of T/T-genotype between cases and controls would have been expected.
To further investigate the influence of hsa-miR-603 and hsa-miR-3646 on rs3242 in bladder cancer, we first analysed the genetic loci of those two microRNAs for gain or loss in 19 papillary bladder cancer patients from a previous study (data not shown). In this study we selected 9 papillary tumours with histopathological stage pTa and 10 papillary tumours with invasive stage pT1 and performed array-based comparative genomic hybridisation (aCGH) using Genome-Wide SNP array 6.0 (Affymetrix). For hsa-miR-603 no changes of copy number were detected on the hsa-miR-603 locus. For each tumour, two copies of the hsa-miR-603 locus could be observed. For hsa-miR-3646, however, there was a remarkable difference between pTa and pT1 tumours. 11% of pTa tumours (1/9) and 60% of pT1 tumours (6/10) showed gain of hsa-miR-3646 locus. This amplification appeared in line with one additional gene copy of 20q13.12 (where STK4 is located), resulting in three gene copies of hsa-miR-3646 and STK4. STK4 encodes for seine/threonine-protein kinase 4 and acts upstream of the stress-induced mitogen-activated protein kinase cascade. Chromosomal gain with more than three copies was not detected at this locus. From this finding we conclude, that probably already a slight increase of microRNA expression might lead to distinct or severe functional and phenotypical consequences. Our results indicate that only hsa-miR-3646, but to a lesser extent hsa-miR-603 might act as an oncogene in urothelial carcinogenesis by possibly modulating Wnt-signal inhibition.
As no information was available about the expression of hsa-miR-603 and hsa-miR-3646 in bladder tissue, we screened bladder cancer and normal urothelial cell lines as well as seven randomly selected bladder tumour specimens for expression of both microRNAs using qRT-PCR-based microRNA assay.
Hsa-miR-603 showed only very weak, hsa-miR-3646 however relatively strong expression in cell lines and tumours. We hypothesize that hsa-miR-603 expression level represents the normal amount of microRNA in the cell, which was supported by the finding, that no deletion or reduced copy number could be detected in aCGH analysis. High expression levels of hsa-miR-3646 could be a result of chromosomal amplifications and increase of copy number status as shown in aCGH.
Previous analyses (data not shown) demonstrated that RT112 cells express SFRP1, as well as RT4 and J82. BFTC905, however, showed no expression of SFRP1, resulting mainly from epigenetic promoter methylation. RT112 has the rs3242 C/C genotype and therefore microRNA expression should not influence SFRP1 expression. RT4 and J82 harbour at least one T-allele and therefore we would expect binding of the two microRNAs and hence down-regulation of SFRP1 mRNA, which would result in a higher malignant potential of the cells. For a better understanding of an association of the microRNAs hsa-miR-603 and -3646 and the rs3242 SNP in SFRP1, it will be helpful to overexpress both microRNAs in bladder cancer cell lines and analyse functional effects and effects on SFRP1 expression. For this experiment RT112, RT4 and J82 could be chosen as they are representing all different genotypes of rs3242 and show expression of SFRP1 in wild type cells.
Regarding rs921142, genotype distribution showed no association with bladder cancer risk.
In conclusion we were able to report for the first time a potential association between the rs3242 SNP in the Wnt antagonist SFRP1 and bladder cancer risk. The genotype of rs3242 might play an important role in early-onset bladder cancer. Patients harbouring one T-allele seem to have a higher risk for bladder cancer at early age, possibly due to a different binding capacity and expression of microRNA 3646.
Acknowledgements
We are grateful to Verena Popp, Claudia Knoll, Yvonne Sauermann, Monika Kerscher and Andrea Lieschke for their excellent technical assistance. We thank all pathologists providing samples of the early-onset bladder cancer patients for this study. This study was supported by a grant of the Interdisziplinäres Zentrum für Klinische Forschung fund of the University Hospital Erlangen to PSG, BW, AH and RS. We acknowledge support by Deutsche Forschungsgemeinschaft and Friedrich-Alexander-Universität Erlangen-Nürnberg within the funding program Open Access Publishing.
Disclosure of conflict of interest
The authors declare that they have no editorial or financial conflict of interest.
References
- 1.Klaus A, Birchmeier W. Wnt signalling and its impact on development and cancer. Nat Rev Cancer. 2008;8:387–398. doi: 10.1038/nrc2389. [DOI] [PubMed] [Google Scholar]
- 2.Wei W, Chua MS, Grepper S, So SK. Blockade of Wnt-1 signaling leads to anti-tumor effects in hepatocellular carcinoma cells. Mol Cancer. 2009;8:76. doi: 10.1186/1476-4598-8-76. [DOI] [PMC free article] [PubMed] [Google Scholar]
- 3.Moon RT, Kohn AD, De Ferrari GV, Kaykas A. WNT and beta-catenin signalling: diseases and therapies. Nat Rev Genet. 2004;5:691–701. doi: 10.1038/nrg1427. [DOI] [PubMed] [Google Scholar]
- 4.Konigshoff M, Balsara N, Pfaff EM, Kramer M, Chrobak I, Seeger W, Eickelberg O. Functional Wnt signaling is increased in idiopathic pulmonary fibrosis. PLoS One. 2008;3:e2142. doi: 10.1371/journal.pone.0002142. [DOI] [PMC free article] [PubMed] [Google Scholar]
- 5.Deng H, Ravikumar TS, Yang WL. Overexpression of bone morphogenetic protein 4 enhances the invasiveness of Smad4-deficient human colorectal cancer cells. Cancer Lett. 2009;281:220–231. doi: 10.1016/j.canlet.2009.02.046. [DOI] [PubMed] [Google Scholar]
- 6.Caldwell GM, Jones C, Gensberg K, Jan S, Hardy RG, Byrd P, Chughtai S, Wallis Y, Matthews GM, Morton DG. The Wnt antagonist sFRP1 in colorectal tumorigenesis. Cancer Res. 2004;64:883–888. doi: 10.1158/0008-5472.can-03-1346. [DOI] [PubMed] [Google Scholar]
- 7.Veeck J, Niederacher D, An H, Klopocki E, Wiesmann F, Betz B, Galm O, Camara O, Durst M, Kristiansen G, Huszka C, Knuchel R, Dahl E. Aberrant methylation of the Wnt antagonist SFRP1 in breast cancer is associated with unfavourable prognosis. Oncogene. 2006;25:3479–3488. doi: 10.1038/sj.onc.1209386. [DOI] [PubMed] [Google Scholar]
- 8.Dahl E, Wiesmann F, Woenckhaus M, Stoehr R, Wild PJ, Veeck J, Knuchel R, Klopocki E, Sauter G, Simon R, Wieland WF, Walter B, Denzinger S, Hartmann A, Hammerschmied CG. Frequent loss of SFRP1 expression in multiple human solid tumours: association with aberrant promoter methylation in renal cell carcinoma. Oncogene. 2007;26:5680–5691. doi: 10.1038/sj.onc.1210345. [DOI] [PubMed] [Google Scholar]
- 9.Gumz ML, Zou H, Kreinest PA, Childs AC, Belmonte LS, LeGrand SN, Wu KJ, Luxon BA, Sinha M, Parker AS, Sun LZ, Ahlquist DA, Wood CG, Copland JA. Secreted frizzled-related protein 1 loss contributes to tumor phenotype of clear cell renal cell carcinoma. Clin Cancer Res. 2007;13:4740–4749. doi: 10.1158/1078-0432.CCR-07-0143. [DOI] [PubMed] [Google Scholar]
- 10.Shih YL, Hsieh CB, Lai HC, Yan MD, Hsieh TY, Chao YC, Lin YW. SFRP1 suppressed hepatoma cells growth through Wnt canonical signaling pathway. Int J Cancer. 2007;121:1028–1035. doi: 10.1002/ijc.22750. [DOI] [PubMed] [Google Scholar]
- 11.Stoehr R, Wissmann C, Suzuki H, Knuechel R, Krieg RC, Klopocki E, Dahl E, Wild P, Blaszyk H, Sauter G, Simon R, Schmitt R, Zaak D, Hofstaedter F, Rosenthal A, Baylin SB, Pilarsky C, Hartmann A. Deletions of chromosome 8p and loss of sFRP1 expression are progression markers of papillary bladder cancer. Lab Invest. 2004;84:465–478. doi: 10.1038/labinvest.3700068. [DOI] [PubMed] [Google Scholar]
- 12.Buim ME, Soares FA, Sarkis AS, Nagai MA. The transcripts of SFRP1,CEP63 and EIF4G2 genes are frequently downregulated in transitional cell carcinomas of the bladder. Oncology. 2005;69:445–454. doi: 10.1159/000090984. [DOI] [PubMed] [Google Scholar]
- 13.Neuhausen A, Florl AR, Grimm MO, Schulz WA. DNA methylation alterations in urothelial carcinoma. Cancer Biol Ther. 2006;5:993–1001. doi: 10.4161/cbt.5.8.2885. [DOI] [PubMed] [Google Scholar]
- 14.Sims AM, Shephard N, Carter K, Doan T, Dowling A, Duncan EL, Eisman J, Jones G, Nicholson G, Prince R, Seeman E, Thomas G, Wass JA, Brown MA. Genetic analyses in a sample of individuals with high or low BMD shows association with multiple Wnt pathway genes. J Bone Miner Res. 2008;23:499–506. doi: 10.1359/jbmr.071113. [DOI] [PubMed] [Google Scholar]
- 15.Ohnaka K, Yamamoto K, Nakamura K, Adachi M, Kawate H, Kono S, Takayanagi R. Association of single nucleotide polymorphisms in secreted frizzled-related protein 1 gene with bone mineral density in Japanese women. Geriatr Gerontol Int. 2009;9:304–309. doi: 10.1111/j.1447-0594.2009.00540.x. [DOI] [PubMed] [Google Scholar]
- 16.Tremblay K, Daley D, Chamberland A, Lemire M, Montpetit A, Laviolette M, Musk AW, James AL, Chan-Yeung M, Becker A, Kozyrskyj AL, Sandford AJ, Hudson TJ, Pare PD, Laprise C. Genetic variation in immune signaling genes differentially expressed in asthmatic lung tissues. J Allergy Clin Immunol. 2008;122:529–536. e517. doi: 10.1016/j.jaci.2008.05.049. [DOI] [PubMed] [Google Scholar]
- 17.Mostofi FK. Histological Typing of Urinary Bladder Tumors. Geneva: Springer; 1973. International Histological Classification of Tumors. [Google Scholar]
- 18.Sobin LH, Gospodarowicz MK, Wittekind C. TNM Classification of Malignant Tumors. New York: UICC; 2009. [Google Scholar]
- 19.Masters JR, Hepburn PJ, Walker L, Highman WJ, Trejdosiewicz LK, Povey S, Parkar M, Hill BT, Riddle PR, Franks LM. Tissue culture model of transitional cell carcinoma: characterization of twenty-two human urothelial cell lines. Cancer Res. 1986;46:3630–3636. [PubMed] [Google Scholar]
- 20.Tzeng CC, Liu HS, Li C, Jin YT, Chen RM, Yang WH, Lin JS. Characterization of two urothelium cancer cell lines derived from a blackfoot disease endemic area in Taiwan. Anticancer Res. 1996;16:1797–1804. [PubMed] [Google Scholar]
- 21.Rieger KM, Little AF, Swart JM, Kastrinakis WV, Fitzgerald JM, Hess DT, Libertino JA, Summerhayes IC. Human bladder carcinoma cell lines as indicators of oncogenic change relevant to urothelial neoplastic progression. Br J Cancer. 1995;72:683–690. doi: 10.1038/bjc.1995.394. [DOI] [PMC free article] [PubMed] [Google Scholar]
- 22.Hatina J, Huckenbeck W, Rieder H, Seifert HH, Schulz WA. [Bladder carcinoma cell lines as models of the pathobiology of bladder cancer. Review of the literature and establishment of a new progression series] . Urologe A. 2008;47:724–734. doi: 10.1007/s00120-008-1687-4. [DOI] [PubMed] [Google Scholar]
- 23.Schmittgen TD, Livak KJ. Analyzing real-time PCR data by the comparative C(T) method. Nat Protoc. 2008;3:1101–1108. doi: 10.1038/nprot.2008.73. [DOI] [PubMed] [Google Scholar]
- 24.Grochola LF, Vazquez A, Bond EE, Wurl P, Taubert H, Muller TH, Levine AJ, Bond GL. Recent natural selection identifies a genetic variant in a regulatory subunit of protein phosphatase 2A that associates with altered cancer risk and survival. Clin Cancer Res. 2009;15:6301–6308. doi: 10.1158/1078-0432.CCR-09-0797. [DOI] [PubMed] [Google Scholar]
- 25.Bond GL, Hu W, Bond EE, Robins H, Lutzker SG, Arva NC, Bargonetti J, Bartel F, Taubert H, Wuerl P, Onel K, Yip L, Hwang SJ, Strong LC, Lozano G, Levine AJ. A single nucleotide polymorphism in the MDM2 promoter attenuates the p53 tumor suppressor pathway and accelerates tumor formation in humans. Cell. 2004;119:591–602. doi: 10.1016/j.cell.2004.11.022. [DOI] [PubMed] [Google Scholar]
- 26.Bougeard G, Baert-Desurmont S, Tournier I, Vasseur S, Martin C, Brugieres L, Chompret A, Bressac-de Paillerets B, Stoppa-Lyonnet D, Bonaiti-Pellie C, Frebourg T. Impact of the MDM2 SNP309 and p53 Arg72Pro polymorphism on age of tumour onset in Li-Fraumeni syndrome. J Med Genet. 2006;43:531–533. doi: 10.1136/jmg.2005.037952. [DOI] [PMC free article] [PubMed] [Google Scholar]
- 27.Ruijs MW, Schmidt MK, Nevanlinna H, Tommiska J, Aittomaki K, Pruntel R, Verhoef S, Van’t Veer LJ. The single-nucleotide polymorphism 309 in the MDM2 gene contributes to the Li-Fraumeni syndrome and related phenotypes. Eur J Hum Genet. 2007;15:110–114. doi: 10.1038/sj.ejhg.5201715. [DOI] [PubMed] [Google Scholar]
- 28.Bond GL, Hirshfield KM, Kirchhoff T, Alexe G, Bond EE, Robins H, Bartel F, Taubert H, Wuerl P, Hait W, Toppmeyer D, Offit K, Levine AJ. MDM2 SNP309 accelerates tumor formation in a gender-specific and hormone-dependent manner. Cancer Res. 2006;66:5104–5110. doi: 10.1158/0008-5472.CAN-06-0180. [DOI] [PubMed] [Google Scholar]
- 29.Swinney RM, Hsu SC, Hirschman BA, Chen TT, Tomlinson GE. MDM2 promoter variation and age of diagnosis of acute lymphoblastic leukemia. Leukemia. 2005;19:1996–1998. doi: 10.1038/sj.leu.2403941. [DOI] [PubMed] [Google Scholar]
- 30.Huang SF, Chen IH, Liao CT, Wang HM, Liou SH, Hsieh LL. Combined effects of MDM2 SNP 309 and p53 mutation on oral squamous cell carcinomas associated with areca quid chewing. Oral Oncol. 2009;45:16–22. doi: 10.1016/j.oraloncology.2008.03.006. [DOI] [PubMed] [Google Scholar]
- 31.Menin C, Scaini MC, De Salvo GL, Biscuola M, Quaggio M, Esposito G, Belluco C, Montagna M, Agata S, D’Andrea E, Nitti D, Amadori A, Bertorelle R. Association between MDM2-SNP309 and age at colorectal cancer diagnosis according to p53 mutation status. J Natl Cancer Inst. 2006;98:285–288. doi: 10.1093/jnci/djj054. [DOI] [PubMed] [Google Scholar]
- 32.Nakashima M, Kondo S, Shimizu Y, Wakisaka N, Murono S, Furukawa M, Yoshizaki T. Impact of MDM2 single nucleotide polymorphism on tumor onset in head and neck squamous cell carcinoma. Acta Otolaryngol. 2008;128:808–813. doi: 10.1080/00016480701724904. [DOI] [PubMed] [Google Scholar]
- 33.Wasielewski M, Nagel JH, Brekelmans C, Klijn JG, van den Ouweland A, Meijers-Heijboer H, Schutte M. MDM2 SNP309 accelerates familial breast carcinogenesis independently of estrogen signaling. Breast Cancer Res Treat. 2007;104:153–157. doi: 10.1007/s10549-006-9407-5. [DOI] [PubMed] [Google Scholar]
- 34.Bartel F, Jung J, Bohnke A, Gradhand E, Zeng K, Thomssen C, Hauptmann S. Both germ line and somatic genetics of the p53 pathway affect ovarian cancer incidence and survival. Clin Cancer Res. 2008;14:89–96. doi: 10.1158/1078-0432.CCR-07-1192. [DOI] [PubMed] [Google Scholar]
- 35.Sanchez-Carbayo M, Socci ND, Kirchoff T, Erill N, Offit K, Bochner BH, Cordon-Cardo C. A polymorphism in HDM2 (SNP309) associates with early onset in superficial tumors, TP53 mutations, and poor outcome in invasive bladder cancer. Clin Cancer Res. 2007;13:3215–3220. doi: 10.1158/1078-0432.CCR-07-0013. [DOI] [PubMed] [Google Scholar]
- 36.Pignot G, Vieillefond A, Vacher S, Zerbib M, Debre B, Lidereau R, Amsellem-Ouazana D, Bieche I. Hedgehog pathway activation in human transitional cell carcinoma of the bladder. Br J Cancer. 2012;106:1177–1186. doi: 10.1038/bjc.2012.55. [DOI] [PMC free article] [PubMed] [Google Scholar]