

Abstract
Multiprotein complexes, rather than individual proteins, make up a large part of the biological macromolecular machinery of a cell. Understanding the structure and organization of these complexes is critical to understanding cellular function. Chemical cross-linking coupled with mass spectrometry is emerging as a complementary technique to traditional structural biology methods and can provide low-resolution structural information for a multitude of purposes, such as distance constraints in computational modeling of protein complexes. In this review, we discuss the experimental considerations for successful application of chemical cross-linking-mass spectrometry in biological studies and highlight three examples of such studies from the recent literature. These examples (as well as many others) illustrate the utility of a chemical cross-linking-mass spectrometry approach in facilitating structural analysis of large and challenging complexes.
Keywords: Chemical cross-linking, Mass spectrometry, Structural biology, Protein complexes, Computational modeling, Integrative structural biology
Introduction
From simple homodimeric enzymes to massive multiprotein/nucleic acid complexes such as ribosomes or viruses, biological processes are carried out by dynamic protein complexes. Understanding the quaternary structure and dynamics of these protein complexes is critical to understanding cellular function. To date, NMR spectroscopy and X-ray crystallography have been the analytical workhorses for determining protein structures, as evidenced by the ∼80,000 protein structures presently stored in the Protein Data Bank. However, the larger, more heterogeneous, and/or more dynamic protein complexes, including membrane proteins and complexes whose composition and conformation change as an integral part of their function, are often not amenable to traditional NMR or crystallographic analysis.
Studying multiprotein complexes requires a toolbox of alternative structural biology methods that complement the traditional methods [1]. Alternative methods include well-known techniques such as small-angle X-ray scattering [2], single-particle cryoelectron microscopy [3, 4] and analytical ultracentrifugation [5], as well as several mass spectrometric techniques [6] that may be less familiar to the structural biology community, such as covalent modification/chemical footprinting [7], ion mobility spectrometry [8], native mass spectrometry (MS) of protein complexes [9], and chemical cross-linking-MS (XL-MS), the focus of this review. Used in various combinations with each other and with atomic-resolution structures of domains and subunits from crystallography and NMR spectroscopy, this suite of techniques allows for detailed characterization of large multiprotein complexes that are inaccessible to crystallography or NMR alone. Increasingly, these techniques are being combined with computational modeling of protein structures to provide accurate structural models, an approach that is coming to be known as integrative structural biology [1, 10, 11].
While XL-MS can complement NMR and crystallographic structural studies, the present capabilities and limitations of XL-MS are generally appreciated by only a small subset of the proteomics/MS community. As with many developing methods, a consensus approach to conducting XL-MS experiments and data analysis has yet to emerge. This lack of a clear consensus has been an obstacle to wider application of XL-MS technologies as a non-expert is faced with many interdependent choices of reagents, protocols, and software. Still, recent developments have led to increasingly robust XL-MS methods that can generate useful structural insights. For example, variations on the basic XL-MS approach have been used to study a number of multiprotein complexes, including the Salmonella type 3 secretion system needle complex [53, 57], archaeal [24] and eukaryotic proteosomes [3, 27, 67], yeast transcription initiation complexes [6, 38], and even the prokaryotic ribosome [28]. XL-MS also has been used to study protein-protein interactions in live cells [37], and to study the structure of affinity-purified [19] and immunoprecipitated [30] complexes.
The purpose of this review is to provide sufficient background for structural biologists to better understand the range of XL-MS methods available, including their respective capabilities and limitations, and their utility in structural studies. In the following sections, we identify the challenges associated with XL-MS, considerations and choices at each step of a basic XL-MS workflow (and some selected variations upon it), and highlight three examples that illustrate different combinations of methods that can lead to new structural insights. Note that we do not include a comprehensive survey of the cross-linking literature in this review as it already has been ably reported by several leaders in the field [12-16].
Recognizing the challenges
By chemical-cross linking of proteins, we refer to the introduction of a covalent linkage (the cross-link) between two distinct protein sites, either intramolecular or intermolecular, by reaction with a bifunctional regent (the cross-linker). The distance between cross-linked sites is constrained according to the chemical and physical properties of the protein(s) and cross-linker. It is important at the outset to understand what XL-MS can offer and what it cannot. XL-MS can complement and extend NMR and crystallographic structural studies, and it is often feasible when these other methods are not. In addition, XL-MS data can be used as distance restraints in structural modeling, and as a method for evaluating and filtering computational models of protein structure. However, XL-MS is not in itself a technique for determining atomic-resolution structures.
Although XL-MS relies on the same fundamental technology as MS-based proteomics, the complexity of a digest of a cross-linked protein along with the scarcity of cross-linked peptides in the mixture pose formidable analytical and informatics challenges. First, the analytical platform must have sufficient sensitivity and dynamic range to deal with the complexity of a digest of a cross-linked protein sample. Such a sample contains far more unique chemical species than a digest of the non-cross-linked protein, because the number of potential cross-linked peptides increases quadratically with the sequence length. In addition, cross-linking produces many peptides modified by a hydrolyzed linker (that is, one end of the linker reacts with the protein and the other with water; this product is known as a dead-end), as well as the unmodified peptides, creating a highly complex mixture [17].
Most often the linker/protein ratio is kept low to avoid artifacts such as cross-link-induced polymerization (which can lead to the detection of cross-linked peptides that can only form in the artifactual polymer) or other structural perturbation. Therefore, cross-linked peptides are a very minor component of this complex mixture, sometimes two orders of magnitude less abundant than other components. Ionization suppression, a well-known process by which easily-ionized peptides decrease the observed signal of other peptides, and data-dependent analysis, in which peptide ions observed during the LC-MS analysis are typically selected for fragmentation in order of abundance, can both increase the difficulty of characterizing low-abundance cross-linked peptides.
The high complexity of XL-MS samples also creates informatics challenges. Database search algorithms work by comparing the observed tandem mass spectrum to the theoretical spectra of all possible peptides within a given mass range. Increased sample complexity means increased degeneracy of peptide masses (within the mass accuracy of the instrument) and thus an increased chance of an incorrect identification. Further, the complex fragmentation patterns present in MS/MS spectra of cross-linked peptides necessitate specialized informatics approaches [18]. The informatics issue has until recently been the greatest hurdle to widespread application of XL-MS.
Successful XL-MS workflows must address these challenges through a combination of sample preparation, instrumental analysis, and informatics techniques; for example, using chromatographic enrichment of cross-linked peptides to reduce sample complexity, excluding low charge state peptide ions from fragmentation to increase the sensitivity for detecting low-abundance cross-linked peptides, etc. The diversity of approaches at each stage of the XL-MS process has led to a profusion of methods described in the literature. However, without some understanding of the interdependent methods, the XL-MS field as a whole can be difficult to navigate, especially for the non-expert.
Navigating the XL-MS methodological maze
The basic XL-MS approach has changed little since its introduction by Young and coworkers 13 years ago (Figure 1A) [19]. A protein or protein complex is treated with a bifunctional cross-linking reagent that introduces covalent linkages between specific functional groups in the protein. The cross-linked protein is then digested with a protease, and the resulting mixture is analyzed by liquid chromatography (LC)-MS/MS to identify cross-linked peptides and determine their sequences. The locations of cross-links provide structural information about the system under study.
Figure 1.
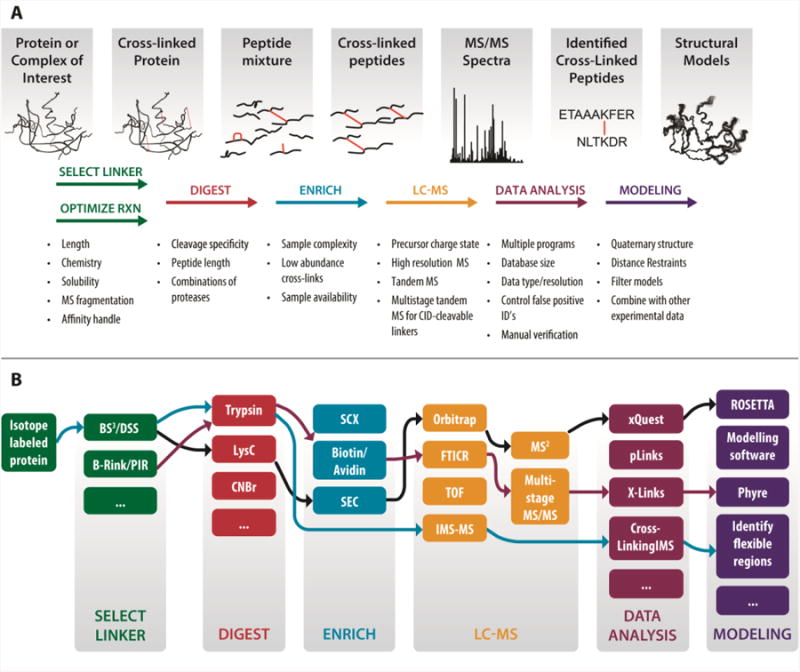
The generalized cross-linking mass spectrometry (XL-MS) workflow. A, the essential elements of the XL-MS approach, indicating the issues to be considered at each step. The protein or protein complex of interest is cross-linked and digested with a protease. Cross-linked peptides, which under optimal conditions are minor products of the cross-linking reaction, may be chromatographically enriched. The cross-linked peptides are then analyzed by liquid-chromatography/tandem mass spectrometry. Specialized software identifies MS/MS spectra of cross-linked peptides by a database search method similar to those used in proteomics. The resulting cross-links provide distance constraints for use in structural analysis, including docking and modeling. B, there are many options available at each step of the XL-MS workflow. Sometimes these options can be freely interchanged in a modular fashion, but in other cases, methods used in one step of the workflow require or enable methods in another step. For instance, mass-spectrometry cleavable cross-linkers are necessary in order to use the multistage MS/MS data acquisition and analysis strategy (see text and Figure 2 for details).
Despite this conceptual simplicity, the field to date has resembled a methodological maze, with a multitude of options available for every aspect of sample preparation, data acquisition, and data analysis (Figure 1B), each intended to overcome the inherent complexities of XL-MS samples and data. To be successful, a researcher must be able to navigate this maze by selecting an appropriate combination of techniques for each step of the workflow. The following sections highlight the considerations and choices at each step.
Cross-linker reagents
A large number of cross-linking reagents have been described in the literature (reviews of cross-linker chemistries are given in references [13] and [20]), and many are commercially available. The most important considerations in selecting a cross-linker are chemical specificity, which determines the functional groups targeted by the linker, and linker-arm length. The most commonly used cross-linkers are the amine-reactive N-hydroxysuccinimide (NHS) esters, such as disuccinimidyl suberate (DSS) and its more soluble sulfonate analogue bis[sulfosuccinimidyl]suberate (BS3). NHS esters have the advantage of high specificity and of targeting a relatively common residue in proteins (lysine). The disadvantages of NHS esters include the tendency to hydrolyze in water, and the need for slightly basic reaction conditions which may not be appropriate for all proteins, and the secondary reactivity toward hydroxyl groups. Other commonly used chemistries include imidoester (which also targets amines) and maleimide and thiol (both of which target cysteine residues). The length of the linker determines the precision of the distance restraint implied by an observed cross-link, but the main effect of decreasing linker length is to decrease the number of cross-links observed [21]. The linker length of the DSS and BS3 is ∼11.4 Å, corresponding to an eight-carbon aliphatic chain. Lengths of other common reagents range from 8-18 Å. In addition, many cross-linking reagents have special features, such as biotin moieties for avidin affinity enrichment, stable isotope labels (mixed heavy and light reagents provide characteristic mass spectrometric doublets), or labile bonds that are cleavable by collision-induced dissociation (CID) in the mass spectrometer. Use of these “CID-cleavable” reagents can greatly simplify data analysis (see below).
Optimizing the Cross-Linking Reaction
Cross-linking reaction conditions must preserve the native structure of the protein complex. Excessive cross-linking can lead to structural distortion, artifactual oligomerization or aggregation, and precipitation. To avoid these effects, optimal conditions (such as protein and linker concentration, cross-linker/protein ratio, reaction time, and temperature) should be determined empirically. Ideal conditions are specific to the protein or protein complex being studied, but for NHS ester cross-linkers, typical final conditions are low micromolar protein concentration, 20- to 1000-fold molar excess cross-linker, and reaction times of ∼30 min at room temperature, or 2 h on ice. The reaction buffer must be devoid of amines, as these will react with the cross-linker, thereby excluding many common biological buffers such as Tris. A commonly-used compatible buffer is phosphate-buffered saline. Excess cross-linker is quenched with an amine-containing reagent (e.g., Tris, ammonium bicarbonate, or glycine) and/or removed by buffer exchange.
The reaction is optimized by varying these conditions and by analyzing the reaction mixtures using SDS-PAGE or MS before digestion (for example, see [22, 23]). In some cases, it may be desirable to complete the entire cross-linking workflow for several different sets of reaction conditions. Agreement between cross-links observed in different conditions is evidence that they are structurally relevant and not caused by cross-linker-induced structural perturbations [14]. Circular dichroism spectroscopy can be used to assess whether the cross-linking reaction has introduced unacceptable perturbations of the secondary structure. If unwanted oligomerization occurs, the target quaternary structure can sometimes be purified by SDS-PAGE (either by excising bands from an analytical gel or by preparative SDS-PAGE) or size-exclusion chromatography [19].
Digestions of Cross-Linked Protein Mixtures with Proteases
Denaturation and protease digestion is the next step in the XL-MS workflow. It is possible that the presence of cross-links hinders protease digestion, but typical protocols in the literature are similar to protocols used for digesting non-cross-linked proteins or proteomes (e.g., trypsin: protein mass ratio of 30-50 and digestion times of 3-16 hours at 37 °C). Trypsin is the most commonly used enzyme for cross-linking studies, as it is for proteomics in general. Other endopeptidases have been used, either alone or in combination with trypsin, including chymotrypsin, GluC, AspN and LysC [22, 24], and the chemical agent cyanogen bromide [25]. The use of multiple proteases was shown to improve detection of cross-linked peptides, probably by increasing the number of protease cleavage sites in lysine- and arginine-poor regions of the sequence [24].
Enrichment of Cross-Linked Peptides
The most useful structural information from an XL-MS experiment comes from interpeptide cross-links (i.e. those between peptides as opposed to a cross-link between two sites within the same peptide). However, interpeptide cross-links are the least abundant product of a XL-MS experiment, being far outnumbered by dead-ends and unmodified peptides. To improve detection of these cross-linked peptides, some form of enrichment is desirable. When dealing with complex samples (i.e., a large number of proteins), enrichment becomes essential. (Complexity is a function of total sequence length of all proteins in the sample.) The three main enrichment methods are strong cation exchange chromatography (SCX), size exclusion chromatography (SEC), and biotin/avidin affinity chromatography. SCX, in which separation is based on electrostatic charge [26, 27], is the most frequently used enrichment strategy. SCX enriches tryptic cross-linked peptides because they carry a greater positive charge than non-cross-linked peptides: a positively charged peptide N-terminus and a positively charged lysine or arginine residue for each peptide in the cross-link. (In addition, some linkers preserve the positive charge on the cross-linked lysine residues [28] or themselves carry a positive charge [29]). Since cross-linked peptides are also larger than regular peptides, peptide-level SEC has also been used [24, 30]. SEC may be more effective with proteases that cleave less frequently and create longer peptides, such as lysyl endopeptidase (cleave after lysine residues) rather than trypsin (cleaves after lysine and arginine residues).
A much different strategy uses immobilized avidin to capture peptides that have been modified with a biotin-containing cross-linker. The research groups of Bruce [31, 32] and others [33-35] have used this technique on a variety of systems. While effective, this method has two main drawbacks: First, “dead-ends” are also enriched, since they are also biotinylated. Second, these cross-linkers are sometimes very long (>30 Å instead of the 8-18 Å of more conventional reagents), and the increased bulk of the linker reagent may prevent the close approach of the linker molecule to the reactive lysine residues, preventing cross-link formation by steric hindrance. The long linker also reduces the spatial resolution of the structural information obtained. To overcome the steric bulk issue, our laboratory has developed the CLIP cross-linker [36]. In this approach, the cross-linker contains an alkyne function that can be ligated to a biotin-containing azide reagent after the cross-linking step is complete. Since the alkyne-containing linker is much smaller than many biotinylated cross-linkers, the potential for steric hindrance of the cross-linker/protein interaction is minimized. The drawback of this approach is that the additional chemical modification and purification steps can result in significant sample loss.
LC-MS analysis
The liquid chromatography separations for cross-linked peptides are similar to those used in typical proteomics experiments—mainly C18 or other reversed-phase separations. The separation can occur concurrently with the MS measurement (online) or before the MS measurement (offline). A wide variety of mass spectrometric instrumentation and methods have been used for XL-MS. Recent successful XL-MS studies use in combination: 1) selection of high-charge state precursor ions for fragmentation; 2) high resolution mass measurements of precursors; and 3) either high resolution measurements of fragmentation spectra or the use of CID-cleavable cross-linkers combined with an appropriate multistage tandem MS data acquisition scheme, such as the real-time analysis for cross-linked peptide technology (ReACT) method of Weisbrod et al. [37] (Figure 2A). In mass spectrometry parlance, the initial mass measurement or precursor scan is called MS1, selection and fragmentation of a single precursor ion scan is called tandem mass spectrometry, MS/MS or MS2, and subsequent rounds of selection and fragmentation are called multistage tandem mass spectrometry or MS3, etc. High resolution MS1 scans are essential for XL-MS, because the high-resolution mass spectrum allows for determination of the charge state of the peptide, allowing low-charge species to be ignored, and because the accompanying mass accuracy dramatically limits the number of potential precursors that must be considered in database searching. The large size and high charge states of cross-linked peptides mean that a very large number of fragments could potentially be observed in MS2 spectra (fragments may occur in every charge state up to the charge state of the precursor). High resolution MS2 data allow determination of fragment ion charge states and accurate masses, greatly increasing confidence in the identifications. For methods that use CID-cleavable linkers and a multistage data acquisition scheme (Figure 2A), high resolution MS2 spectra, arising from fragmentation of the linker only, are critical for confirming the mass relationships. However, in this strategy, MS3 spectra are simply fragmentation spectra of individual peptides and do not require high resolution measurements.
Figure 2.
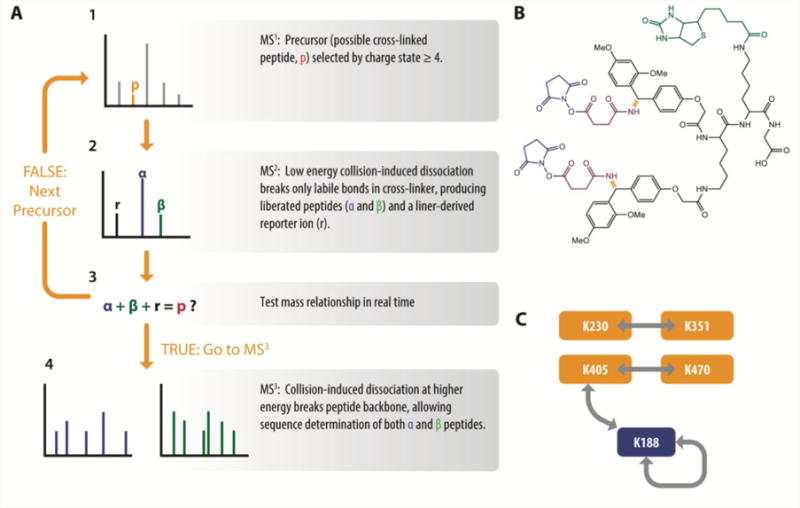
Cross-linking the tomato leaf roll virus capsid with protein interaction reporter (PIR)/real-time analysis for cross-linked peptide technology (ReACT) technology. A, The PIR multistage data acquisition strategy. (1) A potential cross-linked peptide (p) is identified in a high-resolution MS1 scan by its high charge state. (2) MS/MS at low energy causes the labile bonds of the PIR reagent (shown in red in B) to break, yielding a reporter ion (r) and the two separated component peptides (α and β), each modified by a linker-derived “stump” (magenta in B). (3) If the masses of the α and β and r fragments add up to the mass of p observed in (2), then the instrument control software triggers two MS3 scans (one each for α and β) at higher energy to fragment the peptide backbones (4). Sequences of the component peptides are determined by database searching using standard proteomics software tools such as Sequest or Mascot. If the mass relationship is not satisfied within a tight mass tolerance, the next precursor ion is selected or the next MS1 scan is acquired (1). B, The biotinylated Rink (BRink) PIR reagent. Blue, NHS-ester leaving groups; green, biotin affinity label; orange, mass spectrometry cleavable bonds; green and black; reporter ion fragment; magenta, the “stump” atoms that remain attached to the peptides after MS2. C, Network of cross-linking sites observed in the virus capsid. Orange, read-through protein; blue, coat protein.
Data Analysis: Identifying Cross-Linked Peptides
Numerous software applications have been developed to assist in identifying cross-linked peptides from mass spectrometric data (reviewed in [18, 21, 38]). All are elaborations of the basic approach that is well established in the proteomics field: matching the spectrum of a candidate cross-linked peptide to a theoretical spectrum derived from a sequence database and providing a score for the quality of the match [39]. The differences among the various algorithms are mainly in the way that the match is scored and in the size of the sequence database (i.e., one or few small proteins as opposed to a proteome) that can be effectively searched. The programs that are suited to large sequence databases include xQuest [38, 40], pLinks [41], and the updated ReACT/X-links program [32, 37, 42] for cleavable cross-linkers.
Historically, many of these programs have been used primarily by the research groups in which they were developed. However, some recent studies have published direct comparisons of the analysis of the same XL-MS datasets with several different programs [43, 44]. These studies, as well as our own evaluations (unpublished), show that for small datasets (i.e., one or a few proteins) each software package generally identifies the same cross-linked peptides, with differences mostly due to differing default parameters. However, as mentioned, not all software packages can deal with large sequence databases.
One of the greatest informatics challenges in XL-MS is judging the confidence of a cross-linked peptide-spectrum match [12]. Traditional proteomics accomplishes this by estimating the false discovery rate (FDR) [45], which is simply the proportion of matches expected to be false at a given score threshold. FDR is estimated by the target-decoy approach (reviewed in [46]). In this procedure, the target sequences are the sequences expected to be present in the sample. The decoy sequences are sequences known not to be present in the sample, often reversed or randomized target protein sequences. The FDR is estimated as the percentage of sequences meeting the score criteria that are decoys. Several XL-MS studies have reported an FDR estimate [27, 42, 47-49]; however, this has not been done consistently. In an important recent advance, Walzthoeni et al. [38] and Yang et al. [41] have shown how to calculate a modified FDR estimate which accounts for hybrid target-decoy matches, in which one arm of the cross-linked peptide is a target sequence and one is a decoy. We anticipate that an FDR estimate that accounts for hybrid target-decoy matches will become as much of a strong requirement for XL-MS studies as standard FDR calculations are for proteomics.
Pathways to successful XL-MS applications
Here we present several examples of XL-MS relevant to current problems in structural biology, each of which illustrates a unique combination of methods (i.e., a path through the methodological maze) that can lead to successful identification of cross-linked peptides. These examples are by no means exhaustive; rather, they were selected to illustrate the range of methods available, the types of problems that can be addressed, and the utility of XL-MS in structural biology.
Example 1: Cross-linking virus capsids with the Protein Interaction Reporter approach
Our first example illustrates XL-MS analysis of the potato leaf roll virus (PLRV) capsid by the Bruce laboratory [32], using the Protein Interaction Reporter approach. PLRV belongs to the luteovirus family, and is transmitted to plants via an aphid vector. Prior to this study, essentially no experimental structural information was available for PLRV, except for knowledge of the icosahedral symmetry and T=3 quasi-equivalence of the capsid. The capsid is thought to contain 180 copies of the coat protein (CP), with a small fraction of the CP molecules replaces by the read-through protein (RTP) which consist of the coat protein plus a long C-terminal region predicted to be disordered. A homology model had previously been generated using the CP crystal structure from another virus [50], but the cross-linking results were the first experimental molecular-level structural information obtained for PLRV.
Custom cross-linking reagents called protein interaction reporters (PIRs) were introduced by the Bruce laboratory in 2005 [51]. Several variant linkers have been described [52, 53], including the cross-linker known as BRink ([53], Figure 2B), which contains two NHS esters as the lysine-reactive groups, a biotin moiety for enrichment, and two CID cleavable bonds. Tryptic cross-linked peptides enriched by SCX fractionation and immobilized avidin affinity chromatography were analyzed by LC-MS using the CID-cleavable multistage strategy (Figure 2A). In this approach, the identification of a cross-linked peptide depends on the mass relationship between the precursor, the cross-linker-derived reporter ion fragment, and the two released cross-link peptides. Using high-resolution instrumentation (Fourier transform-ion cyclotron resonance MS) allows the mass relationships to be determined with high accuracy, increasing the confidence of the identification. Another great strength of this approach is that the sequences of the individual peptides in the cross-link can be identified using straightforward and well established database search methods (e.g., Sequest [54] or Mascot [55]), avoiding the complexities associated with cross-linked peptide database searches. The programs X-links [42] and BLinks [47] were developed to detect these mass relationships in the LC-MS data. Importantly, the recently reported ReACT method [37], implements the algorithm of X-links in real-time by integrating analysis of the PIR mass relationships and instrument control during the LC-MS experiment. If no PIR mass relationship is detected in an MS2 spectrum as evaluated in real time during the measurement, no MS3 is performed and a new MS1 or MS2 spectrum is acquired instead. This method focuses the analysis on probable cross-linked peptides, improving the instrument duty cycle, and increasing the number of cross-linked peptides that can be detected, partially overcoming lower relative abundance of cross-linked species.
In a single LC-MS experiment, Bruce and coworkers collected ninety-two sets of MS1+MS2 spectra that satisfied the PIR mass relationship. For some of these mass relationships, satisfactory identifications from MS3 could only be obtained for one of the released peptides. The sets of MS1+MS2 spectra that could be completely identified all belonged to four unique cross-linked peptides, each detected multiple times. MS3 sequencing revealed that these four cross-linked peptides arose from modifications at five different sites: K188, K230, K351, K405, and K470, according to the network shown in Figure 2C. A symmetrical cross-linked peptide containing K188 was derived from an intermolecular interaction, indicating that K188 is a point of contact between CP monomers. Cross-links from K405 to both K430 and K188 were observed, suggesting that both K188 and K430 are in proximity to K405 in the structure, or that two conformations of the RTP structure were observed.
Bruce and coworkers built a structural model of the PLRV CP monomer [32] using Phyre2 [56]. Since the expected symmetry of the icosahedral capsid includes a three-fold axis, the CP monomer model was then used to create a trimer model using Symmdock [57], which uses a shape-complementarity-based rigid-body docking algorithm guided by cyclic symmetry arrangements. Inclusion of a constraint derived from the K188-K188 “homodimer” cross-linked peptide reduced the number of candidate structures generated by Symmdock from > 1780 to just four. The top-scoring model was similar to known viral coat protein structures from T3 viruses. No confident models of the RTP could be produced, which is unsurprising since the RTP is predicted not to contain regular secondary structure. Thus, the K230-K351, K405-K450, and K188-K450 cross-links could not be directly used as distance constraints during modeling. However, the CP trimer model does place K188 in a surface position, accessible to cross-linking from K405. Furthermore, all of the cross-linking sites are adjacent to the sites of known mutation sites with virus transmission and/or infection phenotypes, which supports the physiological relevance of the observed cross-links.
Several features of this study are illustrative of the information available from XL-MS. First, only four cross-links were conclusively identified. This could be due to the difficulty detecting and identifying the cross-linked peptides, or to the structure of the protein complex itself. The number of lysine residue pairs (the BRink reagent is a lysine-selective NHS ester) closer than the linker length, their solvent accessibility, and variations in their reactivity (pKa) caused by local electrostatic effects [58] all influence the likelihood of cross-linking occurring at a given site. In studies of proteins with known structure, the number of cross-links observed is typically far lower than the number of lysine residues potentially within the range of the cross-linker [21, 30, 59]. Therefore, no conclusions should be drawn based on the absence of evidence for cross-linking at a given site. Second, this study illustrates the power of even a single experimental restraint in evaluating computational models. While restraints such as cross-links do not guarantee the accuracy of a computational model, they do dramatically decrease the search space, thus grounding the model in experimental data and improving outcomes [10]. Third, cross-links provide the most useful information when they can synergize with other types of data, whether theoretical or experimental. The K188-K188 cross-link could be used as a distance restraint because homology modeling was successful for the CP protein.
Example 2: Distinguishing intermolecular from intramolecular interactions in homomultimeric complexes
Many protein complexes are either homomultimers or contain multiple copies of a particular protein or proteins. Our second example highlights an approach to distinguish between inter-protein and intra-protein cross-links from a homomultimer. The cross-linking strategies described so far in this review are not capable of making this distinction unless the sequences of the two peptides are identical or overlapping, which decreases the quaternary structural information inherent in a given cross-link. Thus far, the mixed isotope cross-linking (MIX) is the only reported method that can distinguish inter-molecular from intra-molecular cross-links (Figure 3A). First described by Taverner et al. [60] and used in a limited number of other published studies [17, 48, 61], this method uses isotopically labeled proteins. Specifically, normal isotopic abundance (“light”) and uniformly heavy-isotope labeled (“heavy”) multimeric proteins are mixed in a 1:1 ratio and allowed to equilibrate such that mixed heavy/light complexes are formed. These mixed heavy/light complexes are cross-linked, enyzmatically digested to create peptides, and analyzed by mass spectrometry. Intramolecular cross-linked peptides appear as doublet peaks (light and heavy) in the mass spectrum. Intermolecular cross-links, however, appear as quadruplets of peaks (Figure 3A), because four forms of the intermolecular cross-linked peptide exist (i.e., all light, all heavy, and two mixed light/heavy versions).
Figure 3.
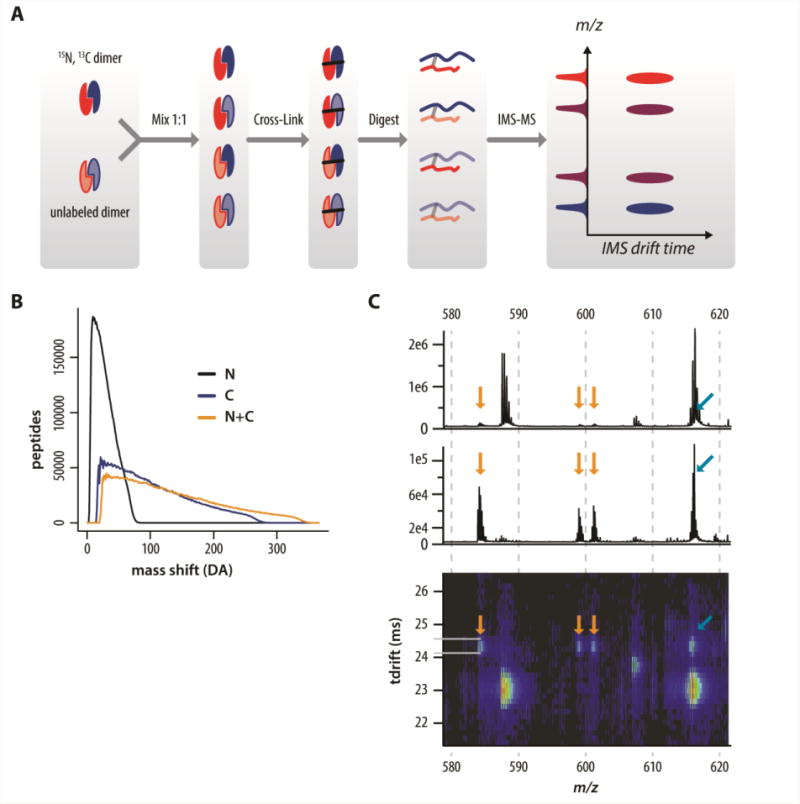
Mixed isotope cross-linking (MIX) combined with ion mobility spectroscopy (IMS). A, schematic of the MIX-IMS process showing the quadruplets in the m/z dimension. B, histograms of the predicted MIX mass shift values for tryptic peptides from an in silico digest of the human proteome labeled with 15N, 13C, or both. Carbon plus nitrogen has the broadest and flattest distribution; thus, the MIX mass shift from 13C+15N labeling provides the most powerful constraint on sequence identification. For simple samples (a few proteins), the mass shift combined with the accurate mass can provide unique or nearly unique identifications. C, MIX-IMS-MS data for a cross-linked peptide, showing the characteristic quadruplet pattern, and illustrating the advantages of IMS separation. Top, mass spectrum averaged across the entire drift time range; middle, mass spectrum averaged across the drift time range indicated by the yellow lines; bottom, ion-mobility-mass spectrum. Using MS alone, the heaviest peak of the quadruplet (arising from the cross-linked peptide with both arms heavy-isotope labeled), is obscured by an unrelated interfering peak. When IMS-MS is used, the interference is separated from the cross-linked peptide signal in the drift time dimension, allowing recognition of the quadruplet pattern and identification of the peptide. Data from reference [47].
This method has been used to identify intermolecular cross-links in dimeric interleukin-6 [60], HIV integrase [61], and Hsp21, a small oligomeric chaperone [17]. The three intermolecular cross-linked peptides detected in the interleukin-6 study revealed that the dimer is formed by three-dimensional domain swapping via exchange of alpha helices D and E. Knowledge of the intermolecular nature of these cross-links peptides was essential to ruling out other potential modes of domain swapping [60]. The case of Hsp21 [60], which forms dodecamers consisting of 6 dimers, is more complicated, since the nine detected intermolecular cross-links could arise from within-dimer interactions, or from interactions between adjacent dimers in the dodecamer. A cross-link spanning a distance that was evidently too large for the dimer was attributed to an interaction between adjacent dimers in the dodecamer.
Two recent improvements to the MIX method [48] include the use of uniform 13C,15N double-labeled proteins as the heavy component of the mixed complexes and the addition of ion mobility spectrometry to the LC-MS platform to enhance analysis of the cross-linked peptides. Note that other reported studies used only uniform 15N labeling. The double label has the advantage that the size of the mass shift between the peaks of the multiplet is highly specific with respect to amino acid composition. The mass shifts are determined by the number of incorporated heavy atoms. The number of nitrogen atoms per amino acid residue is relatively constant across the 20 common amino acids. The number of carbon atoms is much less degenerate, and the number of carbon plus nitrogen residues is even more unique (Figure 3B), which means that by using the accurate mass and mass shift values, and a priori knowledge of the sequence of the protein under study (as long as it is not too large), one can infer the sequence of cross-linked peptides without MS/MS measurements.
Ion mobility spectrometry is a gas-phase separation technique that separates analyte ions by their mobility (drift time) as they migrate through an inert carrier gas under the influence of an electric field [62]. By coupling this separation technique with LC- MS, a two-dimensional ion-mobility/mass spectrum can be obtained for every time point during the LC elution. Heavy isotope labeling does not affect drift time, so the quadruplet signals of intermolecular cross-links align in the drift time dimension (Figure 3A). This property allows unambiguous assignment of signals belonging to a true quadruplet, as opposed to a pair of doublets, which could have the same appearance in a conventional mass spectrum. The use of an ion mobility separation has increased the number of cross-links detected and decreased the false discovery rate for cross-linked peptides. The greatest challenge of this approach is equilibration of the heavy and light subunits into mixed complexes [63]. Some small dimeric proteins exchange quickly with simple mixing. Others researchers have used organic solvents [60] or heat [17] to promote mixing of the heavy and light subunits.
Example 3: Computational modeling of affinity-purified protein phosphatase complex with distance constraints from XL-MS
Our final example is an extensive cross-linking and modeling study of human protein phosphatase 2A (PP2A) and several of its binding partners by Aebersold and coworkers [30]. PP2A holoenzymes are heterotrimers containing a catalytic A subunit, a scaffold C subunit, and one of ∼18 regulatory B subunits [64]. The various B subunits direct the catalytic activity to specific substrates involved in several important biological pathways. Thus, protein-protein interactions play a key role in PP2A function. To investigate the structural features of PP2A interactions, Aebersold and coworkers combined XL-MS with a powerful method for identifying protein interaction networks, affinity purification-mass spectrometry (AP-MS, [65]). In AP-MS, an affinity-tagged protein (known as the bait protein) is purified under conditions that preserve native protein-protein interactions (complexes). Often, tandem affinity tags are used (as in this example) to provide the requisite specificity under native conditions. Proteins in the tagged complex are then identified by proteomics methods. The interactions identified can be either direct or indirect [66]. By combining AP-MS with XL-MS, Aebersold and coworkers not only identified direct interactions, but elucidated structural details that could be used to predict binding interfaces and, in some cases, to create detailed atomic models.
The experimental approach involved a first round of AP-MS without cross-linking to generate a map of protein-protein interactions. Target bait proteins for cross-linking AP-MS studies were chosen from this map. In the second set of experiments, cross-linking was introduced into the AP-MS workflow. While bound to the stationary phase of the second affinity purification step (nickel-NTA in this case), the tagged protein complexes were treated with the cross-linker disuccinimidyl suberate (DSS) as a 1:1 mixture of isotopically heavy (deuterated, d12) and light (d0) forms. Lysyl endopeptidase (LysC) digestion was also performed directly on the beads. Peptides were fractionated by SEC to enrich for cross-linked peptides. LC-MS/MS data were searched with xQuest [21, 40] using a database containing only proteins identified in the initial AP-MS experiment.
While several protein-protein interactions were characterized in the PP2A study, we will review just the complex between the catalytic A subunit of PP2A (PP2AA) and the regulatory subunit immunoglobulin binding protein 1 (IGBP1). This interaction was confirmed by the detection of several cross-linked peptides. The structure of PP2AA was already known from crystallography (PDB codes 3fga and 3dw8 [67, 68]). There is no structure of human IGBP1, but there is a crystal structure of the N-terminal domain of the mouse homologue (3qc1). Full-length human IGBP1 was modeled with ROSETTA [69-71] using the mouse protein as a template and the observed cross-links as distance restraints. The homology modeling procedure failed to converge to a single fold; however, filtering by agreement with the XL-MS cross-links reduced the ensemble of models from 150,000 to 190. All 190 IGBP1 models were then used in ROSETTA docking protocols [69-71] with the known structure of PP2AA, in order to model the PP2AA-IGBP1 interface. The ROSETTA docking energy function was supplemented by distance restraints derived from the seven observed intermolecular cross-linked peptides. Resulting models were also filtered by the agreement between the distances between cross-linking sites in the models and the theoretical maximum distance. Residues K163 and E37 were present in the modeled interface in 95% of the models. Binding assays with point mutants at these residues of PP2AA and the predicted neighbor residue R155 of IGBP1 resulted in decreased or abrogated binding, thus verifying the predictions of cross-linking-guided modeling.
This example clearly illustrates both the power and the limitations of combining experimental distance restraints and computational modeling. The procedure was unable to create an atomic-resolution structural model of the complex, because the structure of one of the binding partners (IGBP1) could not be modeled successfully, despite numerous XL-MS distance restraints and the structure of a close homologue. (Note that complete atomic models for other PP2A complexes were created using XL-MS restraints and described in the same study.) Still, the binding interface was correctly identified and experimentally validated by site-directed mutagenesis of predicted interface residues and coimmunoprecipitation/immunoblotting [30]. Independent docking calculations without any experimental cross-linking data identified a binding site on the opposite side of the protein, demonstrating the critical importance of the XL-MS derived distance restraints. Neither XL-MS nor hybrid modeling is a structure determination technique, and it is reasonable that computational models be viewed with a certain degree of circumspection. However, the incorporation of experimental data such as cross-links from XL-MS can improve confidence in computational models, as well as generate hypotheses about protein complex architectures that can be experimentally tested.
Applicability and Limitations of XL-MS
The preceding examples have demonstrated the utility of XL-MS in identifying interacting proteins, in providing residue-level structural information on protein complexes, and in providing structural restraints for molecular modeling. Indeed, the major role of XL-MS as a method in structural biology is in the elucidation of the quaternary structures of protein complexes in, particularly those that are refractory to crystallization due to size, heterogeneity, integral membrane proteins, protein flexibility, or instability. XL-MS has also been used to determine the fold family of a protein growth factor in combination with homology modeling [19], to identify two distinct binding poses of the peptide melittin in a melittin-calcium-calmodulin complex [72], to identify a complex of membrane-associated bacterial c-type cytochromes [73], to identify the binding interface in a transient, metal –dependent binary protein complex [74], and to rank binding affinities of a proteins and a series of peptide ligands [76], and even to study protein-protein interactions in live cells [31].
The benefits of XL-MS are maximized when it is combined with one or more additional structural techniques. Recently, Schneidman-Duhovny and others [10]evaluated the contribution of five types of low-resolution structural data (small-angle x-ray scattering, two-dimensional class average images and three-dimensional density maps from cryoelectron microscopy, information about residue types at the interface based on NMR spectroscopy, and XL-MS)on protein docking with a benchmark data set. They found that including any of these types of data led to higher success rates than standard docking alone, and that XL-MS compared favorably to the other methods studied, at least up to complexes as large as 675 total amino acids. Furthermore, when the different data types were used in combination, inclusion of XL-MS data was found to improve the success rate of all other data types, showing that XL-MS provides a unique type of data that is complementary to other structural techniques.
XL-MS is not without limitations, which include the need for access to high-resolution mass spectrometry instrumentation, and the need for expert data analysis and interpretation. In addition, the difficulty of an XL-MS analysis increases with the sample complexity, which is a function of the size and heterogeneity of the protein complex studied. XL-MS analysis of small homodimeric complexes (≤ 100 residues/monomer) should be possible without any enrichment procedure. Much larger protein complexes can be studied if a protocol involving enrichment of cross-linked peptides is used. In general, if a protein complex can be isolated with a degree of purity similar to that needed for other biophysical methods, XL-MS analysis should be feasible, although Example 3 above demonstrated that immunoprecipitated complexes can also be analyzed with state-of-the art methodology.
Conclusion: Which path to take?
The XL-MS examples above all used unique combinations of methods to successfully navigate the inherent complexities of XL-MS—each to good effect. Several common elements in successful approaches are already emerging, such as the need for high-resolution MS, the use of an effective enrichment strategy to increase the number of cross-linked peptides detected, and an advanced informatics tool. Another key feature apparent in the examples is internal consistency. Figure 1 may give the impression that the XL-MS workflow is modular, but in truth the success of one step depends on the choices made in other steps. For instance, the PIR data analysis approach only works with PIR MS-cleavable cross-linkers. Similarly, the effectiveness of SEC for enrichment of cross-linked peptides is enhanced by digesting with LysC instead of trypsin, because LysC generates longer peptides, and so forth.
Rather than a single gold standard methodology, we anticipate that the rapidly maturing XL-MS field will converge on a small number of consensus methods with demonstrated records of success, becoming less like a maze and more like a supermarket, with a small number of “off-the-shelf” protocols that are effective and ready to implement.
One such emerging consensus approach, and our subjective recommendation as a starting point for researchers seeking to initiate XL-MS studies for structural biology, combines the following features: the water soluble NHS-ester cross-linker BS3 (optionally as a mix of heavy/light isotopic versions), trypsin digestion, enrichment of cross-linked peptides by SCX chromatography, any standard high-resolution peptide reverse-phase LC separation, and high resolution mass spectrometry for both MS1 and MS2, with MS2 analysis limited to peptides of charge greater than +2. Data acquired in this manner can easily be analyzed with xQuest [38, 40] or pLinks [41], or, if the total sequence length of all proteins in the analyzed sample is small, with almost any dedicated XL-MS software [18]. This workflow is similar that described by Yang et al. [41], and also resembles the later steps of the workflow described in Example 3 above and shown in Figure 4[30]. For protein complexes containing several copies of the same subunit, it may be helpful to combine this workflow with some variation of the MIX isotope labeling approach in order to identify interprotein interactions.
Figure 4.
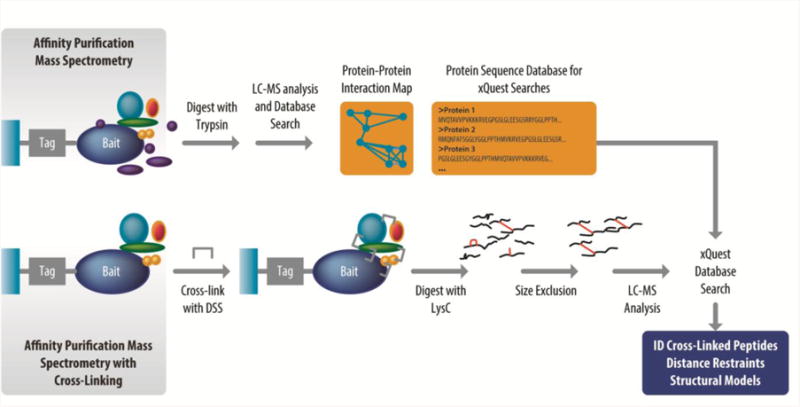
Integration of affinity-purification mass spectrometry (AP-MS) and cross-linking mass spectrometry (XL-MS). Tandem affinity tagged bait proteins are expressed in cell lines and isolated by tandem affinity purification, along with interacting proteins. These protein complexes are then digested and analyzed by mass spectrometry (the traditional AP-MS) approach. These data are used both to generate an interaction map, and to create a list of proteins that will be used as the database in searching for cross-linked peptides. In a parallel set of experiments, isolated protein complexes are cross-linked and proteolytically digested while bound to the stationary phase of the second affinity chromatography step, cross-linked peptides are enriched by size exclusion chromatography, and analyzed by LC-MS. The data is searched with xQuest [40], specialized software for cross-linked peptides, and identified cross-links serve as distance restraints in structural modeling.
Methods using CID cleavable reagents, such as ReACT (Example 1 above), are probably the best available methods for studies involving very complex samples, such as live cells [31, 37], because breaking the cross-link in the mass spectrometer means that the peptide identification search space is proportional to the sequence length, rather than the square of the sequence length as for cross-linked peptide fragmentation spectra. However, neither the reagents nor the instrument control and data analysis software tools for these approaches are widely available at this time.
While the challenges facing XL-MS analysis are significant, the examples discussed in this review clearly demonstrate that XL-MS can be a useful tool to aid in the development of structural models for protein-protein interactions. XL-MS is poised to become a routine component of the structural biology toolbox. If this vision is realized, significant new structural and biological insights are likely to follow.
Acknowledgments
This research was funded by the National Institute of General Medical Sciences PSI:Biology project (NIGMS grant GM094623). Portions of this work were performed in the Environmental Molecular Science Laboratory, a U.S. Department of Energy/BER national scientific user facility at Pacific Northwest National Laboratory in Richland, WA. The authors would like to thank Nathan Johnson for assistance in preparing the figures, and Penny Colton, Michael Daily, and Gyorgy Babnigg for reviewing the manuscript in advance of publication.
Abbreviations
- AP-MS
Affinity purification-mass spectrometry
- BS3
bis[sulfosuccinimidyl]suberate
- CID
Collision-induced dissociation
- CP
PLRV coat protein
- DSS
disuccinimidyl suberate
- FDR
False discovery rate
- IGBP1
Immunoglobulin binding protein 1
- IMS
Ion mobility spectrometry
- LC
Liquid chromatography
- MIX
Mixed-isotope cross-linking
- MS
Mass spectrometry
- MS1
Precursor scan in a mass spectrometry experiment
- MS2
Tandem mass spectrometry (MS/MS) scan in a mass spectrometry experiment that yields a fragmentation spectrum of a precursor selected in MS1
- MS3
Third-order tandem mass spectrometry (MS/MS/MS) scan that yields a fragmentation spectrum of an MS2-derived fragment ion
- NHS
N-hydroxysuccinimide
- NMR
Nuclear magnetic resonance spectroscopy
- PLRV
Potato leaf roll virus
- PP2A
Protein phosphatase 2A
- PP2AA
A subunit of protein phosphatase 2A
- ReACT
Real-time analysis for cross-linked peptide technology
- RTP
PLRV read-through protein
- SCX
Strong cation exchange chromatography
- SDS-PAGE
Sodium dodecylsulfate polyacrylamide gel electrophoresis
- SEC
Size exclusion exchange chromatography
- XL-MS
Chemical cross-linking-mass spectrometry
References
- 1.Ward AB, Sali A, Wilson IA. Science. 2013;339:913–915. doi: 10.1126/science.1228565. [DOI] [PMC free article] [PubMed] [Google Scholar]
- 2.Lipfert J, Doniach S. Annual Review of Biophysics and Biomolecular Structure. Vol. 36. Annual Review of Biophysics. Annual Reviews; Palo Alto: 2007. Small-angle X-ray scattering from RNA, proteins, and protein complexes; pp. 307–327. [DOI] [PubMed] [Google Scholar]
- 3.Subramaniam S, Milne JLS. Annu Rev Biophys Biomol Struct. 2004;33:141–155. doi: 10.1146/annurev.biophys.33.110502.140339. [DOI] [PubMed] [Google Scholar]
- 4.Jore MM, Lundgren M, van Duijn E, Bultema JB, Westra ER, Waghmare SP, Wiedenheft B, Pul Ü, Wurm R, Wagner R, Beijer MR, Barendregt A, Zhou K, Snijders APL, Dickman MJ, Doudna JA, Boekema EJ, Heck AJR, van der Oost J, Brouns SJJ. Nat Struct Mol Biol. 2011;18:529–536. doi: 10.1038/nsmb.2019. [DOI] [PubMed] [Google Scholar]
- 5.Lebowitz J, Lewis MS, Schuck P. Protein Sci. 2002;11:2067–2079. doi: 10.1110/ps.0207702. [DOI] [PMC free article] [PubMed] [Google Scholar]
- 6.Hyung SJ, Ruotolo BT. Proteomics. 2012;12:1547–1564. doi: 10.1002/pmic.201100520. [DOI] [PMC free article] [PubMed] [Google Scholar]
- 7.Mendoza VL, Vachet RW. Mass Spectrometry Reviews. 2009;28:785–815. doi: 10.1002/mas.20203. [DOI] [PMC free article] [PubMed] [Google Scholar]
- 8.Ruotolo BT, Benesch JLP, Sandercock AM, Hyung SJ, Robinson CV. Nat Protocols. 2008;3:1139–1152. doi: 10.1038/nprot.2008.78. [DOI] [PubMed] [Google Scholar]
- 9.Sharon M, Robinson CV. Annual Review of Biochemistry. Vol. 76. Annual Review of Biochemistry, Annual Reviews; Palo Alto: 2007. The role of mass Spectrometry in structure elucidation of dynamic protein complexes; pp. 167–193. [DOI] [PubMed] [Google Scholar]
- 10.Schneidman-Duhovny D, Rossi A, Avila-Sakar A, Kim SJ, Velázquez-Muriel J, Strop P, Liang H, Krukenberg KA, Liao M, Kim HM, Sobhanifar S, Dötsch V, Rajpal A, Pons J, Agard DA, Cheng Y, Sali A. Bioinformatics. 2012;28:3282–3289. doi: 10.1093/bioinformatics/bts628. [DOI] [PMC free article] [PubMed] [Google Scholar]
- 11.Lasker K, Forster F, Bohn S, Walzthoeni T, Villa E, Unverdorben P, Beck F, Aebersold R, Sali A, Baumeister W. Proc Natl Acad Sci U S A. 2012;109:1380–1387. doi: 10.1073/pnas.1120559109. [DOI] [PMC free article] [PubMed] [Google Scholar]
- 12.Rappsilber J. J Struct Biol. 2011;173:530–540. doi: 10.1016/j.jsb.2010.10.014. [DOI] [PMC free article] [PubMed] [Google Scholar]
- 13.Sinz A. Mass Spectrometry Reviews. 2006;25:663–682. doi: 10.1002/mas.20082. [DOI] [PubMed] [Google Scholar]
- 14.Fabris D, Yu ET. J Mass Spectrom. 2010;45:841–860. doi: 10.1002/jms.1762. [DOI] [PMC free article] [PubMed] [Google Scholar]
- 15.Singh P, Panchaud A, Goodlett DR. Anal Chem. 2010;82:2636–2642. doi: 10.1021/ac1000724. [DOI] [PubMed] [Google Scholar]
- 16.Miteva YV, Budayeva HG, Cristea IM. Anal Chem. 2012;85:749–768. doi: 10.1021/ac3033257. [DOI] [PMC free article] [PubMed] [Google Scholar]
- 17.Soderberg CAG, Lambert W, Kjellstrom S, Wiegandt A, Wulff RP, Mansson C, Rutsdottir G, Emanuelsson C. PLoS One. 2012;7:e38927. doi: 10.1371/journal.pone.0038927). [DOI] [PMC free article] [PubMed] [Google Scholar]
- 18.Mayne SLN, Patterton H-G. Brief Bioinform. 2011;12:660–671. doi: 10.1093/bib/bbq087. [DOI] [PubMed] [Google Scholar]
- 19.Young MM, Tang N, Hempel JC, Oshiro CM, Taylor EW, Kuntz ID, Gibson BW, Dollinger G. Proc Natl Acad Sci U S A. 2000;97:5802–5806. doi: 10.1073/pnas.090099097. [DOI] [PMC free article] [PubMed] [Google Scholar]
- 20.Paramelle D, Miralles G, Subra G, Martinez J. Proteomics. 2013;13:438–456. doi: 10.1002/pmic.201200305. [DOI] [PubMed] [Google Scholar]
- 21.Leitner A, Walzthoeni T, Kahraman A, Herzog F, Rinner O, Beck M, Aebersold R. Mol Cell Proteomics. 2010;9:1634–1649. doi: 10.1074/mcp.R000001-MCP201. [DOI] [PMC free article] [PubMed] [Google Scholar]
- 22.Schilling B, Row RH, Gibson BW, Guo X, Young MM. Journal of the American Society for Mass Spectrometry. 2003;14:834–850. doi: 10.1016/S1044-0305(03)00327-1. [DOI] [PubMed] [Google Scholar]
- 23.Pettelkau J, Schroder T, Ihling CH, Olausson BES, Kolbel K, Lange C, Sinz A. Biochemistry. 2012;51:4932–4949. doi: 10.1021/bi300064v. [DOI] [PubMed] [Google Scholar]
- 24.Leitner A, Reischl R, Walzthoeni T, Herzog F, Bohn S, Förster F, Aebersold R. Mol Cell Proteomics. 2012;11:M111.014126. doi: 10.1074/mcp.M111.014126. [DOI] [PMC free article] [PubMed] [Google Scholar]
- 25.Novak P, Haskins WE, Ayson MJ, Jacobsen RB, Schoeniger JS, Leavell MD, Young MM, Kruppa GH. Anal Chem. 2005;77:5101–5106. doi: 10.1021/ac040194r. [DOI] [PubMed] [Google Scholar]
- 26.Fritzsche R, Ihling CH, Gotze M, Sinz A. Rapid Commun Mass Spectrom. 2012;26:653–658. doi: 10.1002/rcm.6150. [DOI] [PubMed] [Google Scholar]
- 27.Lauber MA, Reilly JP. J Proteome Res. 2011;10:3604–3616. doi: 10.1021/pr200260n. [DOI] [PubMed] [Google Scholar]
- 28.Clifford-Nunn B, Showalter HDH, Andrews PC. Journal of the American Society for Mass Spectrometry. 2012;23:201–212. doi: 10.1007/s13361-011-0288-4. [DOI] [PMC free article] [PubMed] [Google Scholar]
- 29.Lu Y, Tanasova M, Borhan B, Reid GE. Anal Chem. 2008;80:9279–9287. doi: 10.1021/ac801625e. [DOI] [PubMed] [Google Scholar]
- 30.Herzog F, Kahraman A, Boehringer D, Mak R, Bracher A, Walzthoeni T, Leitner A, Beck M, Hartl FU, Ban N, Malmström L, Aebersold R. Science. 2012;337:1348–1352. doi: 10.1126/science.1221483. [DOI] [PubMed] [Google Scholar]
- 31.Zheng CX, Yang L, Hoopmann MR, Eng JK, Tang XT, Weisbrod CR, Bruce JE. Mol Cell Proteomics. 2011;10:M110.006841. doi: 10.1074/mcp.M110.006841. [DOI] [PMC free article] [PubMed] [Google Scholar]
- 32.Chavez JD, Cilia M, Weisbrod CR, Ju HJ, Eng JK, Gray SM, Bruce JE. J Proteome Res. 2012;11:2968–2981. doi: 10.1021/pr300041t. [DOI] [PMC free article] [PubMed] [Google Scholar]
- 33.Petrotchenko EV, Serpa JJ, Borchers CH. Mol Cell Proteomics. 2011;10:M110.001420. doi: 10.1074/mcp.M110.001420). [DOI] [PMC free article] [PubMed] [Google Scholar]
- 34.Sinz A, Kalkhof S, Ihling C. Journal of the American Society for Mass Spectrometry. 2005;16:1921–1931. doi: 10.1016/j.jasms.2005.07.020. [DOI] [PubMed] [Google Scholar]
- 35.Luo J, Fishburn J, Hahn S, Ranish J. Mol Cell Proteomics. 2012;11:M111.008318. doi: 10.1074/mcp.M111.008318. [DOI] [PMC free article] [PubMed] [Google Scholar]
- 36.Chowdhury SM, Du XX, Tolic N, Wu S, Moore RJ, Mayer MU, Smith RD, Adkins JN. Anal Chem. 2009;81:5524–5532. doi: 10.1021/ac900853k. [DOI] [PMC free article] [PubMed] [Google Scholar]
- 37.Weisbrod CR, Chavez JD, Eng JK, Yang L, Zheng C, Bruce JE. J Proteome Res. 2013 doi: 10.1021/pr3011638. [DOI] [PMC free article] [PubMed] [Google Scholar]
- 38.Walzthoeni T, Claassen M, Leitner A, Herzog F, Bohn S, Forster F, Beck M, Aebersold R. Nat Meth. 2012;9:901–903. doi: 10.1038/nmeth.2103. [DOI] [PubMed] [Google Scholar]
- 39.Marcotte EM. Nat Biotech. 2007;25:755–757. doi: 10.1038/nbt0707-755. [DOI] [PubMed] [Google Scholar]
- 40.Rinner O, Seebacher J, Walzthoeni T, Mueller L, Beck M, Schmidt A, Mueller M, Aebersold R. Nat Meth. 2008;5:315–318. doi: 10.1038/nmeth.1192. [DOI] [PMC free article] [PubMed] [Google Scholar]
- 41.Yang B, Wu YJ, Zhu M, Fan SB, Lin J, Zhang K, Li S, Chi H, Li YX, Chen HF, Luo SK, Ding YH, Wang LH, Hao Z, Xiu LY, Chen S, Ye K, He SM, Dong MQ. Nat Meth. 2012;9:904–906. doi: 10.1038/nmeth.2099. [DOI] [PubMed] [Google Scholar]
- 42.Anderson GA, Tolic N, Tang XT, Zheng CX, Bruce JE. J Proteome Res. 2007;6:3412–3421. doi: 10.1021/pr070035z. [DOI] [PMC free article] [PubMed] [Google Scholar]
- 43.Gotze M, Pettelkau J, Schaks S, Bosse K, Ihling CH, Krauth F, Fritzsche R, Kuhn U, Sinz A. Journal of the American Society for Mass Spectrometry. 2012;23:76–87. doi: 10.1007/s13361-011-0261-2. [DOI] [PubMed] [Google Scholar]
- 44.Li W, O'Neill HA, Wysocki VH. Bioinformatics. 2012;28:2548–2550. doi: 10.1093/bioinformatics/bts442. [DOI] [PMC free article] [PubMed] [Google Scholar]
- 45.Storey JD, Tibshirani R. Proc Natl Acad Sci U S A. 2003;100:9440–9445. doi: 10.1073/pnas.1530509100. [DOI] [PMC free article] [PubMed] [Google Scholar]
- 46.Nesvizhskii AI. Journal of Proteomics. 2010;73:2092–2123. doi: 10.1016/j.jprot.2010.08.009. [DOI] [PMC free article] [PubMed] [Google Scholar]
- 47.Hoopmann MR, Weisbrod CR, Bruce JE. J Proteome Res. 2010;9:6323–6333. doi: 10.1021/pr100572u. [DOI] [PMC free article] [PubMed] [Google Scholar]
- 48.Merkley ED, Baker ES, KL C, Orton DJ, Taverner T, Ansong C, Ibrahim YM, Burnet MC, Cort JR, Anderson GA, Smith RD, Adkins JN. J Am Soc Mass Spectrom. 2013;24:444–449. doi: 10.1007/s13361-012-0565-x. [DOI] [PMC free article] [PubMed] [Google Scholar]
- 49.Lee YJ, Lackner LL, Nunnari JM, Phinney BS. J Proteome Res. 2007;6:3908–3917. doi: 10.1021/pr070234i. [DOI] [PubMed] [Google Scholar]
- 50.Lee L, Kaplan IB, Ripoll DR, Liang D, Palukaitis P, Gray SM. J Virol. 2005;79:1207–1214. doi: 10.1128/JVI.79.2.1207-1214.2005. [DOI] [PMC free article] [PubMed] [Google Scholar]
- 51.Tang XT, Munske GR, Siems WF, Bruce JE. Anal Chem. 2005;77:311–318. doi: 10.1021/ac0488762. [DOI] [PubMed] [Google Scholar]
- 52.Chowdhury SM, Munske GR, Tang XT, Bruce JE. Anal Chem. 2006;78:8183–8193. doi: 10.1021/ac060789h. [DOI] [PubMed] [Google Scholar]
- 53.Zhang HZ, Tang XT, Munske GR, Tolic N, Anderson GA, Bruce JE. Mol Cell Proteomics. 2009;8:409–420. doi: 10.1074/mcp.M800232-MCP200. [DOI] [PMC free article] [PubMed] [Google Scholar]
- 54.Eng JK, McCormack AL, Yates JR. Journal of the American Society for Mass Spectrometry. 1994;5:976–989. doi: 10.1016/1044-0305(94)80016-2. [DOI] [PubMed] [Google Scholar]
- 55.Perkins DN, Pappin DJC, Creasy DM, Cottrell JS. Electrophoresis. 1999;20:3551–3567. doi: 10.1002/(SICI)1522-2683(19991201)20:18<3551::AID-ELPS3551>3.0.CO;2-2. [DOI] [PubMed] [Google Scholar]
- 56.Kelley LA, Sternberg MJE. Nat Protocols. 2009;4:363–371. doi: 10.1038/nprot.2009.2. [DOI] [PubMed] [Google Scholar]
- 57.Schneidman-Duhovny D, Inbar Y, Nussinov R, Wolfson HJ. Nucleic Acids Res. 2005;33:W363–W367. doi: 10.1093/nar/gki481. [DOI] [PMC free article] [PubMed] [Google Scholar]
- 58.Guo X, Bandyopadhyay P, Schilling B, Young MM, Fujii N, Aynechi T, Guy RK, Kuntz ID, Gibson BW. Anal Chem. 2008;80:951–960. doi: 10.1021/ac701636w. [DOI] [PubMed] [Google Scholar]
- 59.Kahraman A, Malmström L, Aebersold R. Bioinformatics. 2011;27:2163–2164. doi: 10.1093/bioinformatics/btr348. [DOI] [PMC free article] [PubMed] [Google Scholar]
- 60.Taverner T, Hall NE, O'Hair RAJ, Simpson RJ. J Biol Chem. 2002;277:46487–46492. doi: 10.1074/jbc.M207370200. [DOI] [PubMed] [Google Scholar]
- 61.Guo X, Schilling B, Young M, Medzihradsky M, Kuntz ID, Guy RK, Gibson BW. Using Homobifunctional Crosslinking Reagents with Normal and N-15 Labeled Proteins for the Determination of Protein Tertiary Structure and Protein-Protein Interactions; Annual Conference of the American Society of Mass Spectrometry; Orlando, FL, USA. 2002. [Google Scholar]
- 62.Bohrer BC, Mererbloom SI, Koeniger SL, Hilderbrand AE, Clemmer DE. Biomolecule Analysis by Ion Mobility Spectrometry. Annual Review of Analytical Chemistry; Annual Review of Analytical Chemistry; Annual Reviews, Palo Alto. 2008. pp. 293–327. [DOI] [PMC free article] [PubMed] [Google Scholar]
- 63.Back JW, de Jong L, Muijsers AO, de Koster CG. J Mol Biol. 2003;331:303–313. doi: 10.1016/s0022-2836(03)00721-6. [DOI] [PubMed] [Google Scholar]
- 64.Janssens V, Goris J. Biochem J. 2001;353:417–439. doi: 10.1042/0264-6021:3530417. [DOI] [PMC free article] [PubMed] [Google Scholar]
- 65.Gingras AC, Gstaiger M, Raught B, Aebersold R. Nat Rev Mol Cell Biol. 2007;8:645–654. doi: 10.1038/nrm2208. [DOI] [PubMed] [Google Scholar]
- 66.Gingras AC, Raught B. FEBS Lett. 2012;586:2723–2731. doi: 10.1016/j.febslet.2012.03.065. [DOI] [PMC free article] [PubMed] [Google Scholar]
- 67.Xu Y, Chen Y, Zhang P, Jeffrey PD, Shi Y. Mol Cell. 2008;31:873–885. doi: 10.1016/j.molcel.2008.08.006. [DOI] [PMC free article] [PubMed] [Google Scholar]
- 68.Xu Z, Cetin B, Anger M, Cho US, Helmhart W, Nasmyth K, Xu W. Mol Cell. 2009;35:426–441. doi: 10.1016/j.molcel.2009.06.031. [DOI] [PMC free article] [PubMed] [Google Scholar]
- 69.Leaver-Fay A, Tyka M, Lewis SM, Lange OF, Thompson J, Jacak R, Kaufman K, Renfrew PD, Smith CA, Sheffler W, Davis IW, Cooper S, Treuille A, Mandell DJ, Richter F, Ban YEA, Fleishman SJ, Corn JE, Kim DE, Lyskov S, Berrondo M, Mentzer S, Popovic Z, Havranek JJ, Karanicolas J, Das R, Meiler J, Kortemme T, Gray JJ, Kuhlman B, Baker D, Bradley P. ROSETTA3: AN OBJECT-ORIENTED SOFTWARE SUITE FOR THE SIMULATION AND DESIGN OF MACROMOLECULES. In: Johnson ML, Brand L, editors. Methods in Enzymology, Vol 487: Computer Methods, Pt C Methods in Enzymology. Elsevier Academic Press Inc; San Diego: 2011. pp. 545–574. [DOI] [PMC free article] [PubMed] [Google Scholar]
- 70.Das R, Baker D. Annu Rev Biochem. 2008;77:363–382. doi: 10.1146/annurev.biochem.77.062906.171838. [DOI] [PubMed] [Google Scholar]
- 71.Kaufmann KW, Lemmon GH, DeLuca SL, Sheehan JH, Meiler J. Biochemistry. 2010;49:2987–2998. doi: 10.1021/bi902153g. [DOI] [PMC free article] [PubMed] [Google Scholar]
- 72.Schulz DM, Ihling C, Clore GM, Sinz A. Biochemistry. 2004;43:4703–4715. doi: 10.1021/bi036149f. [DOI] [PubMed] [Google Scholar]
- 73.Zhang HZ, Tang XT, Munske GR, Zakharova N, Yang L, Zheng CX, Wolff MA, Tolic N, Anderson GA, Shi L, Marshall MJ, Fredrickson JK, Bruce JE. J Proteome Res. 2008;7:1712–1720. doi: 10.1021/pr7007658. [DOI] [PMC free article] [PubMed] [Google Scholar]
- 74.Mealman TD, Bagai I, Singh P, Goodlett DR, Rensing C, Zhou H, Wysocki VH, McEvoy MM. Biochemistry. 2011;50:2559–2566. doi: 10.1021/bi102012j. [DOI] [PMC free article] [PubMed] [Google Scholar]
- 75.Mädler S, Seitz M, Robinson J, Zenobi R. Journal of the American Society for Mass Spectrometry. 2010;21:1775–1783. doi: 10.1016/j.jasms.2010.06.016. [DOI] [PubMed] [Google Scholar]