Abstract
Protein S-acyltransferases (PATs) containing Asp-His-His-Cys within a Cys-rich domain (DHHC-CRD) are polytopic transmembrane proteins that are found in eukaryotic cells and mediate the S-acylation of target proteins. S-acylation is an important secondary and reversible modification that regulates the membrane association, trafficking and function of target proteins. However, little is known about the characteristics of PATs in plants. Here, we identified 804 PATs from 31 species with complete genomes. The analysis of the phylogenetic relationships suggested that all of the PATs fell into 8 groups. In addition, we analysed the phylogeny, genomic organization, chromosome localisation and expression pattern of PATs in Arabidopsis, Oryza sative, Zea mays and Glycine max. The microarray data revealed that PATs genes were expressed in different tissues and during different life stages. The preferential expression of the ZmPATs in specific tissues and the response of Zea mays to treatments with phytohormones and abiotic stress demonstrated that the PATs play roles in plant growth and development as well as in stress responses. Our data provide a useful reference for the identification and functional analysis of the members of this protein family.
Introduction
S-acylation refers to the reversible post-translational attachment of an acyl group to a cysteine residue via a thioester linkage [1], [2]. The most common fatty acid attached to cysteines is palmitate, and S-acylation is often called S-palmitoylation. Other acyl groups with different chain lengths and degrees of unsaturation can also be added to cysteines in a similar manner [3], [4]. S-acylation is one of a group of lipid modifications that occur on eukaryotic proteins [1]. S-acyl modification mainly affects membrane attachment and trafficking of proteins [5], [6]. S-acyl modification is required for the dynamic association of proteins with membrane subdomains and for the cycling between different cellular membranes [7]–[9]. In addition, S-acylation can influence the stability of proteins, modulate the functions of proteins and mediate interactions between different proteins [9], [10].
S-acyl modification of proteins is carried out by S-palmitoyltransferases, referred to as protein acyltransferase (PATs) [1]. Protein acylation was first described over 30 years ago [11], [12], and in the following years, several hundred acylated proteins were identified. However, the identification of PATs was a more recent discovery. The major breakthrough in this area came from seminal work performed in the yeast S. cerevisiae. In 2002, two independent groups identified Akr1 and Erf2 as PATs for the casein kinase Yck2 and the small GTPase Ras2 [13]–[15], respectively. Sequence analyses of the yeast PATs revealed that both Akr1 and Erf2 contain a conserved Asp-His-His-Cys within a Cys-Rich Domain (DHHC-CRD) [16], [17]. This domain was first described in a novel human pancreatic cDNA library clone and a Drosophila open reading frame called DNZ1 [17], [18]. The DHHC-CRD is a 51-amino acid domain and is a variant of the C2H2 zinc finger motif [17]. In addition, mutational analyses revealed that the Cys residue of the DHHC stretch is necessary for auto-acylation and for the modification of target proteins [14], [19]. Therefore, this domain appears to represent the active site of these enzymes.
So far, many proteins containing the DHHC-CRD domain have been identified in eukaryotes, including 7 in yeast, 24 in mice, 23 in humans and 24 in Arabidopsis [20], [21]. Among these DHHC-CRD proteins, 6 in yeast (Akr1, Erf2, Swf1, Pfa3, Pfa4 and Pfa5) [13], [15], [20], [22]–[24], 16 in mammals (DHHC2–9, 12, 15, 17–21 and 22) and 2 in Arabidopsis have already been confirmed to be PATs [20], [25], [26]. Therefore, it is currently thought that all DHHC-domain-containing proteins may function as S-acyltransferases.
In plants, only two PATs have been characterised in detail, TIP1 and PAT10. A screen of Arabidopsis mutants resulted in the identification of TIP GROWTH DEFECTIVE1 (TIP1) (At5g20350), which displays a pleiotropic phenotype with defects in cell expansion, root hair and pollen tube growth and an overall dwarf phenotype [27], [28]. Mapping of the mutant allele revealed that TIP1 encodes a DHHC-CRD-containing protein, and it was shown that this protein is indeed S-acylated [25]. Moreover, TIP1 contains N-terminal ankyrin repeats, related to the yeast PAT Akr1, and it is able to complement the PATs function in the akr1Δ yeast strain, confirming that TIP1 has a PAT function [25]. The other PAT that has been well characterised is PAT10, which is critical for development and salt tolerance in Arabidopsis thaliana [26]. PAT10 regulates the tonoplast localisation of several calcineurin B–like proteins (CBLs), including CBL2, CBL3 and CBL6, whose membrane association also depends on palmitoylation [26]. Loss of PAT10 function resulted in pleiotropic growth defects, including smaller leaves, dwarfism and sterility [26]. In addition, the protein localisations of 24 Arabidopsis PATs were examined last year. Arabidopsis PATs proteins display a complex targeting pattern, and they have been detected in the endoplasmic reticulum, Golgi, endosomes and at the vacuolar membrane [7].
The objective of this study was to identify the complete set of putative S-acyltransferases in plants which the genome sequence is available. With the development of comparative genomics, it is now possible to analyse proteins from the same protein family among different species. Recent draft genome sequences for plants offer the opportunity to investigate the PATs genes of plants using genomes that have only recently been completely sequenced. We first identified 804 putative PAT proteins in 31 species and then analysed the phylogenetic relationships of these proteins. We analysed the structure, chromosome location and expression patterns of PAT genes in Arabidopsis, Oryza sative, Zea mays and Glycine max using bioinformatics data and surveyed the expression patterns of the PATs genes in Zea mays as well as their responses to four phytohormones (6-BA, IAA, SA and ABA) and three abiotic stress mimic treatments (NaCl, PEG and mannitol) using real-time PCR. The results showed that PATs may play important roles in plants growth and development. This study provides a foundation for the cloning and further functional analysis of each member of this protein family.
Materials and Methods
Identification of PAT genes in plants
To identify members of the PAT gene family in plants, we collected the known PAT genes in Arabidopsis and analysed the domains of the PAT peptide sequences using the PFAM search tool [29] and the SMART tool [30]. Two different approaches were then performed. First, all of the known Arabidopsis PAT gene sequences were used as query sequences to perform multiple database searches against proteome and genome files downloaded from the Phytozome database (www.phytozome.net/) [31] and PlantGDB database (www.plantgdb.org/) [32]. Stand-alone versions of BLASTP [33] and TBLASTN (http://blast.ncbi.nlm.nih.gov), which are available from NCBI, were used with an e-value cut-off of 1e-003 [34]. All protein sequences derived from the collected candidate PAT genes were examined using the domain analysis programs PFAM (http://pfam.sanger.ac.uk/) and SMART (http://smart.embl-heidelberg.de/) with the default cut-off parameters. Second, we analysed the domains of all plant peptide sequences using a Hidden Markov Model (HMM) analysis with PFAM searching [35]. We then obtained the sequences with the PF01529 PFAM number that contained a typical DHHC RING domain from the plant genome sequences using a Perl-based script. Finally, all protein sequences were compared with known PAT proteins using ClustalX (http://www.clustal.org/) to verify the sequences that were candidate PAT proteins [36]. The isoelectric points and molecular weights of the PAT proteins were obtained with the help of proteomics and sequence analysis tools on the ExPASy Proteomics Server (http://expasy.org/) [37].
Sequence alignment and phylogenetic analysis of PAT proteins
The PAT protein sequences were aligned using the ClustalX program with BLOSUM30 as the protein weight matrix. The MUSCLE program (version 3.52) was also used to perform multiple sequence alignments to confirm the ClustalX results (http://www.clustal.org/) [38]. Phylogenetic trees of the PAT protein sequences were constructed using the neighbour-joining (NJ) method of the MEGA5 program (http://www.megasoftware.net/) using the p-distance and complete deletion option parameters [39]. The reliability of the obtained trees was tested using a bootstrapping method with 1000 replicates. The images of the phylogenetic trees were drawn using MEGA5.
The chromosomal location and structure of the PAT genes
The chromosomal locations and gene structures were retrieved from the genome data downloaded from the Phytozome database and PlantGDB database. The remaining genes were mapped to the chromosomes using MapDraw [40], and the gene structures of the PAT genes were generated with the GSDS (http://gsds.cbi.pku.edu.cn/) [41].
Expression analyses of the PAT genes using GENEVESTIGATOR
The microarray expression data from various datasets were obtained using Genevestigator (https://www.genevestigator.com/gv/) [42] with the Arabidopsis (ATH1: 22k array), Oryza sativa (OS_51k: Rice Genome 51k array), Zea mays (ZM_84k: Nimblegen Maize 385k) and Glycine max (GM_60k: Soybean Genome Array) Gene Chip platforms. Then, the identified PAT-containing gene IDs were used as query sequences to perform searches in the Gene Chip platform of Genevestigator [42].
Plant material and growth conditions
Qi319 (Zea mays) was used for this study. Unless stated otherwise, the seed germination and plant growth conditions were the same as those described by Ganal et al [43]. The primary root, pericarp, internode, adult leaf, silk, culm, seedling, endosperm, embryo and tassel were collected as described by Kong et al [44]. For the phytohormone treatments and abiotic stress assays, 5-day-old (Zea mays) wild type seedlings were transferred to liquid Murashige and Skoog (MS) medium [45] and supplemented with different treatments (or solvent control) for 6 h with gentle shaking. The aboveground seedlings were used in experiment. All the plant material was frozen in liquid N2 and stored at −80°C.
RNA isolation and real-time PCR
Total RNA was isolated from the frozen tissue using the TRIzol reagent (Invitrogen) following the manufacturer's instructions. The RNA was further purified using a Fermentas RNAeasy mini kit. RNA (1 µg) was used as a template for first strand cDNA synthesis using the SuperScript First-Strand Synthesis system (Transgen). Real-time PCR was performed using gene-specific primers and the UltraSYBR Mixture (With Rox) (CWBio). The 18S ribosomal RNA genes were used as internal normalisation controls [46]. The fold changes in gene expression were calculated using the ΔCt values. To identify preferentially expressed genes, a student t-test was performed. A gene in a given tissue was defined as preferentially expressed only if the expression value of the gene in that tissue was more than 2-fold and had a P value less than 0.05 compared to other tissues. Under the phytohormone and abiotic treatments, the genes that were up or down-regulated more than 1.2-fold and with a P value less than 0.05 compared to the control were considered as differentially expression. The details of the primers used are listed in Table 1.
Table 1. The primers used for real-time PCR of ZmPATs genes in Zea mays.
| Gene | Primers for real-time PCR (5′-3′) |
| ZmPAT2 | Forward: CCTGGTGCAAAGCAAACA |
| Reverse: CAGAGGACCTGGAGGATAGAG | |
| ZmPAT3 | Forward: CGACGACAGCGACCAAAT |
| Reverse: GGCAAGTTCAGATCGGACATAG | |
| ZmPAT4 | Forward: TTCCTCATCATCGCACCA |
| Reverse: CAAAGAAGCAGCGTCAAATC | |
| ZmPAT5 | Forward: GAATCCTTCGTCCTCAGCG |
| Reverse: GATGGCGGGTTCTTCTCAA | |
| ZmPAT6 | Forward: TGCGGGTTACTCGCCTAT |
| Reverse: ATGAGCACGGTGACAAAGAA | |
| ZmPAT8 | Forward: TGGCAATACGGCAAATCC |
| Reverse: GCTATGAAGTGAGGCAATAAAGAG | |
| ZmPAT9 | Forward: TGGGCAGTCGATATTCTTCG |
| Reverse: GCCTGTCCTCGCTTTCTCAC | |
| ZmPAT10 | Forward: ACCCATCCTCCTGAACCTG |
| Reverse: GTCCCATTTACGATAACATCCTTT | |
| ZmPAT11 | Forward: AGCGGGAACCCTTCATTT |
| Reverse: CAAGGTATCCAGCACAGTCTCA | |
| ZmPAT12 | Forward: CAGCAAGCCACTGAGGAA |
| Reverse: AAGGGCGGTTGACATTAGA | |
| ZmPAT14 | Forward: GTGTTGAGCAGTTCGACCA |
| Reverse: ATCCACGATTCTGAAGATGAG | |
| ZmPAT16 | Forward: GGAGGTGCCGCTGGTATA |
| Reverse: CCTTCGCAACTAATGGACAG | |
| ZmPAT17 | Forward: GCCCTTTAGCATTGGCACT |
| Reverse: CCATTTCCGATGTTCCTTGA | |
| ZmPAT18 | Forward: CTACCAGGCTTGGAAGGGAAAC |
| Reverse: ATAGGAAGACAAGGTCCATGATCG | |
| ZmPAT19 | Forward: TTTGCGGAAGTGTTCTTTACC |
| Reverse: TGTTCTGAAGTGCCGTTGG | |
| ZmPAT20 | Forward: GCCTCGCACAAAGGAAGT |
| Reverse: CCAACAGAAGGCAAATACATAGAG | |
| ZmPAT21 | Forward: AAGAGTCCACCCATTCAGTAGAGG |
| Reverse: GCACGTGTAACGAGCAGCTCTA | |
| ZmPAT24 | Forward: CACTGGGTTCCACTCTTATCTT |
| Reverse: GGGTGCCTCATCTTCTCGT | |
| ZmPAT25 | Forward: TTGTTGAAGATGGGTTTGGA |
| Reverse: AGCGGTCGCATGTAGAGC | |
| ZmPAT28 | Forward: AGATTCAGGAACCCGTATGAT |
| Reverse: TGCGAAACCGCTCTTGTC | |
| ZmPAT29 | Forward: CATATTCGGACCTGACGCC |
| Reverse: AAGATGCCGAGCAACGAAT | |
| ZmPAT30 | Forward: AGAAATGTTGCCACTATAAACCTC |
| Reverse: TGTTCGAGAAGAATCGCTGC | |
| ZmPAT31 | Forward: TACTGGACGAGAAAGAAGGC |
| Reverse: TGGGCACTGCTAATGGAG | |
| ZmPAT32 | Forward: TCCTCTGTGAATGTTGGTGGGT |
| Reverse: CCCCTGACGCTTCATACCCA | |
| ZmPAT33 | Forward: GTTGCTCCCATTGCTCTATCT |
| Reverse: TTCTGATCTTAATAATGAACACCC | |
| ZmPAT34 | Forward: CTGCGTTTCAGCATCCTGG |
| Reverse: CTGCTCTAGCCGTTCAGTGTC | |
| ZmPAT35 | Forward: TCTCGGGCTTGTTTCCAC |
| Reverse: ATGATGTAGTCTTGCCATTTGA | |
| ZmPAT36 | Forward: GATGGTTCCCCGCCTCTT |
| Reverse: CCGTCACTCCGATGAACCT | |
| ZmPAT37 | Forward: TGACAAATCCAAGGGTTAGG |
| Reverse: CAATGAAGTGAGGCAATAGAGA | |
| ZmPAT38 | Forward: CTTCGTGGCTGTGCTCGTC |
| Reverse: TGCTACCGTGCAGTGAAATAC | |
| 18S | Forward: GATACCGTCCTAGTCTCAACC |
| Reverse: GCCTTGCGACCATACTCC |
Results
Identification of DHHC-CRD-containing PAT proteins in plants
To identify DHHC-CRD-containing PAT proteins in plants, we first collected the known 24 known PAT from Arabidopsis (Batistic, 2012) and analysed the domains of the PAT peptide sequences using PFAM search tool and SMART tool. Then, we used two different approaches to gather extensive information regarding this family. A total of 804 proteins were identified as potential members of the DHHC-CRD-containing PAT family within the 31 plant genomes that have been completely sequenced (Phytozome database: http://www.phytozome.net/). The presence of the DHHC-CRD domain in all of the protein sequences was confirmed using SMART and PFAM searches. We assigned each of these sequences an identity based on the gene identifier (Table S1).
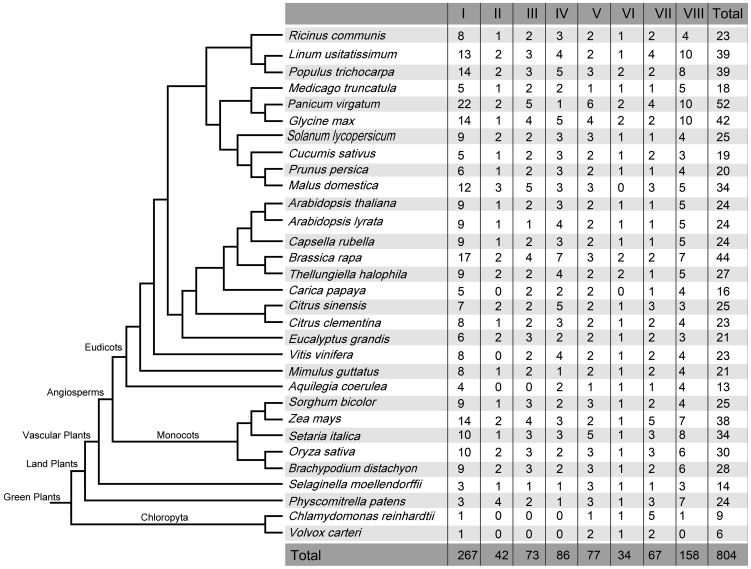
In this study, we observed that all 31 species contained PAT proteins and the number of PATs ranged from 6 (Volvox carteri) to 52 (Panicum virgatum) (Fig. 1). These results suggested that PATs are widely distributed in. Detailed information about the representative PAT proteins is included in Table S1. The protein length of the PATs ranged from 124 aa (BdiPAT26 and MdoPAT19) to 1024 aa (CrePAT3, MdoPAT6, MdoPAT24 and MdoPAT34), and the isoelectric point ranged from 4.82 (CsiPAT17) to 10.41 (SitPAT7) (Table S1).
Figure 1. The phylogenetic relationships among the plants with completely sequenced genomes.
The number in the table corresponds to the number of PAT genes in 8 subgroups and the total number of PATs in each species.
Phylogenetic relationships between the PATs family
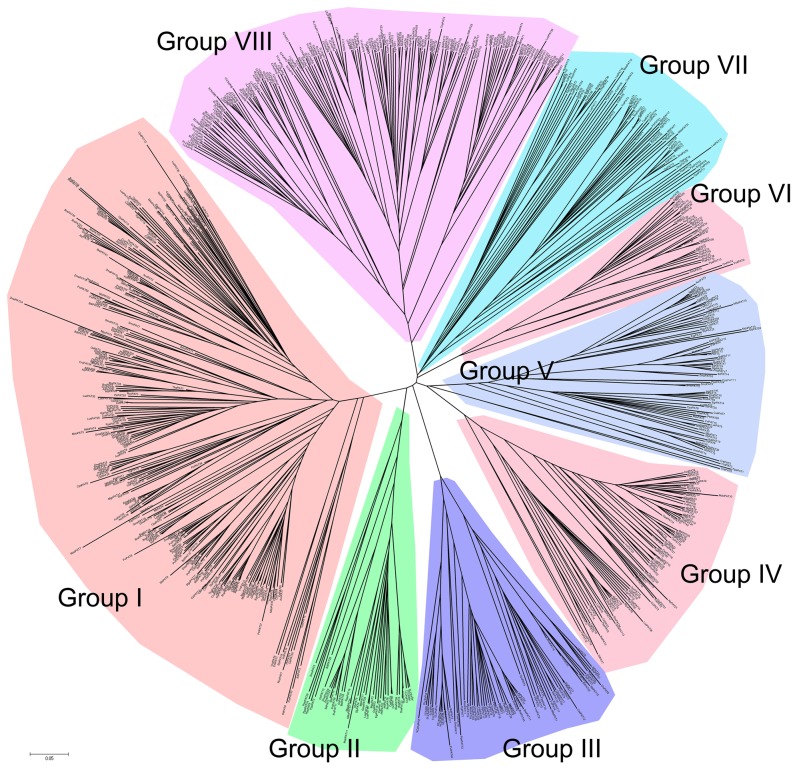
To clarify the phylogenetic relationship among the PATs proteins and to infer the evolutionary history of the protein family, the full-length protein sequences of the PATs in plants were used to construct a joint unrooted phylogenetic tree (Fig. 2), from which it could be observed that the proteins fell into 8 groups (group I to VIII). The number of PATs in each group was shown in Figure. 1. Statistically, 33.2% (267/804) of the PATs were in group I, which contained the highest number among the 8 groups. The lowest number of PATs was in group VI with 34 PATs, which was fewer than the total number of PATs in some species, such as Panicum virgatum, Limum usitatissimum, Populustrichocarpa, Glycine max, Brassjca rapa or Zea mays. In addition, we found that all the species from chloropyta to the green higher plants contained PATs from groups I, V and VII. In contrast, there were no PATs from group II, III or IV in chloropyta. These results suggested that the PATs in group II, III and IV may have originated after the divergence of ferns and chloropyta.
Figure 2. Phylogenetic relationships between the PATs in plants.
The amino acid sequences of the plant PATs were aligned using MUSCLE, and the phylogenetic tree was constructed using the neighbour-joining method in the MEGA 5 software.
Gene structure and chromosomal location of the PAT family in Arabidopsis, Oryza sative, Zea mays and Glycine max
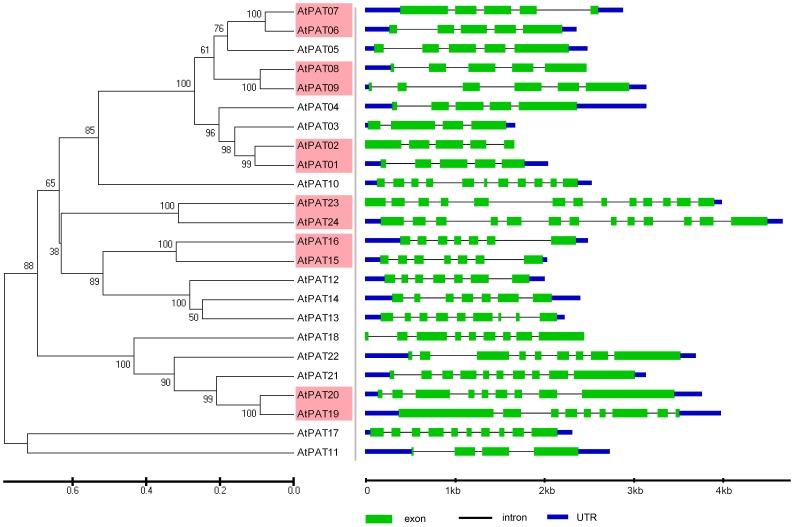
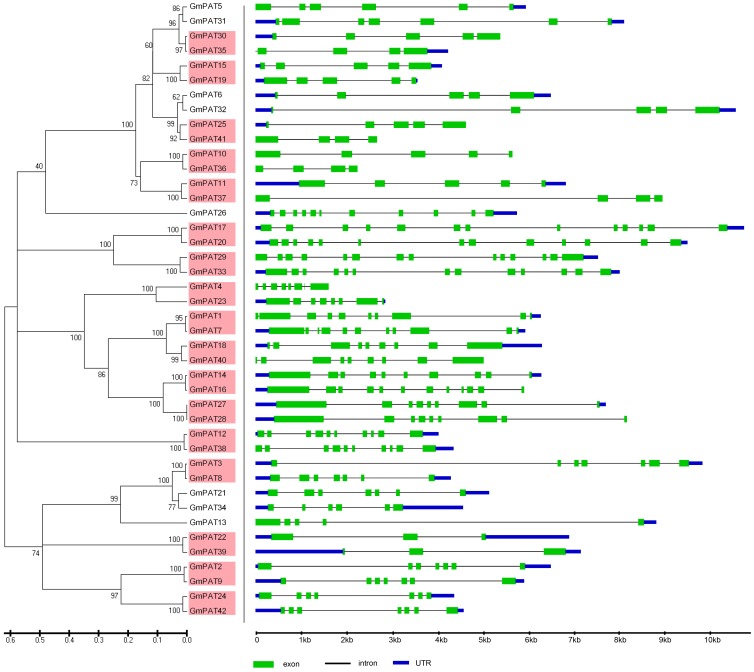
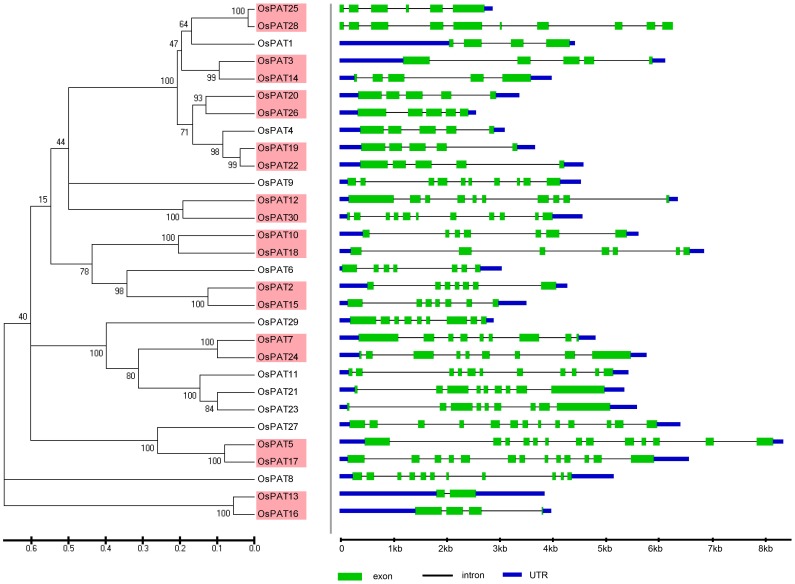
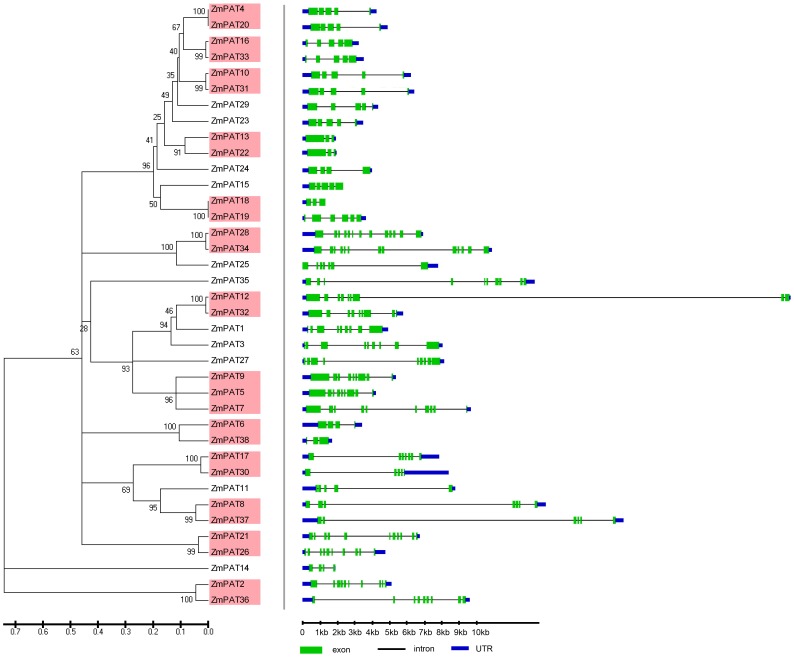
The phylogenetic relationships of the PATs in Arabidopsis, Oryza sative, Zea mays and Glycine max were examined by aligning their amino acid sequences and implementing the neighbour-joining method in MEGA 5.0. Then, a more extensive bioinformatic analysis of the PAT gene family was subsequently performed. We compared the genomic sequences of all of the genes with the sequences from the Gene Structure Display Server (GSDS, http://gsds.cbi.pku.edu.cn/.) to generate schematic diagrams of the gene structure. An analysis of the structure of the PATs genes showed that the mosaic structure was different from each member of the DHHC-CRD-containing PATs gene family in Arabidopsis, Oryza sative, Zea mays and Glycine max, respectively. Not only were the positions and lengths of the introns not conserved, but the number of introns was also highly variable (Fig. 3–6). The number of introns ranged from 3 to 12 in Arabidopsis, from 2 to 12 in Zea mays, from 1 to 12 in Oryza sative and from 2 to 13 in Glycine max. Among the four plants, we found that most of the PATs contained 4 introns, and the number of PATs containing 4 introns was 7 in Arabidopsis, 11 in Zea mays, 7 in Oryza sative and 10 in Glycine max. In addition, we found that the length of most of the PATs genes in Arabidopsis was shorter than that in Oryza sative, Zea may or Glycine max, which could account for the short introns.
Figure 3. Evolutionary relationship and gene structure analysis of the AtPATs in Arabidopsis.
The amino acid sequences of the AtPATs were aligned with Clustal X, and the phylogenetic tree was constructed using the neighbour-joining method in the MEGA 5.0 software program. Each node is represented by a number that indicates the bootstrap value. The scale bar represents 0.1 substitutions per sequence position (left). The right side illustrates the exon-intron organisation of the corresponding AtPAT gene. The exons and introns are represented by the green boxes and black lines, respectively. The scale bar represents 1 kb (right).
Figure 6. Evolutionary relationship and gene structure analysis of the GmPATs in Glycine max.
The amino acid sequences of GmPATs were aligned with Clustal X, and the phylogenetic tree was constructed using the neighbour-joining method in the MEGA 5.0 software program. Each node is represented by a number that indicates the bootstrap value. The scale bar represents 0.1 substitutions per sequence position (left). The right side illustrates the exon-intron organisation of the corresponding GmPATs genes. The exons and introns are represented by the green boxes and black lines, respectively. The scale bar represents 1 kb (right).
Figure 4. Evolutionary relationship and gene structure analysis of the OsPATs in Oryza sative.
The amino acid sequences of the OsPATs were aligned with Clustal X, and the phylogenetic tree was constructed using the neighbour-joining method in the MEGA 5.0 software program. Each node is represented by a number that indicates the bootstrap value. The scale bar represents 0.1 substitutions per sequence position (left). The right side illustrates the exon-intron organisation of the corresponding OsPATs genes. The exons and introns are represented by the green boxes and black lines, respectively. The scale bar represents 1 kb (right).
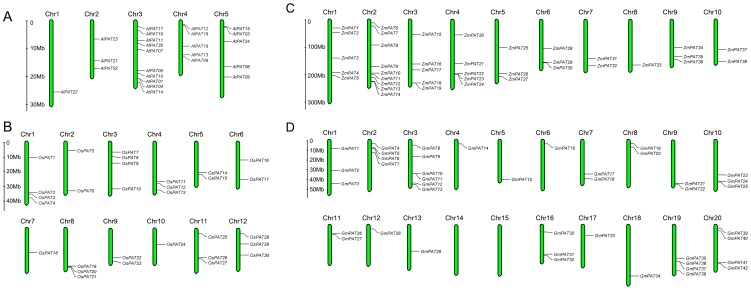
To determine the genomic distribution of the PATs genes in Arabidopsis, Oryza sative, Zea mays and Glycine max, we used their DNA sequences to search the Phytozome database and the PlantGDB database. The position of each gene is shown in Fig. 7. The chromosomal location analysis showed that the AtPATs, OsPAT and ZmPATs were distributed across all chromosomes with different densities in Arabidopsis (Fig. 7A), Oryza sative (Fig. 7B) and Zea mays (Fig. 7C), respectively. However, 42 GmPATs genes were found to be distributed across 18 chromosomes, and there was no GmPATs located on chromosomes 14 or 15 (Fig. 7D).
Figure 7. Chromosomal locations of PATs genes in Arabidopsis, Oryza sative, Zea mays and Glycine max.
(A)Chromosomal locations of AtPATs genes in Arabidopsis. (B)Chromosomal locations of OsPATs genes in Oryza sative. (C)Chromosomal locations of ZmPATs genes in Zea mays. (D)Chromosomal locations of GmPATs genes in Glycine max.
Expression profiling of PATs genes in Arabidopsis, Oryza sative, Zea mays and Glycine max
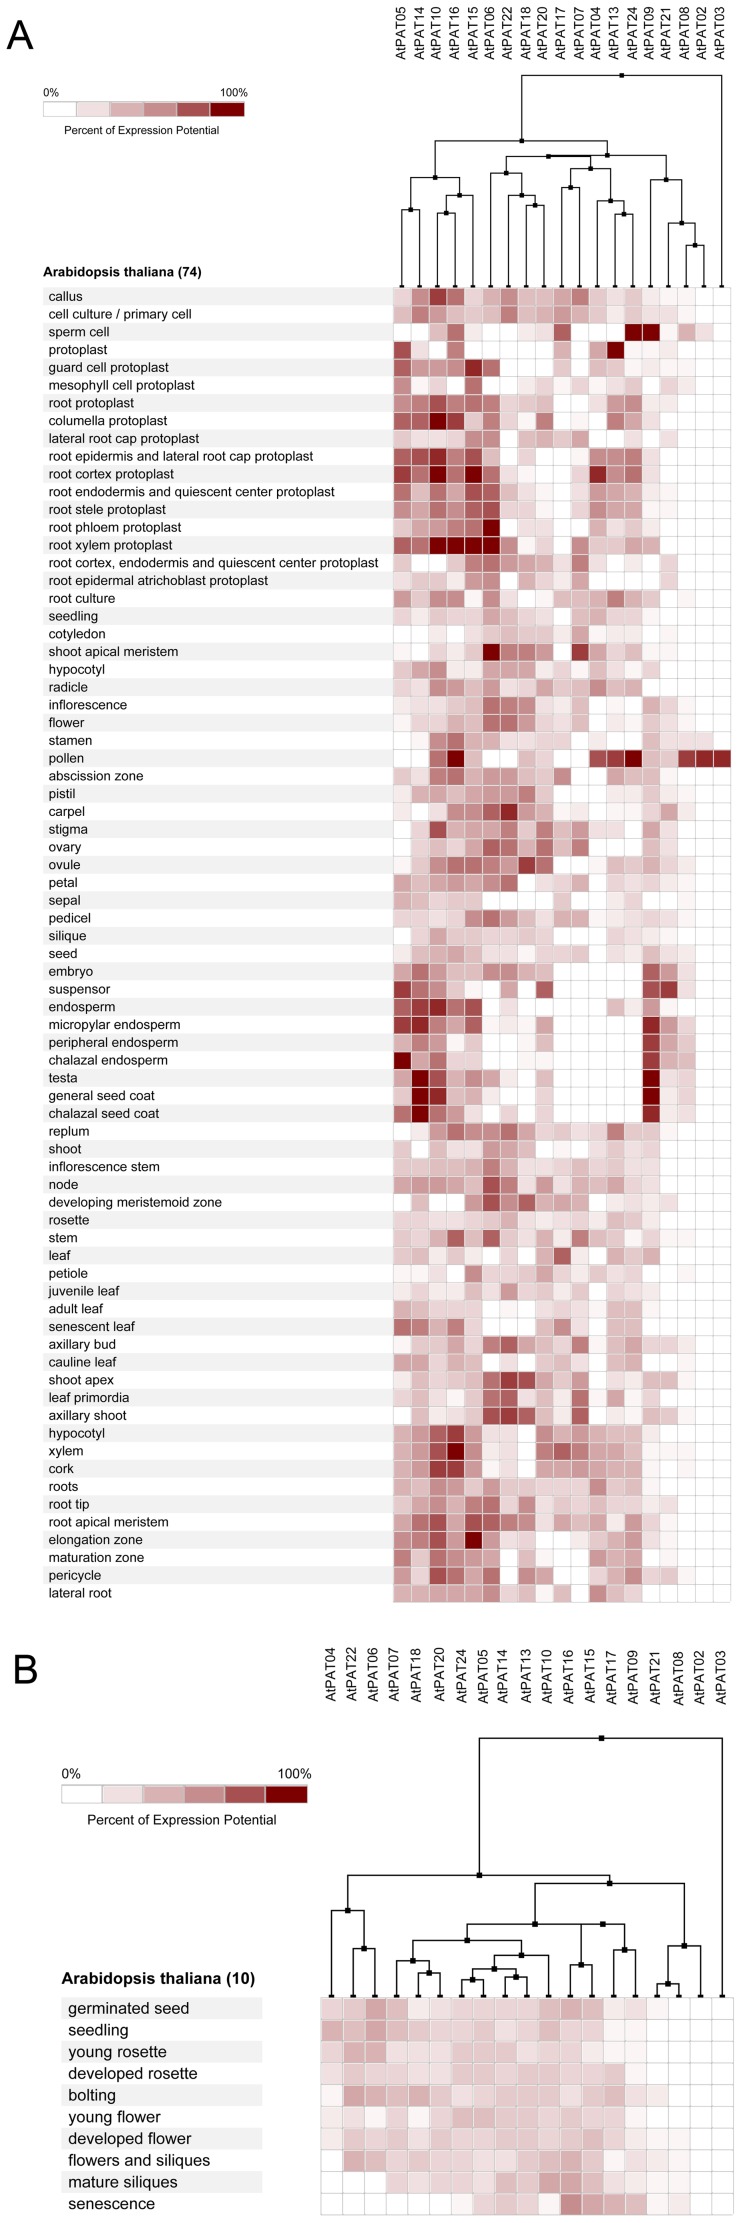
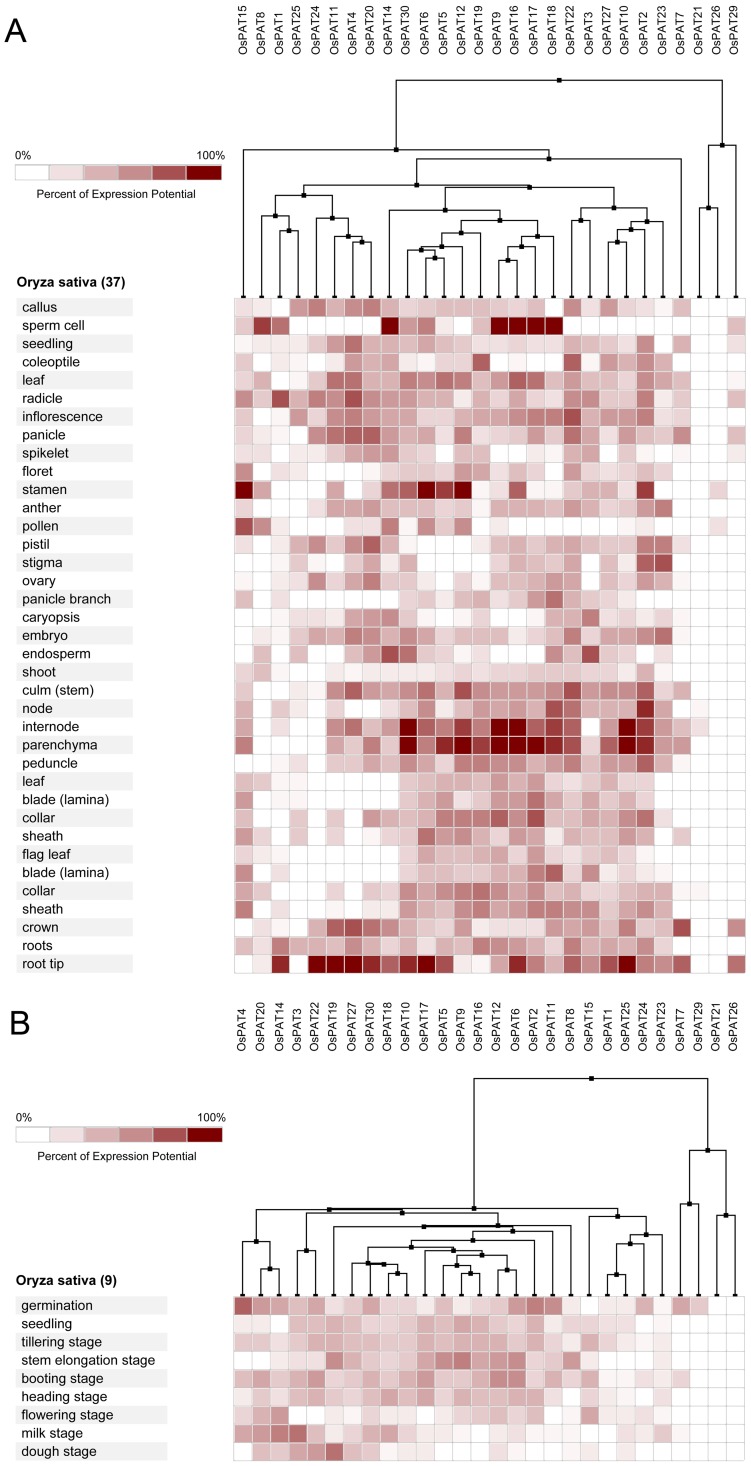
To investigate the expression profiling of the PATs gene in plants, we used bioinformatics methods to gather extensive microarray information regarding this family in the model plant, Arabidopsis and in important crops (Oryza sative, Zea mays and Glycine max). The plant tissues and developmental stages selected for microarray analysis span the entire life cycle. The deep and light colour shading represents the relatively high or low expression levels of the PATs genes in the different tissues, respectively.
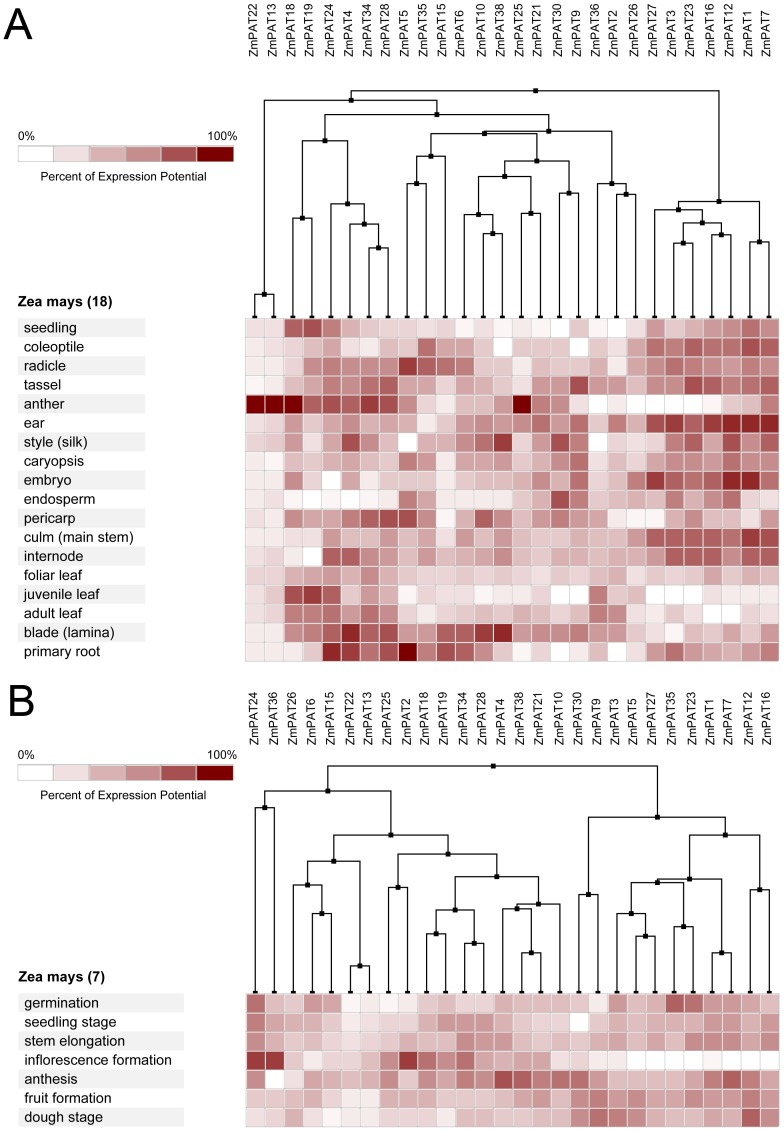
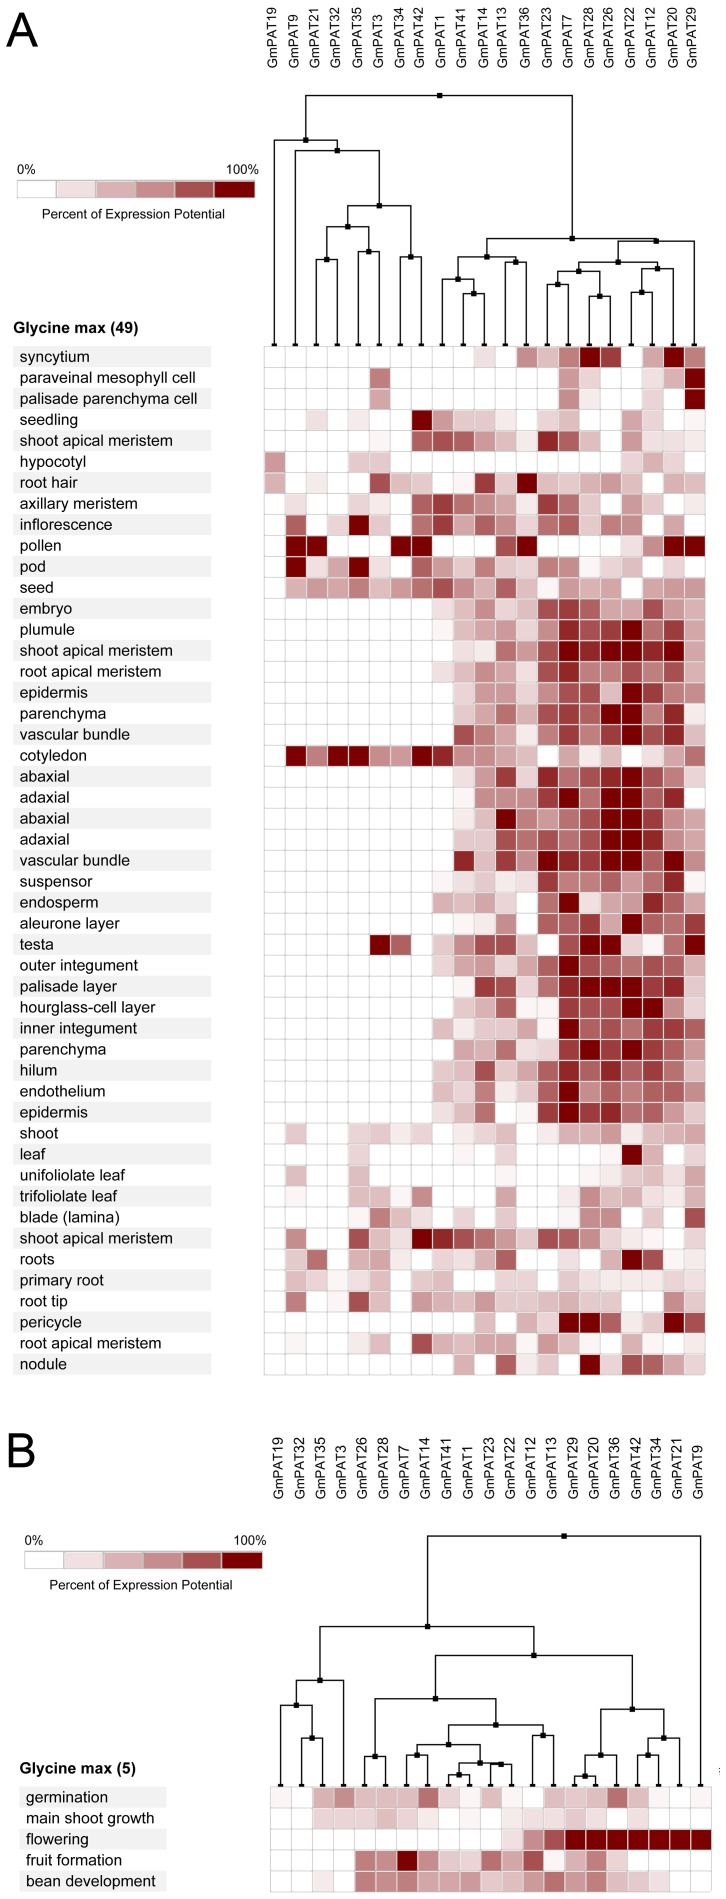
In Arabidopsis, 19 of the 24 AtPATs genes could be identified using microarray. Most AtPATs showed a broad expression pattern at different developmental stages and tissues analysed, except AtPAT2 and AtPAT3, which only exhibited high expression in the stamen. In addition, AtPAT8 and AtPAT21 exhibited very low expression in the developmental stages (Fig. 8). In Oryza sative, 28 of the 30 OsPATs genes could be identified. The results showed that OsPAT21 and OsPAT26 were only expressed in the internode and stamen, respectively. However, the other 26 OsPATs showed transcript abundance in more than one tissue. Interestingly, we found that OsPAT29 was specifically expressed during germination and was expressed in many tissues (Fig. 9). This finding accounted for the different amounts of RNA in the tissues in different developmental stages. In Zea mays, 28 of 38 ZmPATs were analysed. The results showed that all 28 ZmPATs exhibited extensive expression in the developmental stages and tissues analysed. In addition, ZmPAT13 and ZmPAT22 showed similar expression patterns and exhibited high expression in the anther (Fig. 10). In Glycine max, only half of the GmPATs were analysed. Among the 21 GmPATs, 7 genes (GmPAT9, 20, 21, 29, 32, 34, 42) were specifically expressed in the flowering stage, while 11 genes (GmPAT1, 3, 7, 14, 19, 23, 26, 28, 32, 35, 41) were not expressed in the flowering stage. In addition, GmPAT19 and GmPAT32 were abundantly transcribed in they hypocotyl and cotyledon, respectively (Fig. 11).
Figure 8. Expression analysis of AtPATs genes in Arabidopsis.
The heatmap was prepared using the Genevestigator tool, and the microarray expression data were from the results of many chips available on the web (https://www.genevestigator.com/gv/). The dark and light colour shadings represent relatively high or low expression levels, respectively. (A)Expression analysis of AtPATs genes in different tissues. (B)Expression analysis of AtPATs genes in different life stages
Figure 9. Expression analysis of OsPATs genes in Oryza sative.
The heatmap was prepared using the Genevestigator tool, and the microarray expression data were from the results of many chips available on the web (https://www.genevestigator.com/gv/). The dark and light colour shadings represent relatively high or low expression levels, respectively. (A)Expression analysis of OsPATs genes in different tissues. (B)Expression analysis of OsPATs genes in different life stages
Figure 10. Expression analysis of ZmPATs genes in Zea mays.
The heatmap was prepared using the Genevestigator tool, and the microarray expression data were from the results of many chips available on the web (https://www.genevestigator.com/gv/). The dark and light colour shadings represent relatively high or low expression levels, respectively. (A)Expression analysis of ZmPATs genes in different tissues. (B)Expression analysis of ZmPATs genes in different life stages
Figure 11. Expression analysis of GmPATs genes in Glycine max.
The heatmap was prepared using the Genevestigator tool, and the microarray expression data were from the results of many chips available on the web (https://www.genevestigator.com/gv/). The dark and light colour shadings represent relatively high or low expression levels, respectively. (A)Expression analysis of GmPATs genes in different tissues (B)Expression analysis of GmPATs genes in different life stages
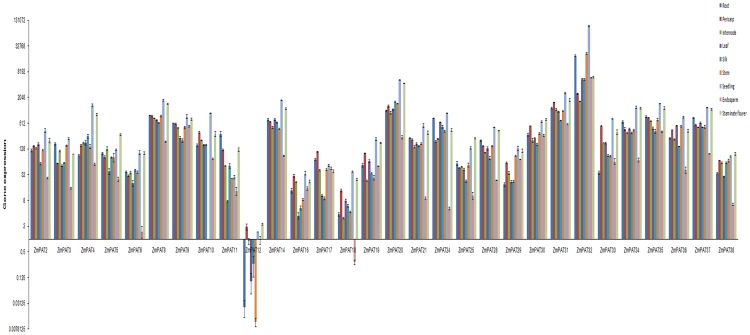
With the aim of revealing the characteristics of ZmPATs expression, an analysis of the preferential expression of 30 ZmPATs was performed using real-time PCR with gene-specific primers in Zea mays. Among the 30 genes, ZmPAT32 had the highest expression level, and ZmPAT12 had the lowest expression level in the tissues tested. In addition, we found that most of the genes (19 ZmPATs) had higher expression signals in the seedlings and flowers than in the other tissues tested, and many genes (17 ZmPATs) showed the lowest expression levels in the endosperm (Fig. 12). These results demonstrated that the expression of the ZmPATs was extensive in different tissues and exhibited a preferential expression profile.
Figure 12. Quantitative RT-PCR to measure the expression patterns of 30 ZmPATs genes in Zea mays.
Error bars indicate standard deviations (n = 3). 1, primary root; 2, pericarp; 3, internode; 4, adult leaf; 5, silk; 6, culm; 7, seedling; 8, endosperm; 9, embryo; 10, tassel.
Responses of ZmPATs to phytohormones and abiotic stress in Zea mays
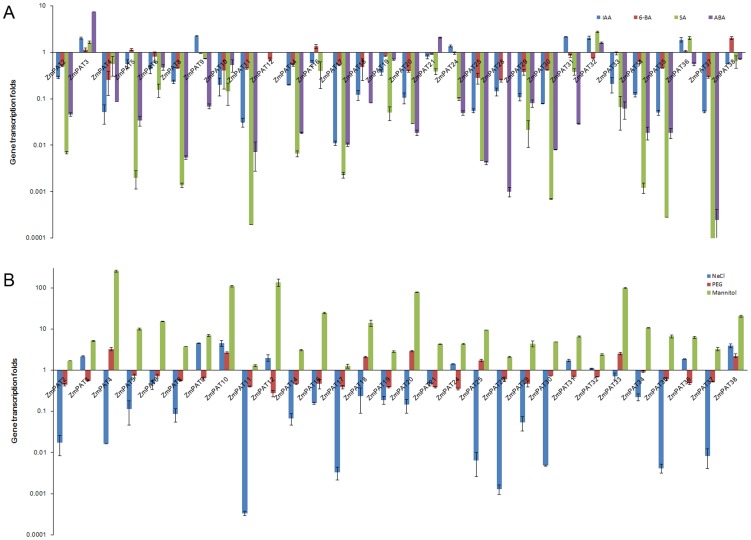
Phytohormones play a critical role in plant growth and development. To investigate the potential function of the PATs genes in plants, we surveyed the responses of the ZmPATs to phytohormones. The analysis was performed using the total RNA from the leaves of seedlings treated with IAA (indole-3-acetic acid), 6-BA (6-benzylaminopurine), SA (salicylic acid) and ABA (abscisic acid). The real-time PCR results showed that 14 ZmPATs were down regulated by all of the phytohormones tested. In additional, 6 ZmPATs (ZmPAT3, 9, 24, 31, 32 and 36) were up-regulated by IAA, 2 ZmPATs were up-regulated by 6-BA (ZmPAT16 and 38) and 2 ZmPATs (ZmPAT3 and 32) were up-regulated by both SA and ABA (Fig. 13A). Therefore, the results demonstrated that phytohormones affected the expression of ZmPATs and suggested that these proteins may play roles in plant growth and development.
Figure 13. The expression profiles of some ZmPATs genes response to phytohormones and mimic abiotic stress.
(A)The expression profiles of some ZmPATs genes are responsive to phytohormones. (B)The expression profiles of some ZmPATs genes mimic the response to abiotic stress. 5-day-old (Zea mays) wild type seedlings were transferred to liquid MS media supplemented with 5 µM 6-BA, 5 µM IAA, 100 µM SA, 100 µM ABA, 100 mM NaCl, 300 mM mannitol or 15% PEG 6000 (or solvent control) for 6 h with gentle shaking. Representative experiments are shown, and the experiments were performed three times. Each bar represents a mean±SEM (n = 3).
Previous reports have revealed that SA and ABA mediate the plant's response to stress by rapid accumulation, thus facilitating plant survival. Nearly all of the ZmPAT genes tested were up or down regulated by SA and ABA. The results suggested that the ZmPATs may be involved in the signalling pathways that are triggered by abiotic stresses. To determine the responses of these genes to different abiotic stresses, an experimental analysis was performed using the total RNA from the leaves of seedlings treated with NaCl, PEG and mannitol. The results showed that ZmPAT10 and ZmPAT38 were induced by all the treatments, and all the ZmPAT genes were induced by mannitol, with the exception of ZmPAT17. In addition, the expression levels of 57% of the ZmPATs (17/30) were induced or reduced by both NaCl and PEG. Six genes (ZmPAT3, 9, 12, 24, 31, 36) were up-regulated by NaCl and down-regulated by PEG. On the contrary, 5 genes (ZmPAT4, 18, 20, 25, 33) were down-regulated by NaCl and up-regulated by PEG (Fig. 13B). These results suggest that the functions of the ZmPAT genes may be involved in the responses to stresses in Zea mays.
Discussion
DHHC-CRD-containing proteins mediate the S-acylation of proteins [1], [19]. However, the studies of plant PATs are still very limited. To identify additional plant PATs and to infer their biological functions and investigate the evolutionary history of this protein family, we identified 804 putative PATs in 31 plants with completely sequenced genomes. Notably, the DHHC-CRD PATs were found in both the vascular and non-vascular plants as well as in green algae. This result demonstrated the important roles and relativly conservative evolution of PATs in plant life. In addition, the number of PATs was significantly different, ranging from 6 (Volvox carteri) to 52 (Panicum virgatum). Generally, the numbers of PATs is fewer in low plant than which in green higher plant. In average, there are 27.2 PATs in land plants, while only 7.5 PATs in chloropyta. This may be due to substrate specificity and the redundancy of genes that serve important functions in plant evolution processing. The first systematic analysis of how individual DHHC proteins affect cellular palmitoylation was performed in S. cerevisiae [16]. The proteomic analysis of the substrate palmitoylation profiles in DHHC-deficient yeast strains provided clear evidence for substrate selectivity: most Akr1 target are soluble proteins that are exclusively palmitoylated; Erf2 substrates tend to be modified by myristoyl or prenyl groups; and Swf1 has a preference for cysteine residues in proximity to TMDs [47], [48]. Moreover, an analysis of DHHC-substrate interactions based on co-expression was performed in mammals, and the results suggested that some DHHC palmitoylated a broad range of substrates [1], whereas others were more selective, such as DHHC4, 5, 9 and 12 [49]-[51]. Therefore, there are numerous PATs in some higher plants that may be more selective.
To clarify the phylogenetic relationships among the PAT proteins and infer the evolutionary history of the protein family, a phylogenetic tree of PATs in plants was constructed. It could be observed that the proteins fell into 8 groups (group I to VIII). The sequence conservation among the groups of PATs is exceptional low, which is consistent with AtPATs[21]. This indicates an overall early and differential evolution of the groups. In addition, we found that there were no PATs in groups II, IIIand IV in chloropyta. The reason for this phenomenon may be the complex localisation of PATs in the green higher plants. The tissue and cellular localisation of the PATs is more complex in green higher plants than algae. In Arabidopsis, the expression patterns of 20 PAT genes were studied. Nine AtPATs (AtPAT1, 3, 5, 7, 9, 10, 11, 22, 24) have high expression in flowers, 5 AtPATs (AtPAT12, 14, 16, 17, 23) are highly expressed in seedlings and 8 AtPATs (AtPAT4, 5, 6, 8, 13, 14, 15, 22) exhibit high expression in siliques. In addition, the cellar localisation of all 24 AtPATs was studied. Most of these proteins are targeted to membrane structures, such as the endoplasmic reticulum, the Golgi, endosomes and the vacuolar membrane [7]. This complex targeting pattern of PATs demonstrates that S-acylation, which is different in plants than in yeast and mammals, can occur at different cellular membranes within the plant cell.
Knowing the expression profiles of some PAT genes may provide clues as to the biological function of PATs. Through the analysis of the expression profiles in Arabidopsis, Oryza sative, Zea mays and Glycine max, we found that PAT gene transcripts accumulated during different developmental stages and in different tissues (Fig. 5, 6). The variability in the expression patterns of the genes in the same family indicates that their roles might not be redundant and that these genes, which are preferentially expressed in specific tissues, may require further investigation to fully understand their functions. In addition, crops and the model plant Arabidopsis were used in this expression analysis. Therefore, the results from this study will be useful for further studying crop production.
Figure 5. Evolutionary relationship and gene structure analysis of the ZmPATs in Zea mays.
The amino acid sequences of ZmPATs were aligned with Clustal X, and the phylogenetic tree was constructed using the neighbour-joining method in the MEGA 5.0 software program. Each node is represented by a number that indicates the bootstrap value. The scale bar represents 0.1 substitutions per sequence position (left). The right side illustrates the exon-intron organisation of the corresponding ZmPATs genes. The exons and introns are represented by the green boxes and black lines, respectively. The scale bar represents 1 kb (right).
S-acylated proteins play a wide variety of roles in plants and affect Ca2+ signalling [52], [53], K+ movement [3], stress signalling [26], small and heteotrimeric G-protein membrane association an partitioning [54], tubulin function and pathogenesis [3], [55]. Therefore, knowing the response of the PAT genes to phytohormones and stress treatments may provide clues to their function. Among the 31 plants that have been completely sequenced, we used the model crop Zea mays as an example. Through our transcriptional analysis of the ZmPATs, we found that the expression of all the examined genes was affected by exposure to phytohormones. This result suggests that the PATs likely play roles in plant growth and development. In addition, nearly all the ZmPAT genes tested were up or down regulated by SA and ABA, which mediates the plant's response to stress, specifically abiotic stress. Accordingly, all the ZmPATs were affected by NaCl, PEG or mannitol, and many genes were affected by all three treatments, such as ZmPAT4, 10, 20 and 38. These results inferred that the functions of the PATs genes may be involved in responses to stresses in plants.
In conclusion, the preferential expression of the PATs genes in specified tissues and their response to phytohormones and stress treatments provide clues to the roles of these genes in signalling, growth and development. The systematic sequence analysis and expression profiles of the PATs genes will serve as a useful reference for more detailed functional analyses and will be helpful in the selection of appropriate candidate genes for further studies and genetic engineering.
Supporting Information
Putative DHHC-Cysteine-Rich Domain S-Acyltransferase in Plants.
(XLS)
Funding Statement
This work was supported by Natural Science Foundation of China (31170233), Natural Science Foundation of China (31110103917) and National Basic Research Program of China (2011CB100706). The funders had roles in study design, data collection and analysis and decision to publish.
References
- 1. Greaves J, Chamberlain LH (2011) DHHC palmitoyl transferases: substrate interactions and (patho)physiology. Trends in biochemical sciences 36: 245–253. [DOI] [PubMed] [Google Scholar]
- 2. Linder ME, Deschenes RJ (2007) Palmitoylation: policing protein stability and traffic. Nature reviews Molecular cell biology 8: 74–84. [DOI] [PubMed] [Google Scholar]
- 3. Hemsley PA (2009) Protein S-acylation in plants (Review). Molecular membrane biology 26: 114–125. [DOI] [PubMed] [Google Scholar]
- 4. Kordyukova LV, Serebryakova MV, Baratova LA, Veit M (2008) S acylation of the hemagglutinin of influenza viruses: mass spectrometry reveals site-specific attachment of stearic acid to a transmembrane cysteine. Journal of virology 82: 9288–9292. [DOI] [PMC free article] [PubMed] [Google Scholar]
- 5. Batistič O, Sorek N, Schültke S, Yalovsky S, Kudla J (2008) Dual fatty acyl modification determines the localization and plasma membrane targeting of CBL/CIPK Ca2+ signaling complexes in Arabidopsis. The Plant Cell Online 20: 1346–1362. [DOI] [PMC free article] [PubMed] [Google Scholar]
- 6. Schroeder H, Leventis R, Rex S, Schelhaas M, Nägele E, et al. (1997) S-Acylation and plasma membrane targeting of the farnesylated carboxyl-terminal peptide of N-ras in mammalian fibroblasts. Biochemistry 36: 13102–13109. [DOI] [PubMed] [Google Scholar]
- 7. Batistic O (2012) Genomics and localization of the Arabidopsis DHHC-cysteine-rich domain S-acyltransferase protein family. Plant physiology 160: 1597–1612. [DOI] [PMC free article] [PubMed] [Google Scholar]
- 8. Rocks O, Gerauer M, Vartak N, Koch S, Huang ZP, et al. (2010) The palmitoylation machinery is a spatially organizing system for peripheral membrane proteins. Cell 141: 458–471. [DOI] [PubMed] [Google Scholar]
- 9. Tomatis VM, Trenchi A, Gomez GA, Daniotti JL (2010) Acyl-Protein Thioesterase 2 Catalizes the Deacylation of Peripheral Membrane-Associated GAP-43. PloS one 5: e15045. [DOI] [PMC free article] [PubMed] [Google Scholar]
- 10. Greaves J, Prescott GR, Gorleku OA, Chamberlain LH (2009) The fat controller: roles of palmitoylation in intracellular protein trafficking and targeting to membrane microdomains (Review). Molecular membrane biology 26: 67–79. [DOI] [PubMed] [Google Scholar]
- 11. Schlesinger MJ, Magee AI, Schmidt MF (1980) Fatty acid acylation of proteins in cultured cells. The Journal of biological chemistry 255: 10021–10024. [PubMed] [Google Scholar]
- 12. Schmidt MF, Schlesinger MJ (1979) Fatty acid binding to vesicular stomatitis virus glycoprotein: a new type of post-translational modification of the viral glycoprotein. Cell 17: 813–819. [DOI] [PubMed] [Google Scholar]
- 13. Zhao L, Lobo S, Dong X, Ault AD, Deschenes RJ (2002) Erf4p and Erf2p form an endoplasmic reticulum-associated complex involved in the plasma membrane localization of yeast Ras proteins. The Journal of biological chemistry 277: 49352–49359. [DOI] [PubMed] [Google Scholar]
- 14. Lobo S, Greentree WK, Linder ME, Deschenes RJ (2002) Identification of a Ras palmitoyltransferase in Saccharomyces cerevisiae. The Journal of biological chemistry 277: 41268–41273. [DOI] [PubMed] [Google Scholar]
- 15. Roth AF, Feng Y, Chen L, Davis NG (2002) The yeast DHHC cysteine-rich domain protein Akr1p is a palmitoyl transferase. The Journal of cell biology 159: 23–28. [DOI] [PMC free article] [PubMed] [Google Scholar]
- 16. Bartels DJ, Mitchell DA, Dong X, Deschenes RJ (1999) Erf2, a novel gene product that affects the localization and palmitoylation of Ras2 in Saccharomyces cerevisiae. Molecular and cellular biology 19: 6775–6787. [DOI] [PMC free article] [PubMed] [Google Scholar]
- 17. Putilina T, Wong P, Gentleman S (1999) The DHHC domain: a new highly conserved cysteine-rich motif. Molecular and cellular biochemistry 195: 219–226. [DOI] [PubMed] [Google Scholar]
- 18. Mesilaty-Gross S, Reich A, Motro B, Wides R (1999) The Drosophila STAM gene homolog is in a tight gene cluster, and its expression correlates to that of the adjacent gene ial. Gene 231: 173–186. [DOI] [PubMed] [Google Scholar]
- 19. Mitchell DA, Vasudevan A, Linder ME, Deschenes RJ (2006) Protein palmitoylation by a family of DHHC protein S-acyltransferases. Journal of lipid research 47: 1118–1127. [DOI] [PubMed] [Google Scholar]
- 20. Mitchell DA, Vasudevan A, Linder ME, Deschenes RJ (2006) Thematic review series: lipid posttranslational modifications. Protein palmitoylation by a family of DHHC protein S-acyltransferases. Journal of lipid research 47: 1118–1127. [DOI] [PubMed] [Google Scholar]
- 21. Batistič O (2012) Genomics and localization of the Arabidopsis DHHC-cysteine-rich domain S-acyltransferase protein family. Plant physiology 160: 1597–1612. [DOI] [PMC free article] [PubMed] [Google Scholar]
- 22. Valdez-Taubas J, Pelham H (2005) Swf1-dependent palmitoylation of the SNARE Tlg1 prevents its ubiquitination and degradation. The EMBO journal 24: 2524–2532. [DOI] [PMC free article] [PubMed] [Google Scholar]
- 23. Smotrys JE, Schoenfish MJ, Stutz MA, Linder ME (2005) The vacuolar DHHC-CRD protein Pfa3p is a protein acyltransferase for Vac8p. The Journal of cell biology 170: 1091–1099. [DOI] [PMC free article] [PubMed] [Google Scholar]
- 24. Lam KK, Davey M, Sun B, Roth AF, Davis NG, et al. (2006) Palmitoylation by the DHHC protein Pfa4 regulates the ER exit of Chs3. The Journal of cell biology 174: 19–25. [DOI] [PMC free article] [PubMed] [Google Scholar]
- 25. Hemsley PA, Kemp AC, Grierson CS (2005) The TIP GROWTH DEFECTIVE1 S-acyl transferase regulates plant cell growth in Arabidopsis. The Plant Cell Online 17: 2554–2563. [DOI] [PMC free article] [PubMed] [Google Scholar]
- 26. Zhou LZ, Li S, Feng QN, Zhang YL, Zhao X, et al. (2013) PROTEIN S-ACYL TRANSFERASE10 Is Critical for Development and Salt Tolerance in Arabidopsis. The Plant cell 25: 1093–1107. [DOI] [PMC free article] [PubMed] [Google Scholar]
- 27. Schiefelbein J, Galway M, Masucci J, Ford S (1993) Pollen tube and root-hair tip growth is disrupted in a mutant of Arabidopsis thaliana. Plant physiology 103: 979–985. [DOI] [PMC free article] [PubMed] [Google Scholar]
- 28. Ryan E, Grierson CS, Cavell A, Steer M, Dolan L (1998) TIP1 is required for both tip growth and non-tip growth in Arabidopsis. New Phytologist 138: 49–58. [Google Scholar]
- 29. Mistry J, Finn R (2007) Pfam: a domain-centric method for analyzing proteins and proteomes. Methods in molecular biology 396: 43–58. [DOI] [PubMed] [Google Scholar]
- 30. Letunic I, Doerks T, Bork P (2012) SMART 7: recent updates to the protein domain annotation resource. Nucleic acids research 40: D302–305. [DOI] [PMC free article] [PubMed] [Google Scholar]
- 31. Goodstein DM, Shu S, Howson R, Neupane R, Hayes RD, et al. (2012) Phytozome: a comparative platform for green plant genomics. Nucleic acids research 40: D1178–1186. [DOI] [PMC free article] [PubMed] [Google Scholar]
- 32. Dong Q, Schlueter SD, Brendel V (2004) PlantGDB, plant genome database and analysis tools. Nucleic acids research 32: D354–359. [DOI] [PMC free article] [PubMed] [Google Scholar]
- 33. Jacob A, Lancaster J, Buhler J, Harris B, Chamberlain RD (2008) Mercury BLASTP: Accelerating Protein Sequence Alignment. ACM transactions on reconfigurable technology and systems 1: 9. [DOI] [PMC free article] [PubMed] [Google Scholar]
- 34. Altschul SF, Gish W, Miller W, Myers EW, Lipman DJ (1990) Basic local alignment search tool. Journal of molecular biology 215: 403–410. [DOI] [PubMed] [Google Scholar]
- 35.Blunsom P (2004) Hidden markov models. Lecture notes, August.
- 36. Jeanmougin F, Thompson JD, Gouy M, Higgins DG, Gibson TJ (1998) Multiple sequence alignment with Clustal X. Trends in biochemical sciences. 23: 403–405. [DOI] [PubMed] [Google Scholar]
- 37. Gasteiger E, Gattiker A, Hoogland C, Ivanyi I, Appel RD, et al. (2003) ExPASy: The proteomics server for in-depth protein knowledge and analysis. Nucleic acids research 31: 3784–3788. [DOI] [PMC free article] [PubMed] [Google Scholar]
- 38. Edgar RC (2004) MUSCLE: a multiple sequence alignment method with reduced time and space complexity. BMC bioinformatics 5: 113. [DOI] [PMC free article] [PubMed] [Google Scholar]
- 39. Tamura K, Peterson D, Peterson N, Stecher G, Nei M, et al. (2011) MEGA5: molecular evolutionary genetics analysis using maximum likelihood, evolutionary distance, and maximum parsimony methods. Molecular biology and evolution 28: 2731–2739. [DOI] [PMC free article] [PubMed] [Google Scholar]
- 40. Liu RH, Meng JL (2003) [MapDraw: a microsoft excel macro for drawing genetic linkage maps based on given genetic linkage data]. Yi chuan = Hereditas / Zhongguo yi chuan xue hui bian ji 25: 317–321. [PubMed] [Google Scholar]
- 41. Guo AY, Zhu QH, Chen X, Luo JC (2007) [GSDS: a gene structure display server]. Yi chuan = Hereditas / Zhongguo yi chuan xue hui bian ji 29: 1023–1026. [PubMed] [Google Scholar]
- 42. Grennan AK (2006) Genevestigator. Facilitating web-based gene-expression analysis. Plant physiology 141: 1164–1166. [DOI] [PMC free article] [PubMed] [Google Scholar]
- 43. Ganal MW, Durstewitz G, Polley A, Bérard A, Buckler ES, et al. (2011) A large maize (Zea mays L.) SNP genotyping array: development and germplasm genotyping, and genetic mapping to compare with the B73 reference genome. PloS one 6: e28334. [DOI] [PMC free article] [PubMed] [Google Scholar]
- 44. Kong X, Lv W, Zhang D, Jiang S, Zhang S, et al. (2013) Genome-Wide Identification and Analysis of Expression Profiles of Maize Mitogen-Activated Protein Kinase Kinase Kinase. PloS one 8: e57714. [DOI] [PMC free article] [PubMed] [Google Scholar]
- 45. Murashige T, Skoog F (1962) A revised medium for rapid growth and bio assays with tobacco tissue cultures. Physiologia plantarum 15: 473–497. [Google Scholar]
- 46. Chao S, Sederoff R, Levings CS (1984) Nucleotide sequence and evolution of the 18S ribosomal RNA gene in maize mitochondria. Nucleic acids research 12: 6629–6644. [DOI] [PMC free article] [PubMed] [Google Scholar]
- 47. Roth AF, Wan J, Bailey AO, Sun B, Kuchar JA, et al. (2006) Global analysis of protein palmitoylation in yeast. Cell 125: 1003–1013. [DOI] [PMC free article] [PubMed] [Google Scholar]
- 48. Hemsley PA, Grierson CS (2011) The ankyrin repeats and DHHC S-acyl transferase domain of AKR1 act independently to regulate switching from vegetative to mating states in yeast. PloS one 6: e28799. [DOI] [PMC free article] [PubMed] [Google Scholar]
- 49. Vetrivel KS, Meckler X, Chen Y, Nguyen PD, Seidah NG, et al. (2009) Alzheimer disease Abeta production in the absence of S-palmitoylation-dependent targeting of BACE1 to lipid rafts. The Journal of biological chemistry 284: 3793–3803. [DOI] [PMC free article] [PubMed] [Google Scholar]
- 50. Tian L, McClafferty H, Jeffries O, Shipston MJ (2010) Multiple palmitoyltransferases are required for palmitoylation-dependent regulation of large conductance calcium- and voltage-activated potassium channels. The Journal of biological chemistry 285: 23954–23962. [DOI] [PMC free article] [PubMed] [Google Scholar]
- 51. Singaraja RR, Kang MH, Vaid K, Sanders SS, Vilas GL, et al. (2009) Palmitoylation of ATP-binding cassette transporter A1 is essential for its trafficking and function. Circulation research 105: 138–147. [DOI] [PubMed] [Google Scholar]
- 52. Batistic O, Rehers M, Akerman A, Schlucking K, Steinhorst L, et al. (2012) S-acylation -dependent association of the calcium sensor CBL2 with the vacuolar membrane is essential for proper abscisic acid responses. Cell research 22: 1155–1168. [DOI] [PMC free article] [PubMed] [Google Scholar]
- 53. Sorek N, Bloch D, Yalovsky S (2009) Protein lipid modifications in signaling and subcellular targeting. Current opinion in plant biology 12: 714–720. [DOI] [PubMed] [Google Scholar]
- 54. Adjobo-Hermans MJ, Goedhart J, Gadella TW Jr (2006) Plant G protein heterotrimers require dual lipidation motifs of Galpha and Ggamma and do not dissociate upon activation. Journal of cell science 119: 5087–5097. [DOI] [PubMed] [Google Scholar]
- 55. Hemsley PA, Grierson CS (2008) Multiple roles for protein palmitoylation in plants. Trends in plant science 13: 295–302. [DOI] [PubMed] [Google Scholar]
Associated Data
This section collects any data citations, data availability statements, or supplementary materials included in this article.
Supplementary Materials
Putative DHHC-Cysteine-Rich Domain S-Acyltransferase in Plants.
(XLS)


