Abstract
Varying geometry and layout of microposts on a cell culture substrate provides an effective technique for applying mechanical stimuli to living cells. In the current study, the optimal geometry and arrangement of microposts on the polydimethylsiloxane (PDMS) surfaces to enhance cell growth behavior were investigated. Human bone marrow derived connective tissue progenitor cells were cultured on PDMS substrates comprising unpatterned smooth surfaces and cylindrical post microtextures that were 10 µm in diameter, 4 heights (5, 10, 20 and 40 µm) and 3 pitches (10, 20, and 40 µm). With the same 10 µm diameter, post heights ranging from 5 to 40 µm resulted in a more than 535000 fold range of rigidity from 0.011 nNµm−1 (40 µm height) up to 5888 nNµm−1(5 µm height). Even though shorter microposts result in higher effective stiffness, decreasing post heights below the optimal value, 5 µm height micropost in this study decreased cell growth behavior. The maximum number of cells was observed on the post microtextures with 20 µm height and 10 µm inter-space, which exhibited a 675% increase relative to the smooth surfaces. The cells on all heights of post microtextures with 10 µm and 20 µm inter-spaces exhibited highly contoured morphology. Elucidating the cellular response to various external geometry cues enables us to better predict and control cellular behavior. In addition, knowledge of cell response to surface stimuli could lead to the incorporation of specific size post microtextures into surfaces of implants to achieve surface-textured scaffold materials for tissue engineering applications.
Keywords: Surface topography, Micropost Geometry, Soft Lithography, Connective Tissue Progenitor Cells, Osteogenesis, Adult Stem Cells
1 INTRODUCTION
In many tissue engineering applications, combining cells with a scaffold to enhance regeneration in tissue grafting procedures involves rapid concentration and selection of the cell population into the graft using selective attachment to a matrix surface (Muschler et al. 2010; Shinohara et al. 2011). At the cell-surface interface, both an appropriate physicochemical environment and the surface topography profoundly affect the overall behavior of the engineered tissue (Nasatzky et al. 2003). The generation of surface topographies at the cellular level influences cell shape and modifies gene activity. Consequently, the incorporation of micro-and nanoscale topographies at the cell-substrate interface might provide an attractive approach to enhancing specific cell behaviors without destabilizing the delicate biochemical environment.
The surface topographical characteristics have important implications in the design and optimization of biological implants. To address the need for precise and controlled cell guidance, there has been increased interest in the application of microfabrication and micromachining technologies to tissue engineering. Microfabrication technology closely parallels the multidimensional size scale of living cells, and therefore might be exploited to provide tissue engineering scaffolds that possess topographical, spatial, and chemical properties to optimize control over cell behavior. This technology has been used to create microtextures with different geometries including posts, channels, holes, and pyramids that have been reported to significantly affect cell growth behavior (Hamilton et al. 2006, 2007a, 2007b; Lincks et al. 1998; Boyan et al. 1998, 2001; Lohmann et al. 2002; Schneider et al. 2004; Zhao et al. 2006; Dalby et al. 2007; Dickinson et al. 2012; Kim et al. 2010).
In particular, a number of research groups (Hamilton et al. 2007a, 2007b; Dalby et al. 2007; Dickinson et al. 2012; Kim et al. 2010) have selected microposts that were of particular diameter-to-height ratios (e.g. 1:1, 2:1, 1:2, and 1:4) and dimension-inter space ratios (e.g. 1:1, 1:2, and 1:4) and showed that different micropost geometries influence cell behavior. In a previous study from our group (Mata et al. 2002), human bone marrow-derived connective tissue progenitor cells (CTPs) were cultured for 9 days on smooth polydimethylsiloxane (PDMS) surfaces and on PDMS post microtextures that were 6 µm high and 5, 10, 20 and 40 µm in diameter. PDMS is a silicone elastomer that has been used extensively in medical implants and biomedical devices because of its biocompatibility, and practicability for fabrication that can conform to microscale features to develop microstructures (Kim et al. 2010; Mata et al. 2002). It was discovered that cells on PDMS post microtextures exhibited different morphology and increased cell count relative to those on smooth PDMS surface. In particular, these investigations showed that 10 µm diameter post textures significantly enhanced CTP growth (Mata et al. 2002). This result suggested that despite identical surface chemistry, the varying size of microposts on the substrate surface had a significant effect on the biological performance of cells, and suggested a potential role for microtextured surfaces of materials in tissue engineering applications.
CTPs refer to a heterogeneous population of stem and progenitor cells that are resident in native tissue (Mata et al. 2002; Muschler et al. 2010). These cells are capable of proliferating and giving rise to progeny, which contribute directly to the formation of one or more connective tissues. Harvest and transplantation, and even concentration, of CTPs from native bone marrow have been known to improve bone graft efficiency. A characteristic of many marrow derived CTPs is their ability to give rise to progeny that are capable of differentiating along a number of mesenchymal lineages including bone, cartilage, muscle and fat (Mata et al. 2002).
The purpose of this study is to further investigate the relationship between geometry and arrangement of microposts on the PDMS surfaces for the design of implant surfaces for tissue engineering applications. In this study, the 10 µm diameter micropost with varying height (5, 10, 20 and 40 µm) and inter-space (10, 20, and 40 µm) parameters were fabricated using microfabrication techniques, and human bone marrow derived CTPs were cultured on these PDMS substrates in order to establish most favorable micropost dimensions for cell growth.
2 MATERIALS AND METHODS
2.1 Experimental design
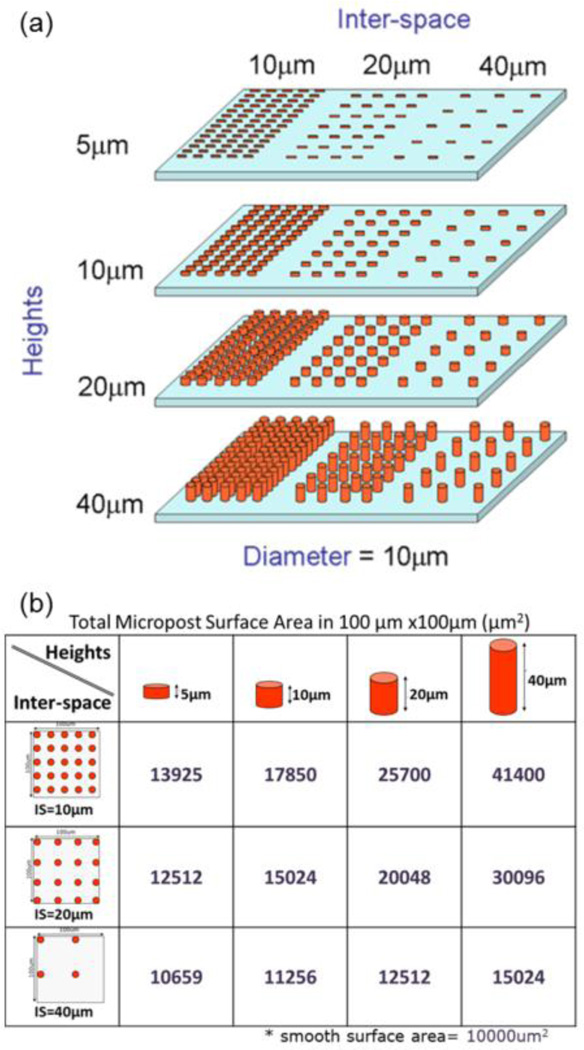
Bone marrow derived CTPs were cultured on PDMS substrates comprising unpatterned smooth surfaces and cylindrical post microtextures that were 10 µm in diameter, 4 different heights (5, 10, 20 and 40 µm) and 3 different inter-spaces (10, 20, and 40 µm) (Table 1 and Fig. 1). The microtextured PDMS substrates were produced using soft lithography, which has been derived from microfabrication and micromachining techniques commonly used to produce microelectromechanical (MEMS) devices. CTPs were plated on the substrates, cultured for 9 days, fixed, analyzed using fluorescent and scanning electron microscopy (SEM), and tested for proliferation using PicoGreen DNA quantification. Each experiment was repeated three times and the results were compared to those from cells grown on smooth surfaces of PDMS.
Table 1.
Post microtextures ratios with varying geometry and arrangement.
| Diameter (D) | Height (H) | Inter-space (Is) | D:H:Is ratio |
|---|---|---|---|
| 10 µm | 5 µm | 10 µm | 1:0.5:1 |
| 20 µm | 1:0.5:2 | ||
| 40 µm | 1:0.5:4 | ||
| 10 µm | 10 µm | 1:1:1 | |
| 20 µm | 1:1:2 | ||
| 40 µm | 1:1:4 | ||
| 20 µm | 10 µm | 1:2:1 | |
| 20 µm | 1:2:2 | ||
| 40 µm | 1:2:4 | ||
| 40 µm | 10 µm | 1:4:1 | |
| 20 µm | 1:4:2 | ||
| 40 µm | 1:4:4 |
Fig. 1.
PDMS post microtextures with varying geometry and arrangement. Cylindrical post microtextures that were 10 µm diameter, 4 different heights (5, 10, 20 and 40 µm) and 3 different inter-spaces (10, 20, and 40 µm) were (a) designed. (b) Theoretical total surface area of post microtextures in 100 µm × 100 µm square.
2.2 Substrate preparation
Control of post heights
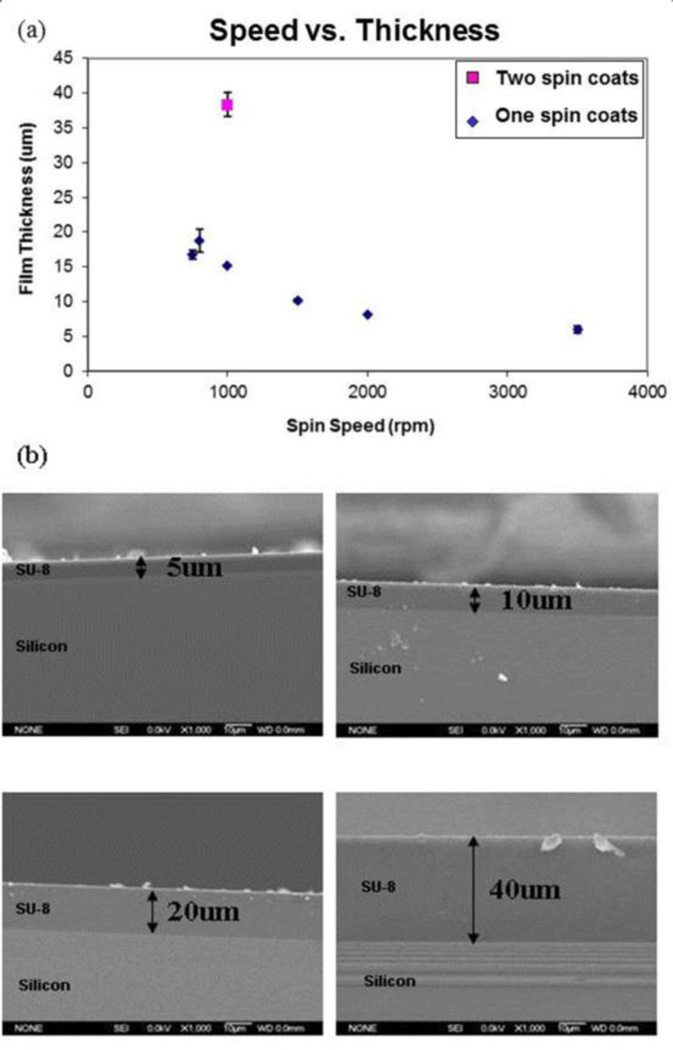
To obtain appropriate micropost heights (5, 10, 20 and 40 µm), SU-8 2010 was spin-coated onto a silicon wafer at different speeds (Fig. 2) using a Karl Suss RC8 spinner (Suss MicroTec, Waterbury, VT), then soft baked, exposed, and post exposure baked. Thickness measurements of the SU-8 layers were verified using SEM (JSM-5310, JEOL USA, Peabody, MA).
Fig. 2.
Control the thickness of SU-8 layers. (a) To obtain appropriate micropost heights (5, 10, 20 and 40 µm), SU-8 2010 was spin coated onto a silicon wafer with an optimal speed. (b) Cross-section of SU-8 which was spin coated onto silicon wafer. Thickness of the SU-8 layers was verified using SEM.
Control of post interspace
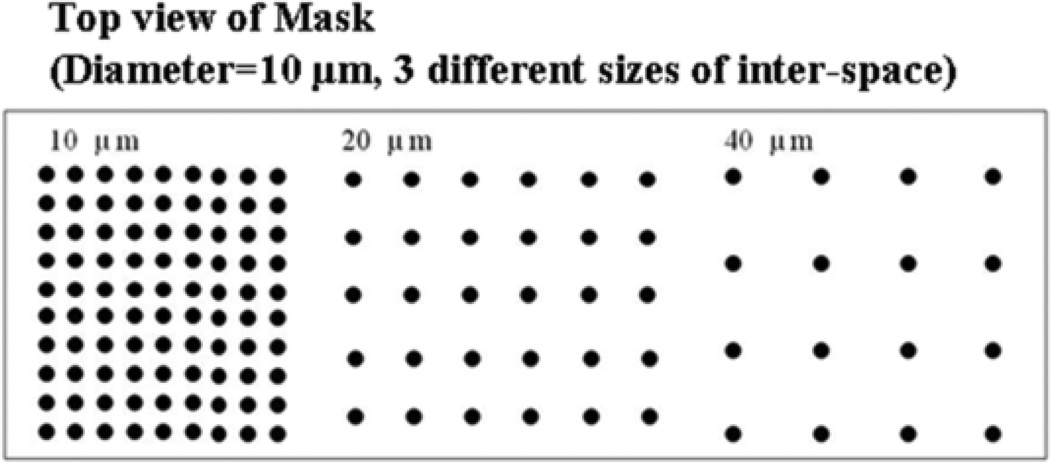
To design the patterns with varying inter-space (10, 20 and 40 µm) dimensions between posts, a computer-aided design program (MEMS Pro V5.1; L-Edit, SoftMEMS LLC, Santa Clara, CA) was used (Fig. 3). Substrate patterns were designed to study preferential cell growth on different arrangements of post microtextures.
Fig. 3.
Pattern layout on the photomask for the pattern with varying inter-space (10, 20 and 40 µm) dimensions between posts. Dark regions correspond to chrome (opaque) regions on the photomask, and light regions correspond to regions transparent to UV exposure.
Microfabrication of PDMS substrates
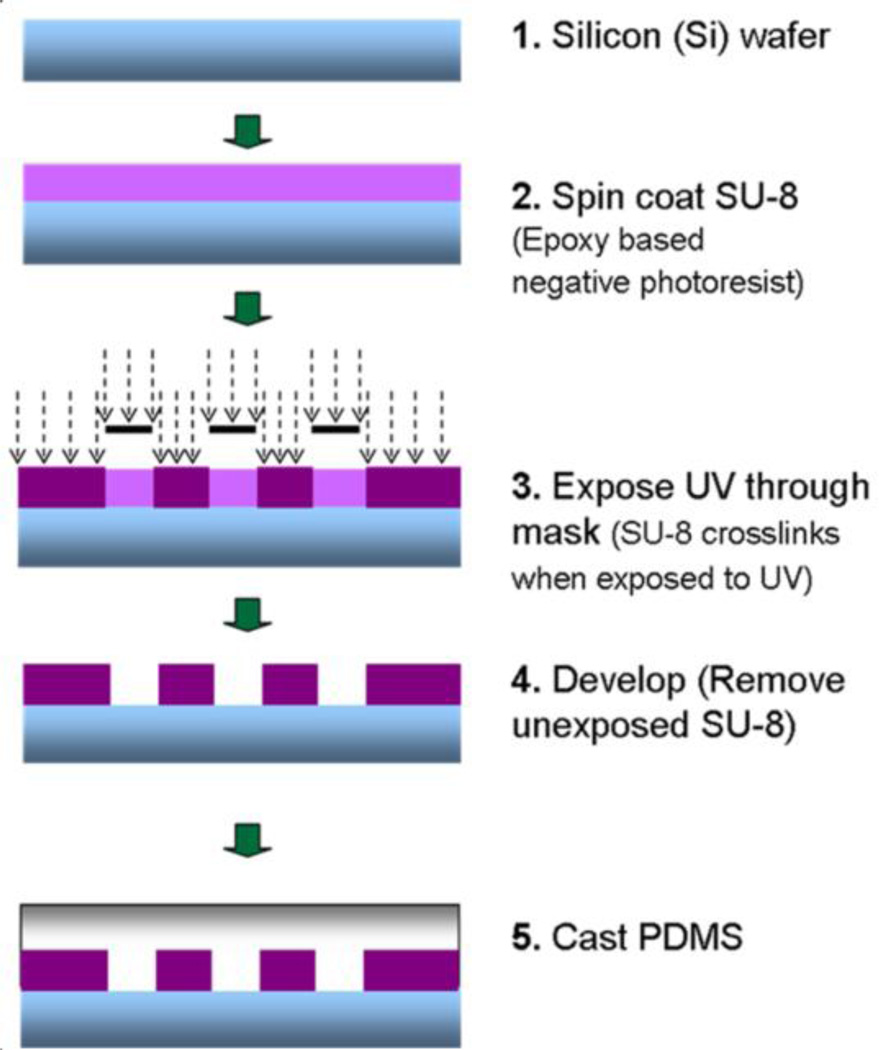
The microfabricated PDMS substrates were produced using soft lithography techniques (Fig. 4). Briefly, various film thicknesses (5, 10, 20 and 40 µm) of SU-8 2010 photoresist were spin-coated on top of silicon wafers at different optimal speeds using a spinner. By using ultraviolet (UV) exposure, the post microtexture patterns with varying inter-space (10, 20 and 40 µm) dimensions were transferred from a photomask onto the photoresist, and then developed. The liquid PDMS base and curing agent (Sylgard 184; Dow Corning) components were mixed at a ratio of 10:1, degassed for 20 min, and then poured uniformly on top of the patterned mold. The PDMS substrates were cured at 85°C for 2 h. Unpatterned SU-8 was used to produce the smooth PDMS substrates. The cured PDMS casts were released from the mold and representative samples were inspected by SEM (Fig. 5).
Fig. 4.
Fabrication of PDMS post microtextures by soft lithography. Briefly, various film thicknesses (5, 10, 20 and 40 µm) of SU-8 2010 photoresist were spin coated on top of silicon wafers at different optimal speeds. By using UV exposure, the post microtexture patterns with varying inter-space (10, 20 and 40 µm) dimensions were transferred from a photomask onto the photoresist, and then developed. The liquid PDMS were mixed at a ratio of 10:1, degassed for 20 min, and then poured uniformly on top of the patterned mold. The PDMS substrates were cured at 85°C for 2 h.
Fig. 5.
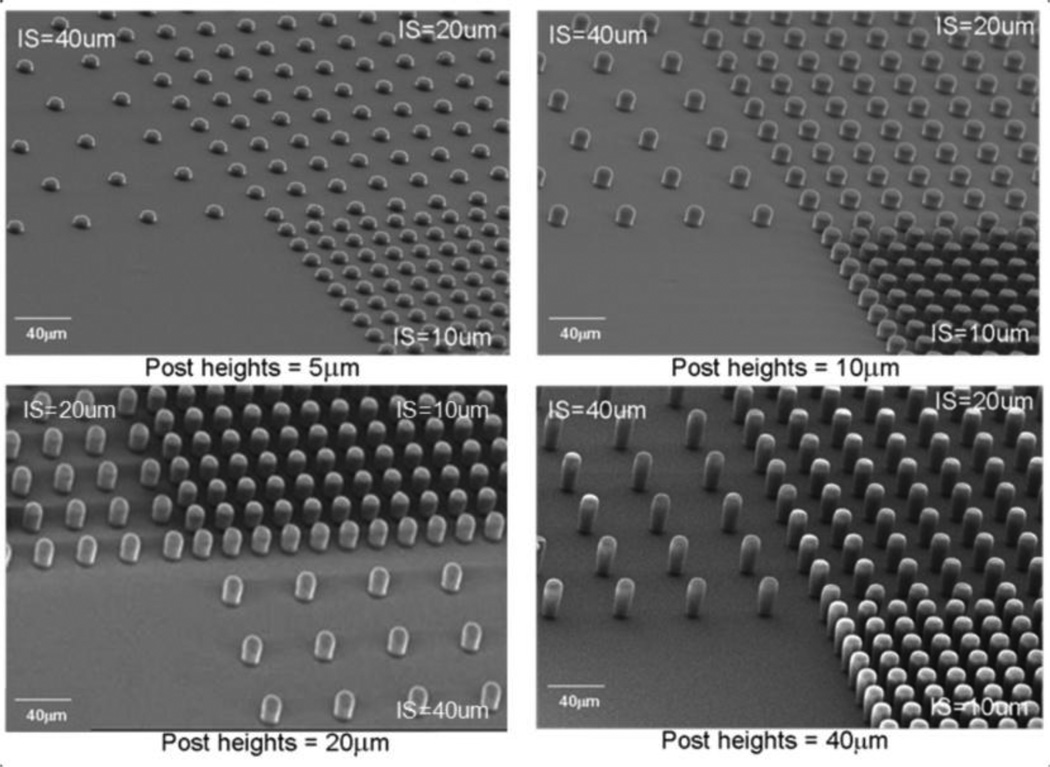
SEM images of PDMS post microtextures of 10 µm diameter, and 5 µm, 10 µm, 20 µm, and 40 µm heights with the 10 µm, 20 µm, and 40 µm separation (IS=inter-spaces) between the posts.
2.3 Finite element method characterization of effective stiffness of PDMS microposts
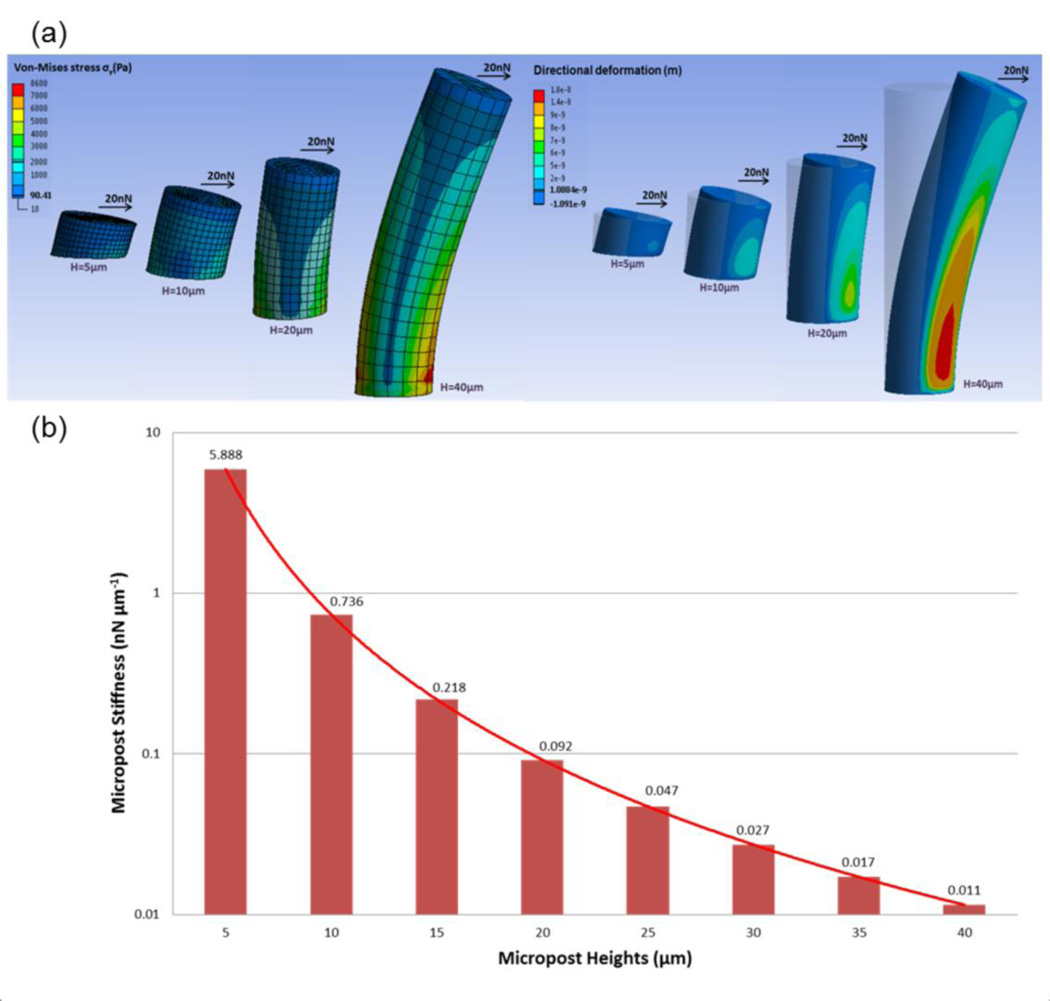
The commercial ANSYS (V14.0, ANSYS Inc., Canonsburg, PA) modeling and simulation software was used to analyze deflections of the PDMS microposts under different applied horizontal traction forces (Fig. 6). The PDMS micropost was modeled as a hyperelastic cylinder with a Young’s modulus, E, of 0.5MPa and was discretized into hexahedral mesh elements (Fu et al. 2010). The bottom surface of the micropost was assigned fixed boundary conditions. A horizontal load, F, was then applied uniformly at all of the nodes on the top surface of the micropost and values of Von Mises stress were calculated. Finite element method (FEM) analysis was performed to determine displacement of center node on the top surface of the post owing to F. To measure micropost rigidity, K, we compared the FEM calculations of K as a function of H with the Euler-Bernoulli beam theory approximation where K=3πED4/64H3 because the Euler-Bernoulli theoretical predictions have previously compared well with the FEM analysis for post height, H, greater than 5µm (Fu et al. 2010).
Fig. 6.
PDMS micropost arrays to engineer substrate stiffness. (a) Graphical depiction of finite-element method (FEM) analysis of micropost of heights (H) each bending in response to applied horizontal traction force (F) of 20nN. (b) Normal spring constant (K) as a function of H, as computed from FEM analysis (bars) and from Euler-Bernoulli beam theory (curve). K measures micropost stiffness (rigidity).
2.4 Cell culture and analyses
Cell culture
Bone marrow aspirates were harvested from the anterior iliac crest with informed consent from four patients immediately prior to elective orthopedic procedures (Muschler et al. 2001). Briefly, 2 mL samples of bone marrow were aspirated from the anterior iliac crest into 1 mL of saline containing 1000 units of heparin (Vector, Burlingame, CA). The heparinized marrow sample was suspended into 20 mL of heparinized carrier media (α-minimal essential medium (α-MEM) + 2 units/mL of Na-heparin; Gibco, Grand Island, NY) and centrifuged at 1500 rpm for 10 min. The buffy coat was collected, resuspended in 20 mL of 0.3% bovine serum albumin-MEM (Gibco), and the number of nucleated cells was counted. The PDMS substrates were sterilized for 30 min with 70% ethanol. Cells were then plated on Day 0 at a seeding concentration of 1 × 10⁶ cells per well and were cultured for 9 days under conditions promoting osteoblastic differentiation (Kim et al. 2010). Cell characteristics on all substrates were investigated using SEM, PicoGreen DNA quantification, and fluorescent stains. The PicoGreen DNA quantification was repeated 3 times.
Scanning Electron Microscopy
After the cells were cultivated for 9 days, the media was removed and the plated substrates were placed in a solution containing 2% glutaraldehyde (Electron Microscopy Sciences, Fort Washington, PA), 3% sucrose (Sigma-Aldrich Co., Irvine, UK) and 0.1 M of PBS at 4°C and pH 7.4. After 1 h, the substrates were rinsed twice with PBS for 30 min at 4°C and washed with distilled water for 5 min. Dehydration was achieved by placing the plated substrates in 50% ethanol for 15 min while increasing the concentration of ethanol to 60, 70, 80, 90 and finally 100%. Dehydrated samples were then mounted on aluminum stubs, sputter-coated with gold-palladium, and examined using SEM.
PicoGreen DNA Quantification
CTP-seeded PDMS substrates were resuspended in 50 µl of lysis buffer (1% sodium dodecyl sulfate, 10 mM ethylenediaminetetraacetic acid (EDTA) and 50 mM Tris-HCl, pH 8.1) to lyse the membranes of adherent CTP progeny. After 60 min, the samples were centrifuged at 14,000 rpm for 5 min and the supernatant was removed for analysis. A 40 µL sample of aqueous supernatant containing DNA was added to 0.96 mL TE buffer (10 mM Tris adjusted to pH 7.0 with HCl, 1 mM EDTA). As per the manufacturer’s instructions (Molecular Probes, Eugene OR), stock PicoGreen reagent was diluted 1:200 in TE buffer and 1 ml of that was added to each DNA containing sample. The tubes were capped, vortexed, and incubated at room temperature in the dark room for 3 min. The fluorescence was measured with a SpectraMax Gemini fluorescence microplate reader (Molecular Devices Co., Sunnyvale, CA) at excitation and emission wavelengths of 480 and 520 nm, respectively. All calibration samples were assayed four times and a fresh calibration curve was generated for each 96 well plate. Baseline fluorescence was determined with a TE blank, the average of which was subtracted from the averaged fluorescence of other samples. Using this analysis, we determined that ~4.5 µg of DNA in 1 × 10⁶ adherent CTPs. Thus, we assumed that one cell has ~4.5 pg of DNA, and estimated the number of cells for each sample. Because individual donors differed with respect to the initial prevalence of CTPs, the cell count on the substrates were normalized to the control surfaces for each donor within the particular experiment. The PicoGreen DNA quantification repeated a total of 9 times (replicates of 3 times of the each 3 patients; n=9/substrate) as per our standard lab protocols (n = 9/group; mean + SE).
Immunohistochemistry
Cell nuclei were stained with 6-diamidino-2-phenylindole dihydrochloride hydrate (DAPI). Ethanol-fixed cells were rinsed three times with phosphate buffered saline (PBS), and then a 10 µL drop of DAPI-containing Vectashield mounting media (Vector Labs, Burlingame, CA) was placed on the scaffolds. Immediately thereafter, the edges of the coverslips were sealed with three coats of clear nail polish and viewed under a fluorescent microscope (Olympus BX50F, Olympus Optical Co., Japan). After DAPI staining, the same samples were again stained in situ for alkaline phosphatase (AP), using the Vector Red substrate, working solution (5 ml of 100 mM Tris-HCl adding 2 drops of Reagent 1, 2 and 3) for 30 min at room temperature in the dark, and then, washed in distilled water. The positively stained cells with AP activity appeared red when viewed under a fluorescent microscope.
2.5 Statistical Analysis
The mean and standard deviation values were calculated using the data of all groups. All data was subjected to analysis of variance (ANOVA) and Tukey testing where appropriate (SPSS Version 10.0., SPSS INC., Chicago, IL). Significance levels were set at p < 0.05.
3 RESULTS
3.1 PDMS micropost arrays to engineer substrate stiffness
Figure 6(a) presents the graphical depiction of FEM analysis of micropost of heights (H) each bending in response to a horizontal traction force (F) of 20nN applied at the top of the micropost. Post height determines the degree to which a post bends in response to a horizontal traction force.
The effective stiffness of a micropost can be geometrically tuned by adjusting the height of the micropost. We characterized micropost rigidity by computing the nominal spring constant, K, using the FEM analysis (Fig. 6(b)). As such, K is a measure of micropost stiffness. The PDMS micropost arrays with a post diameter of 10 µm and post heights ranging from 5 to 40 µm resulted in a more than 535000 fold range of rigidity from 0.011 nNµm−1 (H= 40 µm) up to 5888 nNµm−1(H= 5 µm).
3.2 Cell morphology
Fabricated PDMS post microtextures that are 10 µm diameter, and 5 µm, 10 µm, 20 µm, and 40 µm heights with the 10 µm, 20 µm, and 40 µm separation (inter-spaces) between the posts were confirmed by SEM examinations (Fig. 5).
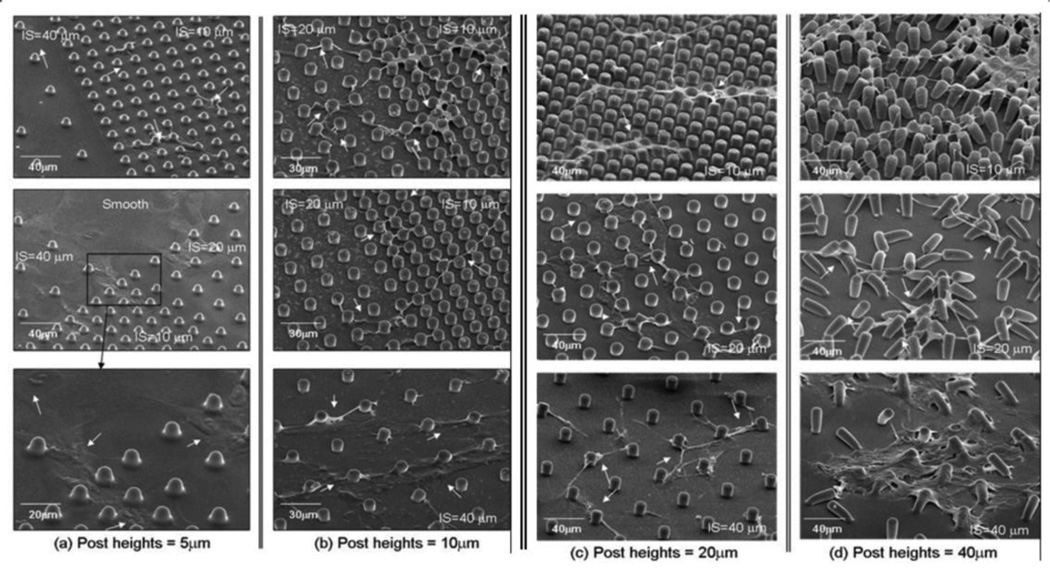
CTPs attached and proliferated on all PDMS post microtextures and smooth surfaces (Fig. 7 and Fig. 8). On post microtextures, cells migrated within the posts exhibiting narrower shapes and higher contours than cells on smooth surfaces. The cells on all heights of post microtextures with 10 µm and 20 µm inter-spaces tended to attach next to the posts and spread between and top of them, exhibited highly contoured morphology, and directed their long processes towards posts and other cells (Fig. 7 and Fig. 8). However, the morphology of cells grown on all heights of post microtextures with 40 µm inter spaces was different from those on the other post microtextures and exhibited similar shape to cells on smooth surfaces. More specifically, cells on post microtextures with 40 µm heights pulled and bent posts around cells, and furthermore, cell morphology on post microtextures with 40 µm heights and 40 µm interspaces exhibited similar shape to cells on smooth surfaces on Day 9 (Fig. 7(d) and Fig. 8(d)). Cells on smooth surfaces appeared to anchor to random locations on the surface as they migrated and cell bodies adopted a broad flattened shape.
Fig. 7.
SEM images showing morphology of cells grown on the PDMS post microtextures that are 10 µm diameter, (a) 5 µm, (b) 10 µm, (c) 20 µm, and (d) 40 µm heights with the 10 µm, 20 µm, and 40 µm separation (IS=inter-spaces) between the posts. On Day 9, cells on post microtextures tended to attach next to the posts and spread between them while directing their processes towards posts and other cells (white arrows). Regardless post heights, the narrowest processes were observed on cells cultured on the post microtextures with 10 µm IS, in which individual cells tended to grow between and along the array of posts. On the smooth surfaces and post microtextures with 40 µm IS, cell bodies adopted a broad flattened shape and appeared to anchor to random locations on the surface as they migrated.
Fig. 8.
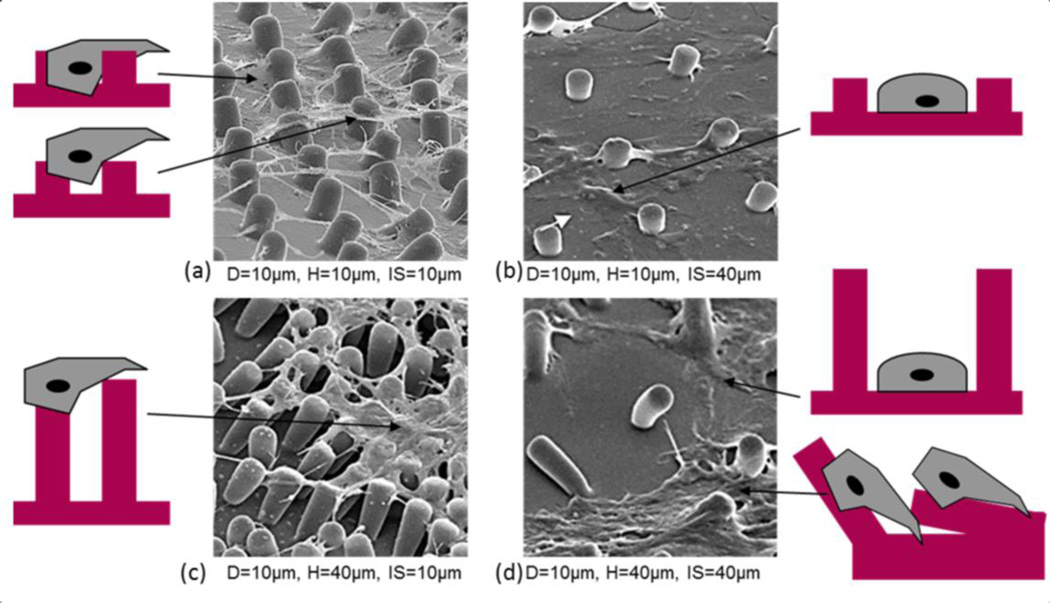
Cell morphology with PDMS post microtextures that are 10 µm diameter (D), 10 µm and 40 µm inter-space (IS) between the posts with the 10 µm and 40 µm heights (H). (a) CTPs on 10 µm height of post microtextures with 10 µm inter-spaces interact with the bottom of the microtextures as well as with the sides. Cells tended to attach next to the posts and spread between and top of them, exhibited highly contoured morphology, and directed their long processes towards posts and other cells. (b) On the 10 µm height micropost with 40 µm inter-spaces, cells are likely to have contact to only one micropost side and the bottom at the same time. The morphology of cells grown on the microposts showed to anchor to random locations and cell bodies adopted a broad flattened shape. (c) Cells on post microtextures with 40 µm heights and 10 µm inter-spaces attach and spread on the top of the them, and pulled posts around cells. (d) Cell morphology on post microtextures with 40 µm heights and 40 µm inter-spaces bent posts around cells and exhibited similar shape to cells on smooth surfaces that appeared to anchor to random locations on the surface as they migrated and cell bodies adopted a broad flattened shape.
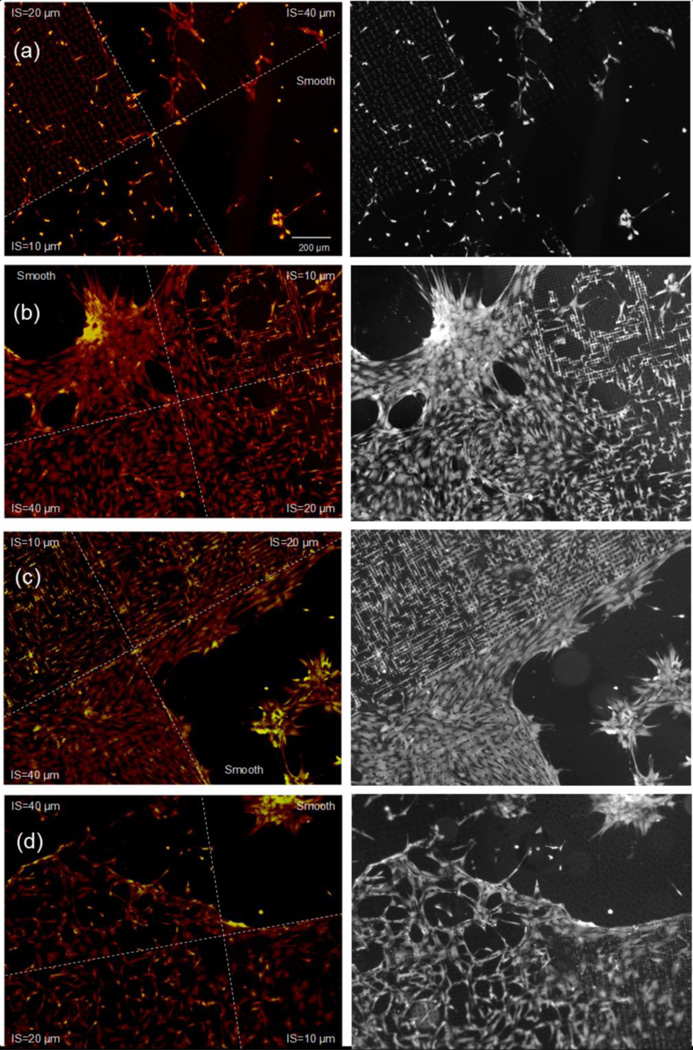
At the interface between post microtextures and smooth surfaces, cells were observed to attach to the posts and stay within the posts. This behavior is confirmed in bright-field images of Fig. 9 clearly shows the preference of cells to stay and grow on the post microtextures that have 10 µm, 20 µm and 40 µm inter-spaces compared to the smooth surfaces.
Fig. 9.
Fluorescent microscopy (Red) and bright-field (Grey) images of CTPs near the interface between a smooth surface and PDMS post microtextures that are 10 µm diameter, the 10 µm, 20 µm, and 40 µm separation (inter-spaces: IS) between the posts with the (a) 5 µm, (b) 10 µm, (c) 20 µm and (d) 40 µm height. More cells attached and proliferated on the post microtextures compared to cells on smooth surfaces. On Day 9, more cells stained intensely for DAPI (yellow) and AP (red) on the post microtextures compared to cells on smooth surfaces.
3.3 Alkaline phosphatase expression
Cells on all substrates stained positive for AP (red color), which is used as an early marker of osteoblastic differentiation (Fig. 9). In our previous study (Kim et al. 2010), it was revealed that the higher cell number resulted in their early confluence and stimulation of osteogenic differentiation as well as AP expression. Likewise, the intensity of the AP stain in this study is proportional to proliferated cell numbers, and furthermore, cells on the all post microtextures stained more intensely for AP compared to smooth substrates on Day 9.
3.4 Cell proliferation
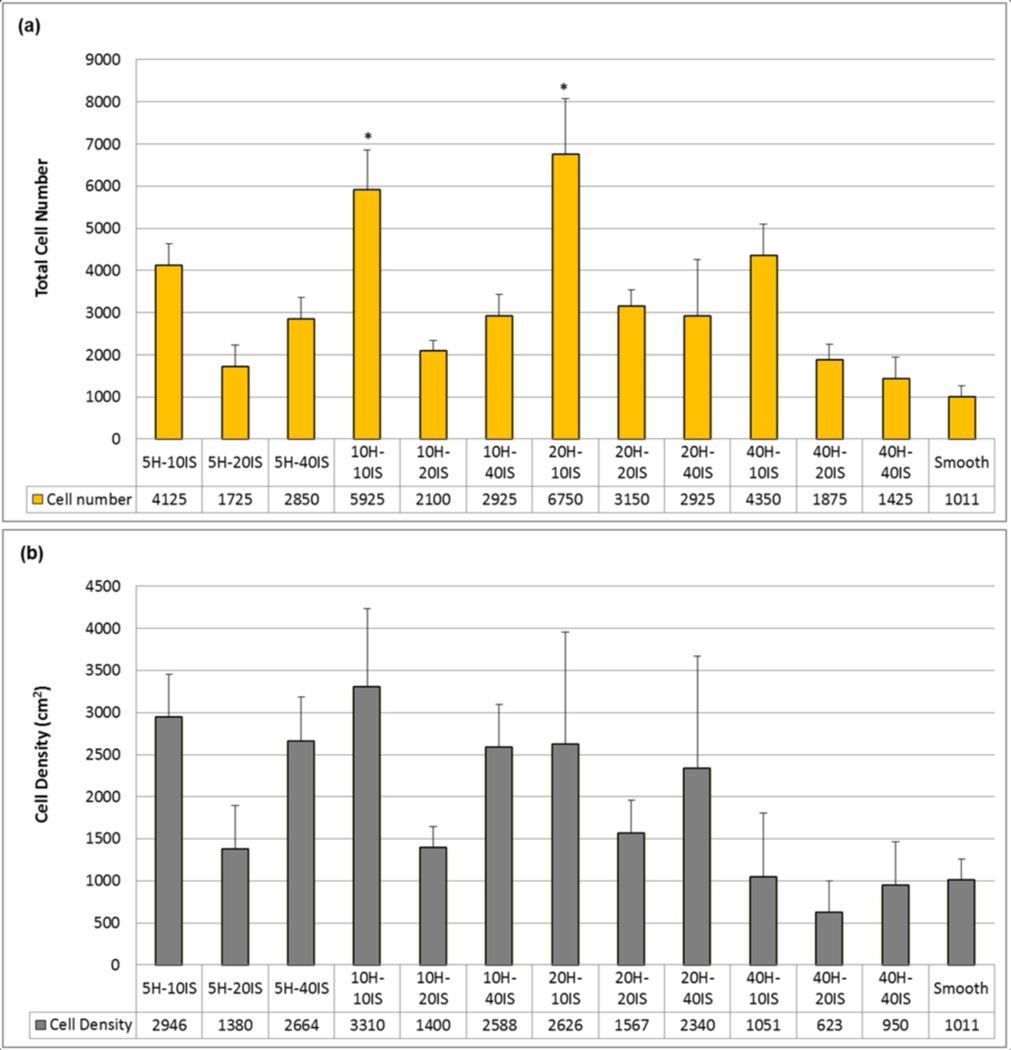
CTPs attached, and proliferated on all PDMS substrates. All post microtextures had increased numbers of cells compared to the smooth surfaces, as illustrated in Fig. 10(a). The maximum number of cells was observed on the post microtextures with 20 µm height and 10 µm inter-space (20H-10IS), which was almost seven fold (675%) greater relative to the smooth surfaces (100%) (p < 0.05). Among the post microtextures with same height and different interspaces, 10 µm inter-space (10IS) showed highest cell numbers. Among the post microtextures with same inter-space and varying heights, post with 20 µm height (20H) showed maximum cell numbers.
Fig. 10.
CTP proliferation on PDMS post microtextures and corresponding smooth surfaces after 9 days of culture. (a) All post microtextures had increased numbers of cells compared to the smooth surfaces. The maximum number of cells was observed on the post microtextures with 20 µm height (H) and 10 µm inter-space (IS) (20H-10IS), compared with the number of those on the smooth surfaces (p < 0.05). For the same height, post microtextures with 10 µm inter-space have shown highest cell numbers. For the same inter-space, post microtextures with 20 µm height have shown highest cell numbers. (b) Post microtextures with 10 µm height and 10 µm inter-space (10H-10IS) have shown cell numbers normalized to surface area that are nearly three times greater than that on the smooth surface, while 40 µm height and 20 µm inter-space (40H- 20IS) post microtextures exhibited the lowest cell number/unit area. For the same height, post microtextures with 10 µm and 40 µm inter-spaces have shown higher cell numbers while 20 µm inter-space have shown lowest cell numbers. For the same inter-space, post microtextures with 40 µm height have shown lowest cell numbers. * denotes statistical significance compared to other surfaces (p < 0.05).
The cell number normalized for surface area on the post microtextures with 10 µm heights and 10 µm inter-spaces (10H-10IS) was over three fold (330%) greater than the control smooth surface (100%), while 40 µm height and 20 µm inter-space (40H-20IS) post microtextures exhibited the lowest cell number (62%) (Fig. 10(b)). For the same height, post microtextures with 10 µm inter-space (10IS) showed greater normalized cell numbers while 20 µm inter-space (20IS) showed lowest cell numbers. For the same inter-space, post microtextures with 10 µm height (10H) exhibited highest normalized cell numbers, while post microtextures with 40 µm height (40H) showed lowest cell numbers.
4 DISCUSSION
CTP culture on post microtextures with varying geometry and arrangement can result in the modification of cell morphology and proliferation as well as the potential to enhance early osteogenesis. Specifically, cells on post microtextures with 20 µm height and 10 µm inter-space exhibited higher cell number compared to other microposts with different size of heights or interspaces, and smooth surfaces. The optimal aspect-ratio of microposts on a substrate surface could be utilized to investigate the effect of the geometric control on many other cellular activities, such as cell motility, cell proliferation, and stem cell differentiation (McBeath et al. 2004). Thus, the criterion to determine the optimal aspect-ratio of the microposts is important, and therefore should be considered very carefully.
We postulate that the impact of topography depends on the pattern dimensions with respect to the cell size. The cell body of human CTP has a diameter of approximately 8–10 µm when not spread, which matches the 10 µm inter-space of the microposts that most strongly influences cell response (Fig. 10(a)). On the micropost with 10 µm height and 10 µm inter-space, cells have the greatest cell-surface contact area, as they interact with the bottom of the microtextures as well as with the sides (Fig. 8(a)). This consequently makes the establishment of cell-substrate contacts more likely in the 10 µ m inter-space compared to the other structures. However, the height of micropost increased, while maintaining optimal inter-space, cells only attached on the top and did not migrate to the bottom (Fig. 8(c)). On the patterned substrates with larger inter-space, 40 µm, cells are likely to have contact to only one micropost side and the bottom at the same time (Fig. 8 (b) and (d)). Therefore, those cells do not only have a larger part of their surface in contact with the substrate but also have a longer residence time to establish adhesive contacts and corresponding cell proliferation (Schulte et al. 2010).
Surface post microtextures should provide a large number of extracellular matrix (ECM) and cytoskeleton contacts to cells to perform tissue-specific function. The Chen group has investigated human mesenchymal stem cells on the different sizes of micropatterns, and found that cells occupying the larger ECM and cytoskeleton contacts underwent osteogenesis, while cells on small ECM and cytoskeleton contacts appeared more adipogenic (Fu et al. 2010; McBeath et al. 2004). In general, post microtextures have increased surface areas and adhesions with more ECMs compared to smooth surface (Schulte et al. 2010; McBeath et al. 2004). For example, the surface area of post microtextures with 10 µm diameter and 10 µm height, with 10 µm inter-space between posts was 1.8 times greater than that of the smooth surface (Fig. 1(b)). However, larger-than-optimal inter-space separation causes small surface adhesions with ECM and corresponding less cell proliferation (Fig. 10). For example, surface area of our post microtextures with 10 µm diameter and 10 µm height, with 40 µm inter-space between posts was only 1.1 times greater than that of the smooth surface (Fig. 1(b)). Moreover, in our study, the morphology of cells grown on the post microtextures with 40 µm inter-space was different from those on the post microtextures with 10 µm and 20 µm inter-spaces, but exhibited similar cell morphology as on smooth surfaces (Fig. 8(d)). Similarly, Turner et al. reported that the larger-than-optimal size of microarray features stimulated the same response as the smooth surfaces (Turner et al. 2000).
It is known that changing micropost height effectively varies surface stiffness without altering the bulk mechanical properties or the surface chemistry of the material used to fabricate the substrate (Fig. 6) (Schulte et al. 2010; McBeath et al. 2004; Sochol et al. 2011; Tan et al. 2003; Turner et al. 2000). As long with our data, Tan et al. and Sochol et al. demonstrated that PDMS microposts of different dimensions, such as diameter and height, expressed a range of stiffness values (Tan et al. 2003; Sochol et al. 2011). Because the stiffness of microposts varies as the inverse cube of their height, decreasing the height by half results in a local change in effective stiffness by 8-fold (Fig. 6(b)). Theoretically, shorter microposts result in higher effective stiffness, which in turn, allows for the acceleration of cell growth (Tan et al. 2003; Sochol et al. 2011; Schrader et al. 2011). However, decreasing post heights below the optimal value (smaller height than cell size and 5 µm height micropost in this study), causes fewer adhesions with ECM, and subsequent decreased cell growth behavior (Schulte et al. 2010; McBeath et al. 2004; Sochol et al. 2011; Tan et al. 2003; Turner et al. 2000).
The present study demonstrates the applicability of microposts on substrates for modifying CTP behavior. These findings are of importance in that biomaterials for tissue engineering scaffolds should be designed to control the spatial organization of attached cells in order to direct specific tissue structures (Schrader et al. 2011; Chen et al. 2005). The incorporation of microscale topographies at the cell–substrate interface can provide an attractive approach to enhance specific cell behavior without destabilizing the delicate biochemical environment. However, the intercellular and intracellular mechanisms by which cell behavior changes in response to different geometrical surface topography stimuli remain unclear (Schrader et al. 2011; Tan et al. 2003; Turner et al. 2000). Further investigation is needed to elucidate all of the possible factors and establish definitive mechanistic links between cell-surface interactions and cell growth characteristics.
5 CONCLUSIONS
Varying geometry and arrangement of microposts provide an effective technique for engineering the mechanical properties of discrete, microscale substrate features via simple, accurate, and repeatable fabrication processes. As a method for investigating the cellular response to substrate mechanical cues, varying micropost geometries offer a simple, yet powerful technique for applying mechanical stimuli to living cells. Elucidating the cellular response to various external geometry cues enables us to better predict and control cellular behavior. The present study is unique not only in designing post microtextures with varying geometry and arrangement, but also in comparing CTP growth behavior on the microposts and in establishing optimal micropost sizes. In this study, the cell quantification on post microtextures demonstrates that a small change in geometry of surface post microtextures can have either small or dramatic effects on cell behavior. For example, increasing micropost height from 20 µm to 40 µm can change cell morphology and 35 % decrease in cell number for microposts with the same diameter and inter-space values. Also, the maximum number of cells was observed on the post microtextures with 20 µm height and 10 µm inter-space, which exhibited almost seven fold (675%) increase relative to the smooth surfaces. Therefore, there is great value in using microfabrication techniques in the production of scaffolds to obtain precise and optimal surface post microtextures that can selectively stimulate specific cell behavior. Knowledge of cell response to surface stimuli could lead to the incorporation of specific size post microtextures into surfaces of implants to achieve surface-textured scaffold materials for tissue engineering applications.
REFERENCES
- Boyan B, Batzer R, Kieswetter K, Liu Y, Cochran D, Szmuckler-Moncler S, Dean D, Schwartz Z. J. Biomed. Mater. Res. 1998;39:77. doi: 10.1002/(sici)1097-4636(199801)39:1<77::aid-jbm10>3.0.co;2-l. [DOI] [PubMed] [Google Scholar]
- Boyan B, Lohmann C, Sisk M, Liu Y, Sylvia V, Cochran D, Dean D, Schwartz Z. J. Biomed. Mate.r Res. 2001;55:350. doi: 10.1002/1097-4636(20010605)55:3<350::aid-jbm1023>3.0.co;2-m. [DOI] [PubMed] [Google Scholar]
- Chen C, Jiang X, Whitesides G. MRS Bulletin. 2005;30:194. [Google Scholar]
- Dalby M, Gadegaard N, Tare R, Andar A, Riehle M, Herzyk P, Wilkinson C, Oreffo R. Nat. Mater. 2007;6:997. doi: 10.1038/nmat2013. [DOI] [PubMed] [Google Scholar]
- Dickinson L, Rand D, Tsao J, Eberle W, Gerecht S. J. Biomed. Mater. Res. 2012;100:1457. doi: 10.1002/jbm.a.34059. [DOI] [PMC free article] [PubMed] [Google Scholar]
- Fu J, Wang Y, Yang M, Desai R, Yu X, Liu Z, Chen C. Nat. Methods. 2010;7:733. doi: 10.1038/nmeth.1487. [DOI] [PMC free article] [PubMed] [Google Scholar]
- Hamilton D, Wong K, Brunette D. Calcif. Tissue. Int. 2006;78:314. doi: 10.1007/s00223-005-0238-x. [DOI] [PubMed] [Google Scholar]
- Hamilton D, Brunette D. Biomaterials. 2007;28:1806. doi: 10.1016/j.biomaterials.2006.11.041. [DOI] [PubMed] [Google Scholar]
- Hamilton D D, Chehroudi B, Brunette D. Biomaterials. 2007;28:2281. doi: 10.1016/j.biomaterials.2007.01.026. [DOI] [PubMed] [Google Scholar]
- Kim E, Boehm C, Mata A, Fleischman A, Muschler G, Roy S. Acta. Biomater. 2010;6:160. doi: 10.1016/j.actbio.2009.06.016. [DOI] [PMC free article] [PubMed] [Google Scholar]
- Lincks J, Boyan B, Blanchard C, Lohmann C, Liu Y, Cochran D, Dean D, Schwartz Z. Biomaterials. 1998;19:2219. doi: 10.1016/s0142-9612(98)00144-6. [DOI] [PubMed] [Google Scholar]
- Lohmann C, Tandy E, Sylvia V, Hell-Vocke A, Cochran D, Dean D, Boyan B, Schwartz Z. J. Biomed. Mater. Res. 2002;62:204. doi: 10.1002/jbm.10290. [DOI] [PubMed] [Google Scholar]
- Mata A, Boehm C, Fleischman A, Muschler G, Roy S. J. Biomed. Mater. Res. 2002;62:499. doi: 10.1002/jbm.10353. [DOI] [PubMed] [Google Scholar]
- McBeath R, Pirone D, Nelson C, Bhadriraju K, Chen C. Dev. Cell. 2004;6:483. doi: 10.1016/s1534-5807(04)00075-9. [DOI] [PubMed] [Google Scholar]
- Muschler G, Nitto H, Boehm C, Easley K. J. Orthop. Res. 2001;19:117. doi: 10.1016/S0736-0266(00)00010-3. [DOI] [PubMed] [Google Scholar]
- Muschler G, Raut V, Patterson T, Wenke J, Hollinger J. Tissue. Eng. Part B. Rev. 2010;16:123. doi: 10.1089/ten.TEB.2009.0658. [DOI] [PubMed] [Google Scholar]
- Nasatzky E, Gultchin J, Schwartz Z. Refuat Hapeh Vehashinayim. 2003;20:8. [PubMed] [Google Scholar]
- Schneider G, Zaharias R, Seabold D, Keller J, Stanford C. J. Biomed. Mater. Res. 2004;69:462. doi: 10.1002/jbm.a.30016. [DOI] [PubMed] [Google Scholar]
- Schrader J, Gordon-Walker T, Aucott R, van Deemter M, Quaas A, Walsh S, Benten D, Forbes S, Wells R, Iredale J. Hepatology. 2011;53:1192. doi: 10.1002/hep.24108. [DOI] [PMC free article] [PubMed] [Google Scholar]
- Schulte V, Diez M, Hu Y, Möller M, Lensen M. Biomacromolecules. 2010;11:3375. doi: 10.1021/bm100881y. [DOI] [PubMed] [Google Scholar]
- Shinohara K, Greenfield S, Pan H, Vasanji A, Kumagai K, Midura R, Kiedrowski M, Penn M, Muschler G. J. Orthop. Res. 2011;29:1064. doi: 10.1002/jor.21374. [DOI] [PubMed] [Google Scholar]
- Sochol R, Higa A, Janairo R, Li S, Lin L. Soft Matter. 2011;7:4606. [Google Scholar]
- Tan J, Tien J, Pirone D, Gray D, Bhadriraju K, Chen C. Proc. Natl. Acad. Sci. USA. 2003;100:1484. doi: 10.1073/pnas.0235407100. [DOI] [PMC free article] [PubMed] [Google Scholar]
- Turner A, Dowell N, Turner S, Kam L, Isaacson M, Turner J, Craighead H, Shain S. J. Biomed. Mater. Res. 2000;51:430. doi: 10.1002/1097-4636(20000905)51:3<430::aid-jbm18>3.0.co;2-c. [DOI] [PubMed] [Google Scholar]
- Zhao G, Zinger O, Schwartz Z, Wieland M, Landolt D, Boyan B. Clin. Oral. Implants. Res. 2006;17:258. doi: 10.1111/j.1600-0501.2005.01195.x. [DOI] [PubMed] [Google Scholar]


