Abstract
Objective
To perform a systematic review and meta-analysis of the predictive abilities of CHADS2 and CHA2DS2-VASc in stroke and thromboembolism risk stratification of atrial fibrillation (AF) patients.
Methods
We searched PubMed and EMBASE for English-language literature on comparisons of the diagnostic performance between CHADS2 and CHA2DS2-VASc in predicting stroke, or systemic embolism, in AF. We then assessed the quality of the included studies and pooled the C-statistics and 95% confidence intervals (95% CI).
Results
Eight studies were included. It was unsuitable to perform a direct meta-analysis because of high heterogeneity. When analyzed as a continuous variable, the C-statistic ranged from 0.60 to 0.80 (median 0.683) for CHADS2 and 0.64–0.79 (median 0.673) for CHA2DS2-VASc. When analyzed as a continuous variable in anticoagulation patients, the subgroup analysis showed that the pooled C-statistic (95% CI) was 0.660 (0.655–0.665) for CHADS2 and 0.667 (0.651–0.683) for CHA2DS2-VASc (no significant difference). For non-anticoagulation patients, the pooled C-statistic (95% CI) was 0.685 (0.666–0.705) for CHADS2 and 0.675 (0.656–0.694) for CHA2DS2-VASc (no significant difference). The average ratio of endpoint events in the low-risk group of CHA2DS2-VASc was less than CHADS2 (0.41% vs. 0.94%, P < 0.05). The average proportion of the moderate-risk group of CHA2DS2-VASc was lower than CHADS2 (11.12% vs. 30.75%, P < 0.05).
Conclusions
The C-statistic suggests a similar clinical utility of the CHADS2 and CHA2DS2-VASc scores in predicting stroke and thromboembolism, but CHA2DS2- VASc has the important advantage of identifying extremely low-risk patients with atrial fibrillation, as well as classifying a lower proportion of patients as moderate risk.
Keywords: CHADS2, CHA2DS2-VASc, Atrial fibrillation, Prediction, Stroke, Meta-analysis
1. Introduction
Atrial fibrillation (AF) is the most common disorder of the cardiac rhythm. This condition carries an increased risk of arterial thromboembolism and ischemic stroke. It is also an important risk factor for ischemic stroke, increasing the risk of stroke five fold and contributing to at least 15% of all strokes.[1] Anticoagulation therapy can prevent 1/3 of strokes in patients with AF, and antiplatelet therapy can reduce them by 1/5.[2] According to the 2010 European Society of Cardiology (ESC) Guidelines on AF, anticoagulation therapy is the most highly recommended treatment for AF. In view of the risk of bleeding in patients treated with anticoagulants, not all patients with AF require anticoagulation or antiplatelet therapy, and comprehensive risk stratification is, therefore, necessary to direct the treatment of patients with AF. The CHADS2 score, a commonly used method of stroke-risk stratification in AF, was proposed by Gage et al.[3] in 2001. CHADS2 assigns scores as follows: chronic heart failure, hypertension, diabetes and age > 74 years count for one point each, and previous history of stroke or transient ischemic attack (TIA) counts as two points, for a maximum of six points. A score of 0 is low risk, one point is moderate risk, and more than one is high risk. There are several limitations to the CHADS2 score. For example, a substantial portion of patients are classified as moderate risk, and it is uncertain whether antiplatelet or anticoagulant therapy should be recommended for those patients. Furthermore, the scale ignores some potential risk factors for thromboembolism. The 2006 ACC/AHA/ESC Guidelines for the management of patients with AF noted additional risk factors including the following: female gender, age 65–74 years, coronary heart disease, and thyrotoxicosis. With this information, Lip et al.[4] proposed a new risk score named CHA2DS2-VASc. Compared to the CHADS2 score, it includes three additional factors: female gender, age 65–74 years, and vascular events (disease). Each additional factor counts as one point, while an age older than 74 years was upgraded to two points. As a result, the total score increased to nine points. The CHA2DS2- VASc score includes categories of 0 = low risk, 1 = intermediate risk, and ≥ 2 as high risk. The 2010 ESC Guidelines for AF recommended using the new CHA2DS2-VASc score, while the latest 2011 ACC/AHA/ESC Guidelines for AF still recommended the CHADS2 score. The latest (2012) focused update of the ESC Guidelines for the management of AF again recommended the CHA2DS2-VASc score to assess the stroke-risk of non-valvular AF patients (IA),[5] particularly to identify the truly low-stroke-risk patients. About comparing the two scores, many recent large-scale clinical studies have reached different conclusions. Therefore, we performed a systematic review and meta-analysis on the accuracy of the CHADS2 and the CHA2DS2-VASc scoring systems in stratifying the stroke risk of patients with AF.
2. Methods
2.1. Study selection
Inclusion criteria: (1): the study compared the predictive abilities of CHADS2 and CHA2DS2-VASc and was written in English; (2): the research subjects in the analyzed studies were patients diagnosed with non-valvular AF (including paroxysmal, persistent, permanent); (3): the primary endpoints were defined as stroke or systemic thromboembolic events (including pulmonary embolism and peripheral arterial embolism); (4): the sample size was more than 300 cases; (5): the full texts, or original data, from which we could directly, or indirectly, calculate the C-statistic and its 95% CI were available in studies; and (6): the research subjects unanimously received anticoagulant or non-anticoagulant treatment.
2.2. Exclusion criteria
Exclusion criteria: (1): The study included subjects with valvular heart disease, or specific types of AF patients (such as patients with AF who received radio frequency ablation or a pace maker or “lone” AF); (2): The primary endpoint of the study did not distinguish ischemic stroke from other forms of stroke (e.g., cerebral trauma, intracranial haemorrhage, arteriovenous malformations); (3): Whether the patients received anticoagulation or non-anticoagulation therapy was unclear; (4): The paper was a review of the literature, or a repeated report; and (5): The original data were incomplete, and we failed to contact the author.
2.3. Literature search
Search terms included “CHADS2 score”, “CHA2DS2- VASc score”, “atrial fibrillation”, “risk stratification”, “predict”, and “stroke”. The search databases included PubMed, Embase and the Cochrane Library. The search period ranged from January 1, 2009 to November 30, 2012.
2.4. Data extraction and quality assessment of the included studies
The quality of the included studies was independently appraised by two reviewers. Disagreements were resolved by consensus or, if necessary, a third reviewer. The recorded information included research background (such as literature sources, type of study, the number of samples, mean age, sex ratio, follow-up time, and the treatment situation). We were primarily interested in the C-statistic value and its 95% CI. The C-statistics in the included studies were calculated by receiver operating curve (ROC) analysis and were treated as either categorical variables or continuous variables. The C-statistic can quantitatively reflect the judgment capacity, which is equivalent to the area under curve (AUC). When the C-statistic is greater than 0.5, the predictive capability of the model is not random. A score from 0.5 to 0.7 is considered a low value, 0.7–0.9 is medium, and more than 0.9 is high. We also summarised the incidence of primary endpoints and the distribution proportion of different risk stratifications. The quality evaluation of the literature referred to the method proposed by McGinn, et al.[6]
2.5. Statistical analysis
2.5.1. Consistency test
We used STATA 11.0 Software for consistency testing. First, we judged the heterogeneity between the different studies through the use of the I2 value. I2 indicates the size of the heterogeneity: I2 ≤ 25% indicates low heterogeneity, 25% < I2 ≤ 50% indicates intermediate heterogeneity, and I2 > 50% indicates high heterogeneity. If two or more studies showed homogeneity (or no significant heterogeneity), we chose a fixed-effects model. Conversely, if there was significant heterogeneity, we selected a random-effects model. We also used STATA 11.0 software to perform linear meta- regression and sensitivity analyses to identify the source of heterogeneity and then performed a subgroup analysis.[7],[8]
2.5.2. Meta-analysis
STATA 11.0 software was used to merge the C-statistics of the CHADS2 scores and the CHA2DS2-VASc scores. We compared the pooled C-statistics of CHADS2 and CHA2DS2- VASc using the following formula:
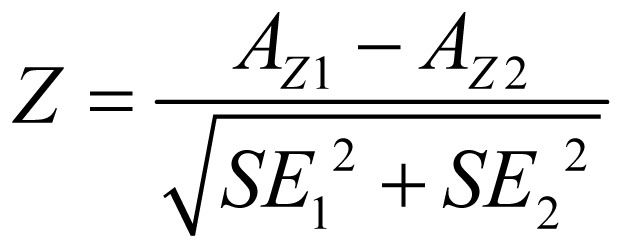 |
where AZ1 and AZ2 are the AUCs of CHADS2 and CHA2DS2-VASc scores, respectively, and SE12 and SE22 are the standard errors of the AUCs. By calculating the Z-statistic, we determined whether there was a significant difference between the C-statistics of the two scores, at the same time, we also performed a paired two-sample t test with SPSS 16.0 software. In addition, the distribution proportions of the different risk stratifications as well as the incidences of primary endpoints also were compared. In subgroup analyses, all the included subjects were divided into subgroups according to the results of the consistency test.
3. Results
3.1. Literature selection and quality evaluation of the retrieved literature
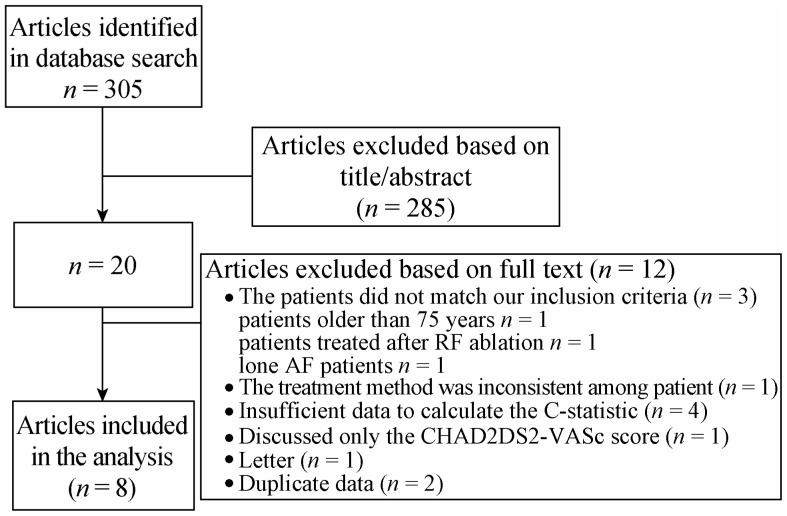
In total, we initially selected 305 articles, and 20 articles remained after screening the title and summary. Finally, 8 articles met the inclusion criteria after reading the full text (Figure 1). The basic characteristics of the selected studies are shown in Table 1. The summary of C-statistics (95% CI) and Z-statistics of all the included studies are shown in Table 2. The quality assessment is summarised in Table 3. The total number of cases in the included studies was 317, 389.
Figure 1. Overview of the research strategy.
Table 1. Basic characteristics of all included studies.
| Year | Author | Country (ies) | Type of study | Sample size | Female ratio (%) | Follow-up time (yrs) | Treatment | Endpoint event |
| 2011 | Poli, et al.[9] | Italy | Prospective cohort study | 662 | 36.1 | 3.6 | Anticoagulation | TE |
| 2010 | Lip, et al.[4] | Europe | Observational | 1,084 | 40.8 | 1.0 | Non-anticoagulation | TE |
| 2010 | Lip, et al.[10] | Global | Trial cohort study | 7,329 | NA | 1.0 | Anticoagulation | TE |
| 2011 | Olesen, et al.[11],* | Denmark | Cohort study | 121,280 | 46.1 | 1.0 | Non-anticoagulation | TE |
| 2011 | Olesen, et al.[11],# | Denmark | Cohort study | 112,183 | NA | 5.0 | Non-anticoagulation | TE |
| 2011 | Olesen, et al.[11],† | Denmark | Cohort study | 98,217 | NA | 10.0 | Non-anticoagulation | TE |
| 2011 | Lin, et al.[12] | Taiwan, China | Observational | 7,920 | 45.9 | 4.5 | Non-anticoagulation | Stroke |
| 2011 | Sandhu, et al.[13],§ | Canada | Observational | 4,304 | NA | 1.0 | Anticoagulation | Stroke |
| 2011 | Sandhu, et al.[13],△ | Canada | Observational | 4,476 | NA | 1.0 | Non-anticoagulation | Stroke |
| 2011 | Van Staa, et al.[14] | Britain | Observational | 79,844 | 49.7 | 2.4 | Anticoagulation | Stroke |
| 2012 | Friberg, et al.[15] | Sweden | Cohort study | 90,490 | NA | 1.5 | Anticoagulation | Stroke |
The study of Olesen was divided into three periods of follow-up: *1 year, #5 years, and †10 years. The study of Sandhu was divided into §anticoagulantand and △non-anticoagulant subgroups. NA: not mentioned; TE: systemic thromboembolism or stroke.
Table 2. Summary of C-statistics (95% CI) and Z-statistics of all included studies according to whether the C-statistic was analysed as a categorical or continuous variable.
| Author | Analysed as categorical variables |
Analysed as continuous variables |
||||
| CHADS2C-statistic (95% CI) | CHA2DS2-VAScC-statistic (95% CI) | Z-statistic | CHADS2C-statistic (95% CI) | CHA2DS2-VAScC-statistic (95% CI) | Z-statistic | |
| Poli, et al.[9] | 0.594 (0.514–0.674) | 0.524 (0.435–0.614) | 1.129 | 0.717 (0.639–0.795) | 0.724 (0.645–0.803) | –0.122 |
| Lip, et al.[4] | 0.586 (0.477–0.695) | 0.606 (0.513–0.699) | –0.270 | 0.602 (0.486–0.718) | 0.673 (0.577–0.769) | –0.913 |
| Lip, et al.[10] | 0.588 (0.551–0.625) | 0.521 (0.481–0.562) | 2.365& | 0.647 (0.613–0.678) | 0.637 (0.607–0.674) | 0.415 |
| Olesen, et al.[11],* | 0.722 (0.694–0.748) | 0.850 (0.829–0.871) | –7.247& | 0.691 (0.663–0.719) | 0.682 (0.653–0.709) | 0.440 |
| Olesen, et al.[11],# | 0.796 (0.778–0.812) | 0.880 (0.866-0.893) | –7.493& | 0.787 (0.770–0.804) | 0.775 (0.757–0.793) | 0.939 |
| Olesen, et al.[11],† | 0.812 (0.796–0.827) | 0.888 (0.875–0.900) | –7.391& | 0.804 (0.788–0.819) | 0.792 (0.776–0.808) | 1.043 |
| Lin, et al.[12] | 0.683 (0.659–0.708) | 0.669 (0.644–0.693) | 0.782 | 0.683 (0.650–0.708) | 0.669 (0.640–0.693) | 0.690 |
| Sandhu, et al.[13],§ | 0.627 (0.602–0.651) | 0.516 (0.488–0.544) | 5.777& | NA | NA | NA |
| Sandhu, et al.[13],△ | 0.636 (0.614–0.658) | 0.522 (0.496–0.547) | 6.555& | NA | NA | NA |
| Van Staa, et al.[14] | 0.650 (0.630–0.670) | 0.600 (0.590–0.610) | 4.330& | 0.660 (0.640–0.680) | 0.670 (0.650–0.690) | –0.685 |
| Friberg, et al.[15] | 0.610 (0.570–0.660) | 0.560 (0.560–0.570) | 2.138& | 0.660 (0.660–0.670) | 0.670 (0.660–0.680) | –1.732 |
The study of Olesen was divided into three periods of follow-up: *1 year, #5 years, and †10 years. &indicates P < 0.05. The study of Sandhu was divided into §anticoagulantand and △non-anticoagulant subgroups. NA: not mentioned.
Table 3. Quality assessment.
| Author | Q1 | Q2 | Q3 | Q4 | Q5 |
| Poli, et al.[9] | Y | N | Y | U | U |
| Lip, et al.[4] | Y | N | Y | U | U |
| Lip, et al.[10] | Y | N | Y | N | N |
| Olesen, et al.[11],* | Y | N | Y | U | U |
| Olesen, et al.[11],# | Y | N | N | U | U |
| Olesen, et al.[11],† | Y | N | N | U | U |
| Lin, et al.[12] | Y | N | Y | U | U |
| Sandhu, et al.[13] | Y | N | Y | U | U |
| Van Staa, et al.[14] | Y | N | Y | U | U |
| Friberg et al.[15] | Y | N | Y | N | N |
Q1: Did the included patients have different disease severities? Q2: Did the patient selection process exhibit bias? Internal authenticity: Q3: Was the dropout rate lower than 20%? Q4: Was the predictor to be evaluated blinded to the endpoint events? Q5: Were the endpoint events blinded to predictors? The study of Olesen was divided into three periods of follow-up: *1 year, and #5 years, †10 years. Y: Yes; N: No; U: unclear.
3.2. Consistency test
Whether the C-statistic was analyzed as a categorical variable or a continuous variable, the consistency test of the CHADS2 and CHA2DS2-VASc scores showed high heterogeneity, with I2 > 97%. To explore the sources of heterogeneity, we performed a meta-regression analysis using the follow-up time, treatment, and study type as covariates, respectively. When the C-statistic was analysed as a categorical variable, the results showed that the differences in treatment could reduce the variance component, tau-squared, of CHADS2 from 0.014 to 0.007 (P = 0.025) (Table 4), indicating that the treatment could explain 44.45% of the sources of heterogeneity. Similarly, the differences in treatment could explain 39.63% of the sources of heterogeneity for CHA2DS2-VASc (P = 0.024) (Table 4). When the C-statistic was analysed as a continuous variable, the above three covariates were independent of heterogeneity (P > 0.05).
Table 4. Results of meta-regression when analyzed using treatment as covariates for CHADS2 and CHA2DS2-VASc.
| Scoring system | Number* | tau2# | I-squared_res† | Adj R-square▴ | Treatment |
_cons |
||
| coef.(95%CI) | P | coef.(95%CI) | P | |||||
| CHADS2 | 11 | 0.007 | 95.99% | 44.45% | 0.15 (0.02–0.28) | 0.025 | –0.63(–0.84 – –0.43) | 0.000 |
| CHA2DS2-VASc | 11 | 0.029 | 98.69% | 39.63% | 0.29 (0.05–0.53) | 0.024 | –0.89(–1.29 – –0.50) | 0.001 |
*Number of all include studies; #REML estimate of between-study variance; †% residual variation due to heterogeneity; ▴Proportion of between-study variance explained.
3.3. Data analysis
Due to high heterogeneity between studies, it was not suitable to perform a direct meta-analysis. When analyzed as a continuous variable, the C-statistic ranged from 0.600 to 0.800 (median 0.683) for CHADS2 and 0.640–0.790 (median 0.673) for CHA2DS2-VASc. When analyzed as a categorical variable, the C-statistic was 0.590–0.819 (median 0.636) for CHADS2 and 0.520–0.890 (median 0.600) for CHA2DS2- VASc. When the C-statistic was analyzed as a continuous variable, the Z-statistic indicated that the C-statistics were similar between CHADS2 and CHA2DS2- VASc in all included studies, but when it was analyzed as a categorical variable, eight studies showed significant differences between the two scores: Olesen's three studies[11] favoured CHA2DS2-VASc, and five studies favoured CHADS2.[10]–[15] However, the paired sample t-test gave t = 0.62 and P = 0.55, indicating that the differences between the two scores were not statistically significant in these studies when analyzed as a categorical variable.
Subgroup analysis: According to the result of the consistency test, all the included studies were divided into non-anticoagulant and anticoagulant subgroups. When the C-statistic was analyzed as a continuous variable in the anticoagulation subgroup, the consistency test showed that the heterogeneity of CHADS2 was small (I2 = 0%) and the heterogeneity of CHA2DS2-VASc was moderate (I2 = 44.50%). We therefore used a fixed-effects model for our meta-analysis. For the anticoagulation patients, the meta-analysis showed the pooled C-statistic (95% CI) was 0.660 (0.655–0.665) for CHADS2 and 0.667 (0.651–0.683) for CHA2DS2- VASc (no significant difference), shown in Figures 2 & 3. But the non-anticoagulant subgroup still showed high heterogeneity. To identify the source of heterogeneity, we continued with a sensitivity analysis, which showed that the dropout rates in Olesen's 5-year and 10-year follow-up studies were close to 20%, so we excluded them and then re-performed the meta-analysis. With this adjustment, the I2 value of the heterogeneity test dropped to 0. Therefore, we may reasonably conclude that these two studies were the main source of the heterogeneity. After excluding these two studies, we used a fixed-effects model in the meta-analysis for the non-anticoagulation patients, which showed that the pooled C-statistic (95% CI) was 0.685 (0.666–0.705) for CHADS2 and 0.675 (0.656–0.694) for CHA2DS2-VASc (no significant difference), shown in Figures 4 & 5. When the C-statistic was analysed as a categorical variable, the results of the subgroup analysis and sensitivity analysis still showed obvious heterogeneity, and we resorted to a generally descriptive approach. In the original proposal, CHA2DS2- VASc is proposed as a score and stroke risk is a continuum, and not into three artificial categories of low, moderate and high. Thus, the more accurate and valid comparison between CHADS2 and CHA2DS2-VASc is by focusing on the C-statistics when assessed as a continuous variable. The distribution ratio of different risk groups in both scores and the incidence of primary endpoints are summarized in Table 5. We performed a linear correlation analysis between the average follow-up time and the C-statistics of both scoring systems. The result showed that there was a statistically significant linear correlation between each scoring system and the follow-up time (the correlation coefficients were 0.75–0.87 whether the C-statistic was analysed as a continuous or categorical variable, P < 0.05).
Figure 2. Meta-analysis of the C-statistic of CHADS2 anticoagulation patients when analysed as a continuous variable.
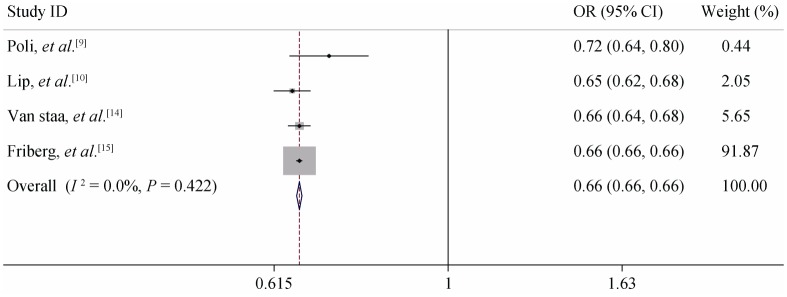
Figure 3. Meta-analysis of the C-statistic of CHA2DS2-VASc anticoagulation patients when analysed as a continuous variable.
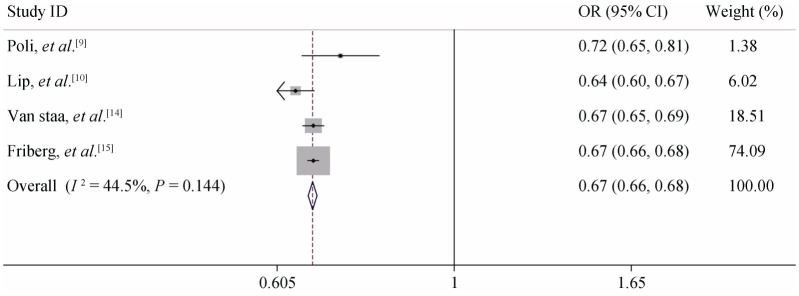
Figure 4. Meta-analysis of the C-statistic of CHADS2 non-anticoagulation patients when analysed as a continuous variable.
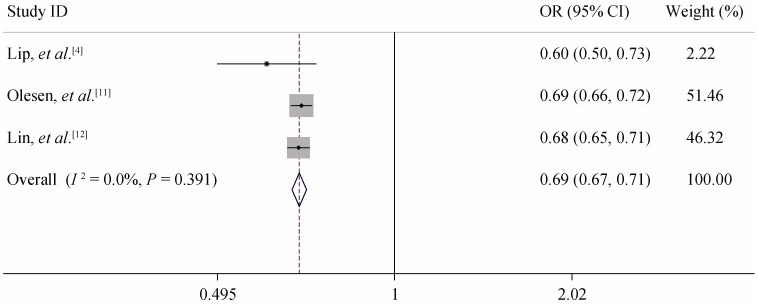
Figure 5. Meta-analysis of the C-statistic of CHA2DS2-VASc non-anticoagulation patients when analysed as a continuous variable.
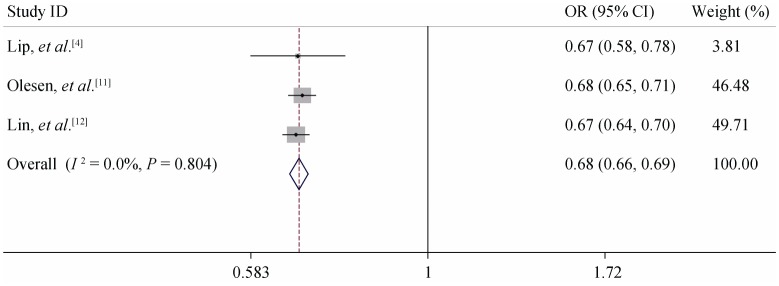
Table 5. Distribution proportion and incidence rate (100 person per year) of endpoint events in different risk stratifications.
| Study | CHADS2(revised)† |
CHA2DS2-VASc |
||||||||||
| Low risk |
Moderate risk |
High risk |
Low risk |
Moderate risk |
High risk |
|||||||
| Rate | Distribute ratio (%) | Rate | Distribute ratio (%) | Rate | Distribute ratio (%) | Rate | Distribute ratio (%) | Rate | Distribute ratio (%) | Rate | Distribute ratio (%) | |
| Poli, et al.[9] | 0.0 | 5.0 | 3.9 | 20.0 | 6.2 | 75.0 | 0.0 | 2.0 | 2.8 | 5.0 | 5.0 | 93.0 |
| Lip, et al.[4] | 1.4 | 20.0 | 1.9 | 35.0 | 3.1 | 45.0 | 0.0 | 10.0 | 0.6 | 15.0 | 3.0 | 76.0 |
| Lip, et al.[10] | 0.0 | 2.0 | 0.9 | 31.0 | 2.1 | 2.0 | NA | 0.0 | 0.5 | 6.0 | 1.7 | 94.0 |
| Lin, et al.[12] | 0.5 | 30.0 | 1.0 | 37.0 | NA | 34.0 | 0.4 | 8.0 | 0.5 | 19.0 | NA | 73.0 |
| Sandhu, et al.[13],§ | 1.1 | NA | 3.2 | NA | 8.4 | NA | NA | 0.0 | 1.3 | NA | 6.5 | NA |
| Sandhu, et al.[13],△ | 1.4 | NA | 2.1 | NA | 6.7 | NA | NA | 0.0 | 4.1 | NA | 9.9 | NA |
| Friberg, et al.[15] | 0.9 | 15.0 | 5.2 | 25.0 | 12.3 | 6.0 | 0.3 | 6.0 | 1.9 | 7.0 | 8.9 | 87.0 |
| Van Staa, et al.[14] | 1.0 | NA | 3.7 | NA | 8.3 | NA | 0.5 | 8.6 | 1.1 | 12.7 | 4.6 | 78.7 |
| Olesen, et al.[11],* | 1.7 | 21.6 | 4.8 | 31.4 | 12.3 | 47.0 | 0.8 | 8.4 | 2.0 | 12.0 | 8.8 | 79.6 |
| Average# | 0.9 | 15.6 | 3.0 | 29.9 | 7.4 | 34.8 | 0.3 | 4.8 | 1.6 | 11.0 | 6.1 | 83.0 |
*1-year follow-up within the study of Olesen. #The average rate is combined with TE and stoke. Separately the average incidence rates of TE in the low, medium, high risk were 0.98%, 3.04%, 8.93% for CHADS2 and 0.78%, 2.88%, 5.93% for CHA2DS2-VASc, and average rates of stroke were 0.78%, 2.88%, 5.93% for CHADS2 and 0.27%, 1.48%, 4.63% for CHA2DS2-VASc. †CHADS2–revised: low risk score 0, moderate risk score 1, high risk score 2–6. §&△: anticoagulant and non-anticoagulant subgroups within the study of Sandhu, respectively. TE: systemic thromboembolism or stroke; NA: not available.
4. Discussion
The CHADS2 score has been widely used in evaluating the risk of stroke in patients with AF since 2001. CHADS2 high-risk patients require anticoagulation therapy, and moderate-risk patients require anticoagulation or antiplatelet therapy, according to the assessment of the risk of bleeding complications and the choice of the patients, but some studies have shown that anticoagulation is more effective than antiplatelet therapy in reducing thromboembolic events in the CHADS2 moderate-risk group.[16],[17] CHADS2 low-risk patients require antiplatelet or no treatment, but Go et al.[18] reported that the stroke rate in CHADS2 low-risk patients was 0.49%, while the anticoagulant subgroup of low-risk patients fell to 0.25%. These results imply that some CHADS2 low-risk patients can still benefit from anticoagulant therapy. In addition, the CHADS2 score often allocates a significant proportion of patients into the moderate-risk group, which can confuse physicians as to whether anticoagulant or antiplatelet therapy should be administered. The CHADS2 score should be improved to identify truly low-risk populations.
The new CHA2DS2-VASc score includes additional risk factors compared to CHADS2, making it more comprehensive and individualized, but the rules and principles of treatment are almost the same. Owing to high heterogeneity between the studies included in our meta-analysis, the two-score system was not adopted to quantitatively describe their results, and also can't be compared directly. The C-statistic of both scoring systems included studies mainly concentrated from 0.60 to 0.80, indicating that the predictive abilities of the CHADS2 and CHA2DS2-VASc scores are not random and considered a low to moderate level. When the C-statistic was analyzed as a continuous variable, the two models had no significant differences, but when it was analyzed as a categorical variable, CHADS2 seemed to have an advantage over CHA2DS2-VASc. This could have been observed for a number of reasons: In contrast to CHADS2, more patients were assigned to the high-risk group by CHA2DS2-VASc, most of the endpoints were concentrated in the high-risk group, and the proportion of patients in the moderate-risk group was decreased in the CHA2DS2-VASc system, all of which could lead to disproportionate risk stratification by CHA2DS2-VASc, making the C-statistic of CHA2DS2-VASc lower than CHADS2.
The subgroup analysis showed, first, that the pooled C-statistic of both scores in the anticoagulant subgroup were similar to the non-anticoagulant subgroup. The risk score is less meaningful in anticoagulated patients because the main function of the risk score is to direct treatment, but the risk score also can predict the incidence of stroke, or systemic thromboembolism, in patients with AF and estimate their prognosis. Considering the high risk of stroke in high-risk patients receiving anticoagulation therapy, we need to take further measures to control the risk factors, or perform regular trans-oesophageal ultrasonography. These results by linear correlation analysis between the average follow-up time and the C-statistics of both scoring systems suggest that the predictive value of CHADS2 and CHA2DS2-VASc can increase gradually over time.
Our meta-analysis showed that the average incidence rates of endpoint events in the different CHADS2 risk stratifications (low-risk, moderate-risk, high-risk) were 0.94%, 3.07%, and 7.56%, respectively. Similarly, the incidence rates of endpoint events in the different CHA2DS2-VASc risk stratifications were 0.41%, 1.61%, and 6.02%, respectively, indicating that the incidence rates of the primary endpoints in both scores increased with the risk stratification. This meta-analysis showed that the average endpoint incidence in the CHA2DS2-VASc low-risk group was lower (0.41% vs. 0.94%) than the CHADS2 low-risk group; the two-sample t-test showed that there was a statistically significant difference between the low-risk groups of the two scores (t = 2.442, P = 0.026), the high-risk groups of the two scores had no significant difference. In addition, for the CHADS2 low-risk patients, the rate of endpoint events in the anticoagulant subgroup was significantly lower than the non-anticoagulation subgroup (0.94% vs. 1.1%), which indicates that CHADS2 stratifies some non-low-risk patients as low risk and that some CHADS2 low-risk patients can still benefit from anticoagulation. Sato et al.[19] reported that the low-risk patients categorized by CHA2DS2-VASc received anticoagulation therapy, but the stroke rate did not decrease, while the patients in moderate- and high-risk groups could still benefit from anticoagulation. Potpara et al.[20] published an observational cohort study of 345 patients diagnosed as “lone” AF with a 12-year follow-up. Their results showed that, compared to CHADS2, only the CHA2DS2-VASc low-risk group (score = 0) was significantly related to the absence of stroke (OR: 5.1, 95% CI: 1.5–16.8, P = 0.008) and that the CHA2DS2-VASc score had a better predictive ability, with a C-statistic of 0.72 (0.61–0.84).[20] Boriani et al.[21] also published a retrospective study of 568 patients with pacemakers. They found that the sensitivity of CHA2DS2-VASc ≥ 1 reached 100%, indicating that the CHA2DS2-VASc score had a high sensitivity and a good predictive ability for truly low-risk patients with AF. Therefore, the CHA2DS2-VASc score has a greater ability to identify truly low-risk patients with AF than CHADS2.[21]
In addition, the proportion of patients classified as moderate risk by CHA2DS2-VASc was less than that of CHADS2 (11.12% vs. 30.75%, t = 2.731, P = 0.01). However, the proportion of patients in the CHA2DS2-VASc high-risk group was greater than CHADS2 (82.3% vs. 37.62%). Therefore, the CHA2DS2-VASc score identifies more patients as high risk to avoid inadequate treatment. Due to the addition of risk factors to CHA2DS2-VASc, the patients in the CHADS2 moderate-risk group are diverted to the high-risk group by CHA2DS2-VASc, which will not only enhance the difference between the high- and moderate-risk groups and decrease the risk of the CHA2DS2-VASc moderate-risk group, but will also avoid concentrating too many patients in the moderate-risk group and facilitate the selection of treatment for these patients.
The limitations of this meta-analysis were as follows. Firstly, in diagnostic trials, it is a common problem that there is high heterogeneity between the different studies, which could have created multiple sources of heterogeneity, such as random error, different interventions, different follow-up times, and the diversity of the primary endpoint event. In this meta-analysis, there is also significant heterogeneity between studies in both the CHADS2 and CHA2DS2-VASc scores. After a meta-regression analysis, heterogeneity was primarily derived from the treatment and we performed subgroup analysis. Secondly, the C-statistic in this meta-analysis was not adjusted by the treatment effect. In addition, the anticoagulation subgroup in some studies might have exhibited some differences, such as a different anticoagulation intensity and different therapeutic times. Most studies did not describe whether some patients in the non-anticoagulant subgroup switched to anticoagulation therapy during follow-up, and we also did not get a clear answer from the authors. These treatment effects are likely to be one source of heterogeneity. Thirdly, regarding primary endpoint events, most of the selected studies combined stroke and systemic thromboembolism as the primary endpoint event, and the average incidence of different risk stratifications in this meta-analysis was not the true stroke rate. Fourthly, some studies were included in the same article, perhaps this may cause some degree of unknown bias, so it requires further validation from different authors. Finally, some of the excluded studies regarded a CHADS2 score ≥ 1 as well as a CHA2DS2-VASc score ≥1 as a risk factor; we failed to obtain the specific data from the authors, therefore, were unable to calculate the C-statistics exactly.
Due to high heterogeneity among studies, it was not suitable to perform a direct meta-analysis on the eight included studies. The C-statistic suggests the clinical utility of both the CHADS2 and CHA2DS2-VASc scores in predicting thromboembolism, and the predictive abilities of the CHADS2 and CHA2DS2-VASc scores is not random, but also not high. The CHADS2 score still plays an important role in AF risk stratification for its simplicity and practicality. Compared to CHADS2, CHA2DS2-VASc can more accurately identify the truly low-risk patients, reduce the proportion of moderate-risk patients, and identify more high-risk patients to avoid inadequate treatment. We must also note that using the CHA2DS2-VASc score will cause more patients with AF to be assigned to the high-risk group, but the recommendation that patients with a CHADS2 or CHA2DS2-VASc score ≥ 2 receive anticoagulation therapy is unchanged; that is to say, more patients with AF require anticoagulation and should endure the inconvenience of anticoagulant monitoring and accept the risk of bleeding. Considering the emergence of new, safe oral anticoagulants for patients with AF, such as dabigatran etexilate and rivaroxaban, anticoagulation therapy may still have a great benefit in clinical practice.
References
- 1.[No authors listed] Risk factors for stroke and efficacy of antithrombotic therapy in atrial fibrillation: analysis of pooled data from five randomized controlled trials. Arch Intern Med. 1994;154:1449–1457. [PubMed] [Google Scholar]
- 2.Lip GY, Edwards SJ. Stroke prevention with aspirin warfarin and ximelagatran in patients with non-valvular atrial fibrillation: A system review and meta-analysis. Thromb Res. 2006;118:321–333. doi: 10.1016/j.thromres.2005.08.007. [DOI] [PubMed] [Google Scholar]
- 3.Gage BF, Waterman AD, Shannon W, et al. et al. validation of clinical classification schemes for predicting stroke: results of the National Registry of Atrial Fibrillation. JAMA. 2001;285:2864–2870. doi: 10.1001/jama.285.22.2864. [DOI] [PubMed] [Google Scholar]
- 4.Lip GY, Nieuwlaat R, Pisters R, et al. et al. Refining clinical risk stratification for predicting stroke and thromboembolism in atrial fibrillation using a novel risk factor-based approach: the euro heart survey on atrial fibrillation. Chest. 2010;137:263–272. doi: 10.1378/chest.09-1584. [DOI] [PubMed] [Google Scholar]
- 5.Camm AJ, Lip GY, De Caterina R, et al. et al. 2012 focused update of the ESC Guidelines for the management of atrial fibrillation: An update of the 2010 ESC Guidelines for the management of atrial fibrillation. Europace. 2012;14:1385–1413. doi: 10.1093/europace/eus305. [DOI] [PubMed] [Google Scholar]
- 6.McGinn TG, Guyatt GH, Wyer PC, et al. et al. Users'guides to the medical literature: literature: XXII: how to use articles about clinical decision rules. J Am Med Assoc. 2000;284:79–84. doi: 10.1001/jama.284.1.79. [DOI] [PubMed] [Google Scholar]
- 7.Thompson SG, Higgins JPT. How should meta—regression analyses be undertaken and interpreted? Statist Med. 2002;21:1559–1573. doi: 10.1002/sim.1187. [DOI] [PubMed] [Google Scholar]
- 8.Sharp S. she23: Meta-analysis regression. Stata Technical Bulletin (STB) 1998;42:16–22. http://onlinelibrary.wiley.com/doi/10.1002/sim.1187/fu. [Google Scholar]
- 9.Poli D, Lip GY, Antonucci E, et al. et al. Stroke risk stratification in a “real-world” elderly anticoagulated atrial fibrillation population. J Cardiov-asc Electrophysiol. 2011;22:25–30. doi: 10.1111/j.1540-8167.2010.01858.x. [DOI] [PubMed] [Google Scholar]
- 10.Lip GY, Frison L, Halperin JL. Identifying patients at high risk for stroke despite anticoagulation: a comparison of contemporary stroke risk stratification schemes in an anticoagulated atrial fibrillation cohort. Stroke. 2010;41:2731–2738. doi: 10.1161/STROKEAHA.110.590257. [DOI] [PubMed] [Google Scholar]
- 11.Olesen JB, Lip GY, Hansen ML, et al. et al. Validation of risk stratification schemes for predicting stroke and thromboembolism in patients with atrial fibrillation: nationwide cohort study. BMJ. 2011;342:d124. doi: 10.1136/bmj.d124. [DOI] [PMC free article] [PubMed] [Google Scholar]
- 12.Lin LY, Lee CH, Yu CC, et al. et al. Risk factors and incidence of ischemic stroke in Taiwanese with nonvalvular atrial fibrillation—A nation wide database analysis. Atherosclerosis. 2011;217:292–295. doi: 10.1016/j.atherosclerosis.2011.03.033. [DOI] [PubMed] [Google Scholar]
- 13.Sandhu RK, Bakal JA, Ezekowitz JA, et al. et al. Risk stratification schemes, anticoagulation use and outcomes: the risk—treat-ment paradox in patients with newly diagnosed non-valvular atrial fibrillation. Heart. 2011;97:2046–2050. doi: 10.1136/heartjnl-2011-300901. [DOI] [PubMed] [Google Scholar]
- 14.Van Staa TP, Setakis E, Di Tanna GL, et al. et al. A comparison of risk stratification schemes for stroke in 79,884 atrial fibrillation patients in general practice. J Thromb Haemost. 2011;9:39–48. doi: 10.1111/j.1538-7836.2010.04085.x. [DOI] [PubMed] [Google Scholar]
- 15.Friberg L, Rosenqvist M, Lip GY, et al. et al. Evaluation of risk stratification schemes for ischaemic stroke and bleeding in 182 678 patients with atrial fibrillation: the Swedish Atrial Fibrillation cohort study. Eur Heart J. 2012;12:1500–1510. doi: 10.1093/eurheartj/ehr488. [DOI] [PubMed] [Google Scholar]
- 16.Lee BH, Park JS, Park JH, et al. et al. The effect and safety of the antithrombotic therapies in patients with atrial fibrillation and CHADS2 score 1. J Cardiovasc Electrophysiol. 2010;21:501–507. doi: 10.1111/j.1540-8167.2009.01661.x. [DOI] [PubMed] [Google Scholar]
- 17.Gorin L, Fauchier L, Nonin E, et al. et al. Antithrombotic treatment and the risk of death and stroke inpatients with atrial fibrillation and a CHADS2 score = 1. Thromb Haemost. 2010;103:833–840. doi: 10.1160/TH09-10-0746. [DOI] [PubMed] [Google Scholar]
- 18.Go AS, Hylek EM, Chang Y, et al. et al. Anticoagulation therapy for stroke prevention in atrial fibrillation. How well do randomized trials translate into clinical practice? JAMA. 2003;290:2685–2692. doi: 10.1001/jama.290.20.2685. [DOI] [PubMed] [Google Scholar]
- 19.Sato H, Ishikawa K, Kitabatake A, et al. et al. Low-dose aspirin for prevention of stroke in low-risk patients with atrial fibrillation: Japan Atrial Fibrillation Stroke Trial. Stroke. 2006:447–451. doi: 10.1161/01.STR.0000198839.61112.ee. [DOI] [PubMed] [Google Scholar]
- 20.Potpara TS, Polovina MM, Licina MM, et al. et al. Reliable identification of ‘truly low’ thromboembolic risk in patients initially diagnosed with ‘lone’ atrial fibrillation: the Belgrade Atrial Fibrillation Study. Circ Arrhythm Electrophysiol. 2012;5:319–326. doi: 10.1161/CIRCEP.111.966713. [DOI] [PubMed] [Google Scholar]
- 21.Boriani G, Botto GL, Padeletti L, et al. et al. Italian AT-500 Registry Investigators. Improving stroke risk stratification using the CHADS2 and CHA2DS2-VASc risk scores in patients with paroxysmal atrial fibrillation by continuous arrhythmia burden monitoring. Stroke. 2011;42:1768–1770. doi: 10.1161/STROKEAHA.110.609297. [DOI] [PubMed] [Google Scholar]


