

Abstract
Positive associations have been reported between measures of accelerated fetal growth and risk of childhood acute lymphoblastic leukemia (ALL). We investigated this association by pooling individual-level data from 12 case-control studies participating in the Childhood Leukemia International Consortium. Two measures of fetal growth – weight-for-gestational-age and proportion of optimal birth weight (POBW) – were analysed. Study-specific odds ratios (ORs) and 95% confidence intervals (CIs) were estimated using multivariable logistic regression, and combined in fixed effects meta-analyses. Pooled analyses of all data were also undertaken using multivariable logistic regression. Subgroup analyses were undertaken when possible. Data on weight for gestational age were available for 7,348 cases and 12,489 controls from all 12 studies and POBW data were available for 1,680 cases and 3,139 controls from three studies. The summary ORs from the meta-analyses were 1.24 (95% CI 1.13, 1.36) for children who were large for gestational age relative to appropriate for gestational age, and 1.16 (95% CI: 1.09, 1.24) for a one standard deviation increase in POBW. The pooled analyses produced similar results. The summary and pooled ORs for small-for-gestational-age children were 0.83 (95% CI: 0.75, 0.92) and 0.86 (95% CI 0.77, 0.95) respectively. Results were consistent across subgroups defined by sex, ethnicity and immunophenotype, and when the analysis was restricted to children who did not have high birth weight. The evidence that accelerated fetal growth is associated with a modest increased risk of childhood ALL is strong and consistent with known biological mechanisms involving insulin like growth factors.
Keywords: birth weight, fetal growth, leukemia, childhood, pooled analysis, meta-analysis
Introduction
Acute lymphoblastic leukemia (ALL) is the most common childhood malignancy. Most studies of perinatal risk factors have reported an increased risk associated with high birth weight or accelerated fetal growth. A recent review and meta-analysis1 reported positive associations between high birth weight and risk of ALL in 21 of 23 studies; the summary odds ratio (OR) was 1.23 relative to normal birth weight, with a 95% confidence interval (CI) of 1.15, 1.32. However, these studies did not all take account of gestational age, and therefore the rate of fetal growth.
The measure ‘large-for-gestational age’ (LGA) takes into account whether the child’s birth weight was more than expected for the gestational age at birth (above the 90th percentile of a population-based reference group). A German study2 found that children who were large-for-gestational-age (LGA) were at increased risk of ALL (OR 1.45; 95% CI 1.07, 1.97), and that the OR was even higher for LGA children whose birth weight was <4,000 grams (OR 1.89; 95% CI 0.94, 3.79). A Texan study3 also reported an elevated OR for LGA: OR 1.66; 95% CI: 1.32, 2.10. The proportion of optimal birth weight (POBW) is another derived value designed to assess appropriateness of fetal growth, and takes into account the child’s gestational age, gender, birth order, and mother’s height4; it is similar to the ratio of observed to expected weight for gestational age, with estimated optimal birth weight substituted for expected weight. Milne et al.5 reported an OR of 1.18 (95% CI 1.04, 1.35) for ALL for a 1 standard deviation (SD) increase in POBW in Australian children. In that study, the OR for POBW remained elevated when analyses were restricted to children whose birth weight was less than 3,500 grams or 4,000g, but there was no association of ALL with birth weight per se. The results of these studies suggest that accelerated fetal growth is associated with an increased risk of ALL in the absence of high birth weight, and that investigation of the former is important for valid conclusions to be drawn.2, 3, 5, 6 This issue is particularly important when considering possible underlying biological mechanisms.
The Childhood Leukemia International Consortium (CLIC) is a multi-national collaboration of epidemiologic and genetic studies of childhood leukemia(see https://ccls.berkeley.edu/clic/).7 In this CLIC collaborative study, we combined data from 12 case-control studies conducted in 9 countries to investigate the association between accelerated fetal growth and risk of childhood ALL.
Methods
Original data were requested from participating studies including child’s sex, age at diagnosis or recruitment, ALL immunophenotype, year of birth, birth weight, gestational age, birth order, ethnicity, maternal age at child’s birth, maternal height, maternal smoking during pregnancy, birth defects (including Down syndrome), plurality, educational level of parents, household income and socioeconomic status. Any other variables used in the matching or selection of cases and controls (e.g. geographical region) were also requested. Study design and participant characteristics for each study have been summarised elsewhere.7 All studies included were approved by institutional ethics committees, ensuring that informed consent was provided by all participants who provided data.
Data preparation and statistical analysis
Data from each study centre were checked for completeness, and clarification or correction was sought from study investigators where necessary. Categorical variables were recoded or created from continuous data to conform to standard groupings as needed.
We investigated the association between risk of childhood ALL and two measures of fetal growth, LGA and POBW. Information on birth weight and gestational age was provided by the mother in all studies except the Greek study and two of the French studies (Adele and Escale), where data were obtained from medical records. For all studies, sex, birth weight and gestational age (where available) were used to classify children into weight for gestational age categories: large-for-gestational-age (LGA), defined as having a birth weight above the country-specific 90th percentile for sex and gestational age; small-for-gestational-age (SGA), defined as having a birth weight below the 10th percentile; and appropriate-for-gestational-age (AGA). Published population birth weight centiles from the respective country were used, wherever possible, to derive these categories. If more than one reference was available for a country, we used the one from the time period that most overlapped the birth years of the study participants. Where published centiles were not available (NZ, Greece and Brazil), we used centiles from the country that most closely matched the study population geographically and with respect to years of birth. Sex-specific centiles were used for all countries except Brazil, where only combined-sex centiles from Chile were available. The source of reference data for each study is indicated in Table 1. Initially, ORs for LGA were estimated using two separate reference categories: AGA and AGA/SGA combined. As the results were similar, and SGA may be an ‘abnormal’ birth outcome in itself, we only report results of analyses with AGA as the reference category.
Table 1.
Birth characteristics of participants in the 12 studies in the CLIC pooled analysis of fetal growth
| CLIC Study (citation for birth weight centile) | Birth Weight (grams) | Term pregnanciesa | Birth weight for gestational age | LGA cut-off at 40 weeks gestation (grams) | Additional Covariatesb | |||||||||
|---|---|---|---|---|---|---|---|---|---|---|---|---|---|---|
|
| ||||||||||||||
| cases | controls | cases | controls | Cases | controls | males | females | |||||||
|
| ||||||||||||||
| mean | SD | mean | SD | n | % | n | % | % (95% CI) | % (95% CI) | |||||
| Australia 29 | 3,493 | 518 | 3,456 | 526 | 329 | (93.7) | 767 | (94.0) | SGA | 5.7 (3.3, 8.1) | 10.3 (8.2, 12.4) | 4,170 | 4,000 | Ethnicity, birth order, mother’s age, parental education, SESc |
| LGA | 16.0 (12.2, 19.8) | 13.1 (10.8, 15.4) | ||||||||||||
| UK 30 | 3,416 | 534 | 3,366 | 530 | 1,221 | (93.3) | 2,496 | (93.7) | SGA | 6.9 (5.5, 8.3) | 7.4 (6.4, 8.4) | 4,070 | 3,900 | Birth order, ethnicity, parental education |
| LGA | 14.4 (12.2, 19.8) | 11.3 (10.1, 12.5) | ||||||||||||
| USA (NCCLS) 11 | 3,486 | 562 | 3,459 | 526 | 577 | (92.9) | 835 | (94.1) | SGA | 10.0 (7.6, 12.4) | 9.6 (7.7, 11.5) | 4,166 | 4,024 | Mother’s age, parental education, household income, birth order |
| LGA | 15.3 (12.5, 18.1) | 11.8 (9.7, 13.9) | ||||||||||||
| Germany 31 | 3,453 | 529 | 3,435 | 515 | 651 | (94.5) | 2,179 | (96.4) | SGA | 11.2 (8.8, 13.6) | 11.5 (10.2, 12.8) | 4,170 | 4,000 | Birth order, parental education |
| LGA | 10.2 (7.9, 12.5) | 8.0 (6.9, 9.1) | ||||||||||||
| USA (COG) 3 | 3,473 | 531 | 3,446 | 532 | 1,548 | (95.0) | 1,620 | (94.8) | SGA | 7.9 (6.6, 9.2) | 9.4 (8.0, 10.8) | 4,115 | 3,960 | Mother’s age, parental education, income |
| LGA | 13.0 (11.4, 14.6) | 11.2 (9.7, 12.7) | ||||||||||||
| France (ESCALE) 32 | 3,350 | 481 | 3,315 | 504 | 560 | (94.1) | 1,478 | (93.7) | SGA | 10.3 (7.9, 12.7) | 10.1 (8.6, 11.6) | 3,964 | 3,796 | Year of birth, birth order, mother’s age, parental education, maternal smoking during pregnancy |
| LGA | 13.9 (11.1, 16.7) | 13.2 (11.5, 14.9) | ||||||||||||
| France (Electre) 12 | 3,354 | 502 | 3,347 | 495 | 292 | (89.3) | 449 | (93.2) | SGA | 5.5 (3.0, 8.0) | 6.0 (3.9, 8.1) | 4,035 | 3,864 | Birth order, mother’s age, parental education, maternal smoking during pregnancy |
| LGA | 17.1 (13.0, 21.2) | 13.9 (10.8, 17.0) | ||||||||||||
| France (Adele) 12 | 3,382 | 464 | 3,344 | 541 | 186 | (92.1) | 210 | (90.9) | SGA | 2.5 (0.3, 4.7) | 6.5 (3.3, 9.7) | 4,035 | 3,864 | Birth year, ethnicity, parental education |
| LGA | 18.8 (13.4, 24.2) | 19.9 (14.8, 25.0) | ||||||||||||
| Canada 33 | 3,358 | 509 | 3,345 | 328 | 660 | (94.3) | 684 | (95.4) | SGA | 13.0 (10.5, 15.5) | 16.7 (14.0, 19.4) | 4,200 | 4,000 | Birth order, maternal age, parental education, maternal smoking during pregnancy |
| LGA | 7.4 (5.5, 9.3) | 7.8 (5.8, 9.8) | ||||||||||||
| New Zealand 29 | 3450 | 515 | 3467 | 527 | 85 | (94.4) | 264 | (96.7) | SGA | 12.2 (5.4, 19.0) | 11.7 (7.9, 15.5) | 4,170 | 4,000 | Ethnicity, parental education, maternal smoking during pregnancy |
| LGA | 12.2 (5.4, 19.0) | 9.2 (5.8, 12.6) | ||||||||||||
| Greece 34 | 3310 | 481 | 3256 | 518 | 374 | (93.7) | 272 | (91.9) | SGA | 8.5 (5.8, 11.2) | 10.5 (7.0, 14.0) | 3,990 | 3,827 | Nationality, birth year, parental education, birth order, maternal age |
| LGA | 14.5 (11.0, 18.0) | 14.9 (10.8, 19.0) | ||||||||||||
| Brazil 35 | 3276 | 561 | 3069 | 609 | 352 | (92.6) | 435 | (88.2) | SGA | 9.5 (6.6, 12.4) | 11.6 (8.8, 14.4) | 4,025 | 4,025 | Birth year, ethnicity, maternal age, parental education. |
| LGA | 18.2 (14.3, 22.1) | 13.2 (10.2, 16.2) | ||||||||||||
|
| ||||||||||||||
| Pooled Group | 3415 | 527 | 3381 | 532 | 6835 | (93.7) | 11689 | (94.2) | SGA | 8.7 (8.1, 9.3) | 9.9 (9.4, 10.4) | |||
| LGA | 13.5 (12.7, 14.3) | 11.3 (10.7, 11.9) | ||||||||||||
Term children defined as more than or equal to 37 weeks gestation
These are variables that were considered potential confounders for each study individually (in addition to the frequency-matching variables mentioned in Supplementary Table 1), as used in individual study meta-analysis.
An area-based index of socioeconomic advantage/disadvantage.
The formula for calculating POBW has been published previously4 and is included in Supporting Information file 1; briefly, it includes mother’s height and birth order in the calculation in addition to sex, birth weight and gestational age. POBW was calculated for the three studies where maternal height was available (Australia, UK and USA (NCCLS)). POBW was modelled as a continuous variable, with ORs being estimated for a one SD increase (SD of cases and controls combined).
We used two distinct analytical approaches. The primary analyses involved estimating study-specific ORs, then undertaking a meta-analysis using precision based weighting methods.8 The second approach involved the analysis of data from all participating studies pooled in a single dataset. Where possible, appropriate subgroup analyses were undertaken in both meta- and pooled analyses, including among children who were not high birth weight (ie <4000g).
Children were excluded from analyses if they had a birth defect (according to the Western Australian Birth Defect Registry’s definition9), were from a multiple birth, were born at <30 or >44 weeks gestation, or (for analyses using POBW) had a POBW <50 or >200, which were considered to be implausible values. The numbers of subjects included in the study-specific meta-analyses and pooled analyses approaches vary modestly because of the different covariates included in the models, and hence the extent of missing data.
Estimation and meta-analysis of individual study ORs
Unconditional logistic regression in PASW statistics version 18 (IBM SPSS Inc. 2010) was used to estimate study-specific ORs and 95 percent confidence intervals (95% CIs) for each measure of fetal growth. All models included child’s age and sex and additional study-specific matching variables. Variables considered a priori to be potential confounders (maternal age, maternal smoking, ethnicity, child’s birth order, child’s year of birth, parental education, household income and other measures of socio-economic status (SES) based on residential address) were considered for inclusion in the study-specific models; they were retained if their inclusion changed the OR by more than five percent. The study-specific ORs were then combined in a meta-analysis using the ‘metan’ procedure (Mantel-Haenszel method fixed effect model in StataIC version 11 (StataCorp LP, College Station Texas, USA, 2010). Summary ORs, 95% CIs and forest plots were produced, along with I2 statistics (an estimate of the proportion of inconsistency among studies that cannot be explained by chance)10 and their P-values.
Pooled analysis
Unconditional logistic regression in PASW statistics version 18 (IBM SPSS Inc. 2010) was used to estimate pooled ORs and 95% CIs for each measure of fetal growth. Confounders identified in the individual study analyses described above were entered into all pooled models if they were available for all studies. Some studies used matching variables (eg region) that could not be used in the pooled analyses as they were unique to a particular study. A variable denoting the study of origin was included in the pooled analyses.
Classification of ethnicity (or ‘race’) varied among the studies, so this variable was re-coded into two broad groups for the purposes of the pooled analysis. The first group combined groups originally classified variously in each study as either ‘Caucasian’, ‘European’ or ‘White’, and the other included all other ethnic groups as well as those classified in their own study as ‘non-Caucasian’ or ’non-white’, ‘Hispanic’(North American studies only), or ‘mixed’. Parental education level (highest level of either parent if both were available) was coded into 3 groups: those who hadn’t completed secondary school, those with complete secondary school, and those with a college/university level education. Maternal age was classified as: less than 25 years, 25-34 years, and 35 or older. Child’s age at diagnosis or recruitment was grouped as: 0-1 year of age (infants), >1-5 years, and >5-14 years. Child’s year of birth was grouped as: before 1988, 1988 to 1995, and after 1995. Birth order higher than second born was collapsed into a ‘3rd or higher’ group.
Results
The characteristics of participating studies are shown in Supporting Information Table 1. All studies recruited children from birth up to 15 years of age, and over 50% of cases were male in all studies. The key exposure variables and covariates relevant to this analysis are shown in Table 1. There was considerable variation among the studies in the proportion of LGA babies, ranging from 7.8% in Canada to 19.9% in France (Adele).
Meta-analysis of weight for gestational age
A total of 7,348 ALL cases and 12,489 controls from 12 studies were included. The summary OR for LGA (vs AGA) was 1.24 (95% CI 1.13, 1.36) (Figure 1). There was little evidence of heterogeneity among the ORs. The summary estimates changed by less than four percent when each individual study was removed in turn, or when studies were excluded if less than 80% of participants had data required for calculation of LGA (Greece (42%) and Australia (76%)), less than 300 cases, or hospital rather than population controls (data not shown).
Figure 1.
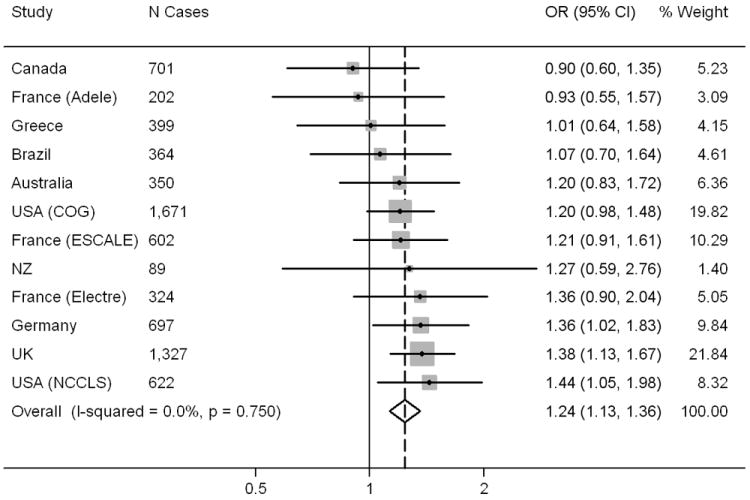
Forest plot showing individual and summary odds ratios for LGA (ref = AGA), using precision based weighting (fixed effects), Childhood Leukemia International Consortium.
The summary OR for LGA among participants with birth weight less than 4,000g was 1.26 (95% CI 1.07, 1.49) (Supporting Information Figure 1), similar to the overall summary OR. The summary ORs for LGA among B-lineage and T-lineage cases, 1.23 (95% CI: 1.11, 1.36) and 1.35 (95% CI: 1.07, 1.69) respectively, were also consistent with the overall summary OR (Supporting Information Figure 1). The New Zealand study was not included in the meta-analysis of T-lineage immunophenotype due to lack of cases. There was little evidence of heterogeneity in any of the subgroup meta-analyses. The summary OR for SGA vs AGA was 0.83 (95% CI: 0.75, 0.92) with I2 = 0% (not shown in Figures).
Pooled analysis of weight for gestational age
The pooled analysis of weight for gestational age included 7,292 cases and 12,406 controls from 12 studies, and the models included child’s age, sex and year of birth group, mother’s age group, ethnic group, parental education, birth order and study of origin. The pooled OR for LGA was 1.21 (95% CI 1.11, 1.32) (Table 2). The summary estimates changed little when each individual study was removed in turn, or when studies were excluded if they had less than 80% of participants with data required for calculation of LGA, less than 300 cases, or used hospital rather than population controls (Table 2). The pooled ORs for most subgroups, including children with birth weight <4,000g, were similar to the overall pooled OR. The pooled OR for LGA among infants was close to unity, but the P-value for the LGA by age interaction term was 0.66. The pooled OR for SGA relative to AGA was 0.86 (95% CI: 0.77, 0.95) (not shown in tables).
Table 2.
Pooled ORs (95% CI) for association Between LGA and risk of Acute Lymphocytic Leukemia among 12 studies: Overall and by Subgroup, Childhood Leukemia International Consortium
| Total N1 Cases/Controls | Cases n LGA/AGA | Controls n LGA/AGA | OR2 | 95% CI | |
|---|---|---|---|---|---|
| Overall | 7,292/12,406 | 988/5,670 | 1,398/9,779 | 1.21 | 1.11, 1.32 |
| Excluding studies if <80% participants had LGA data3 | 6,542/11,294 | 874/5,088 | 1,247/8,933 | 1.22 | 1.11, 1.34 |
| Excluding studies with hospital controls4 | 6,311/11,386 | 823/4,929 | 1,243/9,017 | 1.23 | 1.12, 1.36 |
| Excluding studies with <300 cases5 | 7,000/11,902 | 939/5,443 | 1,327/9,393 | 1.22 | 1.11, 1.34 |
| Birth weight <4,000g | 6,394/11,077 | 297/5,463 | 408/9,440 | 1.26 | 1.07, 1.48 |
| Sex6 | |||||
| Males | 4,106/6,905 | 552/3,192 | 782/5,435 | 1.18 | 1.05, 1.33 |
| Females | 3,186/5,501 | 436/2,478 | 616/4,344 | 1.25 | 1.09, 1.43 |
| Age at diagnosis7 | |||||
| 0-1 | 636/1,447 | 76/521 | 154/1,149 | 1.04 | 0.75, 1.44 |
| >1-5 | 4,075/6,087 | 559/3,178 | 712/4,808 | 1.20 | 1.06, 1.35 |
| >5 | 2,581/4,872 | 353/1,971 | 532/3,822 | 1.26 | 1.08, 1.46 |
| Ethnicity8 | |||||
| White/European/Caucasian | 6,042/10,858 | 812/4,747 | 1,232/8,618 | 1.18 | 1.07, 1.30 |
| Other | 1,250/1548 | 176/923 | 166/1,161 | 1.44 | 1.14, 1.83 |
| Immunophenotype | |||||
| B-lineage cases | 5,735/12,406 | 771/4,456 | 1,398/9,779 | 1.20 | 1.09, 1.33 |
| T-lineage cases | 705/12,406 | 105/546 | 1,398/9,779 | 1.32 | 1.05, 1.64 |
Total N includes those born SGA. Counts for cases and controls by LGA/AGA represent exposure of interest and reference group only.
ORs adjusted for child’s age group, sex, year of birth group, mother’s age group, parental education, ethnic Group, birth order group and study.
Greece, Australia
Greece, Brazil, France (Adele)
France (Adele), New Zealand
P-value of sex by LGA interaction term = 0.50
P-value of age by LGA interaction term = 0.66
P-value of ethnic group by LGA interaction term = 0.25
A pooled analysis in which the model contained all combinations of weight for gestational age (SGA, AGA and LGA) with birth weight (<4000g and ≥4000g) was also undertaken. In children with birth weight <4,000g, OR of ALL increased from SGA to AGA to LGA (Table 3). In children with birth weight ≥4000g, ORs were the same for AGA and LGA, and only a little less than that for LGA in children with birth weight <4,000g.
Table 3.
Pooled analysis of combined categories of weight for gestational age and birth weight < or ≥ 4,000g and risk of acute lymphoblastic leukemia, Childhood Leukemia International Consortium.
| N Case/controls | OR1 | 95% CI | |
|---|---|---|---|
| SGA and <4,000g2 | 634/1,229 | 0.86 | 0.78, 0.96 |
| AGA and <4,000g | 5,463/9,440 | 1.00 | Referent |
| LGA and <4,000g | 297/408 | 1.26 | 1.08, 1.48 |
| AGA and ≥4,000g | 207/339 | 1.20 | 1.00, 1.44 |
| LGA and ≥4,000g | 691/990 | 1.20 | 1.08, 1.33 |
ORs adjusted for child’s age group, sex, year of birth group, mother’s age group, parental education, ethnic Group, birth order group and study.
No study participants were both SGA and ≥4,000g.
We repeated the analysis of LGA among the three studies where data were also available for POBW (see below). The results of the analysis of these three studies were similar to those for all 12 studies: Meta-analysis (total cases/controls: 1,680/3,139) summary OR = 1.24 (95% CI 1.03, 1.48); pooled analysis (total cases/controls: 1,689/3,154), pooled OR = 1.24 (95% CI, 1.04, 1.49) (results not shown in tables).
It was considered possible that whole population distributions of birth weight by gestational age might not correctly represent the expected distributions in study participants, because of low participation rates and other potential sources of ascertainment bias. Therefore, we undertook a sensitivity analysis in which, in each study, the distribution of birth weight by gestational age in controls was used to allocate cases and controls to weight for gestational age categories, and the main analyses reported in Table 2 and Figure 1 repeated. Because of the generally small numbers of controls available from which to create this distribution, we collapsed gestational age into four categories, 30-38, 39, 40 and 41+ weeks. This enabled allocation of all children into weight for gestational age categories except those in the highest GA category for three studies (Adele, Greece and Brazil), where there were too few children in the highest category. The results of this analysis and the associated forest plot are in Supporting Information Table 2 and Supporting Information Figure 2. While results for individual studies differ somewhat from those based on distributions for the whole population, as would be expected from the greater statistical uncertainty in distributions of weight for gestational age based on controls, the overall results are similar to those shown in Table 2 and Figure 1. In addition, we used the combined controls from all studies as well as two external populations – the US11 and France12 – to allocate all participants into weight for gestational age categories, and the results were virtually unchanged (data not shown).
Meta-analysis of POBW
A total of 1,680 cases and 3,139 controls from three studies – Australia, USA (NCCLS) and UK – were included in the meta-analysis of POBW. The summary OR for a 1 SD increase (13.1% for Australia and UK, and 14.7% for USA (NCCLS)) was 1.16 (95% CI 1.09, 1.24). There was little evidence of heterogeneity (Figure 2). Excluding each study in turn made little difference to the summary ORs, which varied between 1.16 (95% CI 1.08, 1.14) and 1.17 (95% CI 1.09, 1.25).
Figure 2.
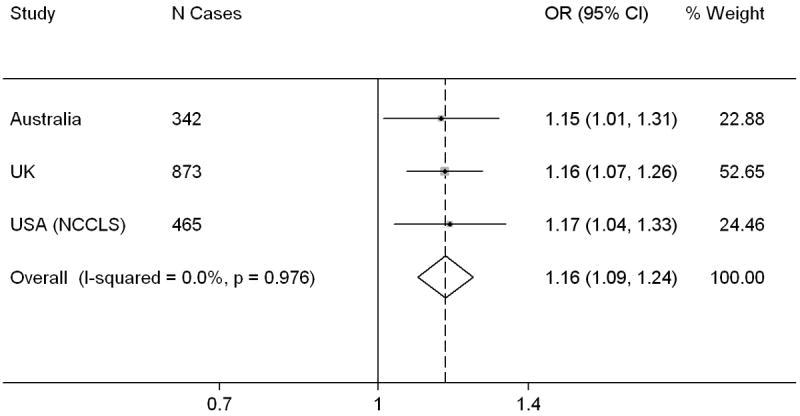
Forest plot showing individual and summary odds ratios for a one standard deviation increase in POBW, Childhood Leukemia International Consortium.
Subgroup meta-analyses among children with birth weight less than 4,000g and by immunophenotype (B-lineage and T-lineage) produced summary ORs consistent with the overall results (Supporting Information Figure 3).
Pooled analysis of POBW
Individual data from 1,689 cases and 3,154 controls from these three studies were available for inclusion in the pooled analysis. After adjustment for child’s age group, sex, year of birth group, mother’s age group, ethnic group, parental education and Study, the pooled OR for a 1 SD (13.0% overall) increase in POBW was 1.16 (95% CI 1.09, 1.24). The pooled ORs were similar when each study was excluded in turn, and in the subgroups examined (Table 4). The pooled OR for POBW among infants was close to unity, but the P-value for the POBW by age interaction term was 0.90.
Table 4.
Pooled ORs (95% CI) for Association Between POBW and Risk of Acute Lymphocytic Leukemia among 3 Studies1: Overall and by Subgroup, Childhood Leukemia International Consortium
| Subgroup | N Cases/controls | Pooled OR2 | 95% CI |
|---|---|---|---|
| Overall | 1,689/3,154 | 1.16 | 1.09, 1.24 |
| Excluding Australia | 1,345/2,394 | 1.16 | 1.08, 1.24 |
| Excluding UK | 816/1,502 | 1.16 | 1.07, 1.27 |
| Excluding USA (NCCLS) | 1,217/2,412 | 1.17 | 1.09, 1.26 |
| Birth weight <4,000g | 1,467/2,771 | 1.21 | 1.12, 1.31 |
| Sex of child3 | |||
| Males | 954/1,746 | 1.11 | 1.02, 1.21 |
| Females | 735/1,408 | 1.22 | 1.12, 1.34 |
| Age at diagnosis (years) 4 | |||
| 0-1 | 179/268 | 1.09 | 0.87, 1.37 |
| >1-5 | 971/1,769 | 1.17 | 1.08, 1.27 |
| >5 | 539/1,117 | 1.18 | 1.06, 1.31 |
| Ethnic Group5 | |||
| White/European/Caucasian | 1,281/2,583 | 1.14 | 1.06, 1.23 |
| Other | 408/571 | 1.22 | 1.08, 1.39 |
| Immunophenotype | |||
| B-lineage cases | 1,400/3,154 | 1.17 | 1.09, 1.24 |
| T-lineage cases | 161/3,154 | 1.22 | 1.04, 1.43 |
Australia, USA (NCCLS), and UK
ORs adjusted for child’s age group, sex, year of birth group, mother’s age group, parental education, ethnic group and study.
P-value of sex by POBW interaction term = 0.14
P-value of age by POBW interaction term = 0.90
P-value of ethnic group by POBW interaction term =0.39
Discussion
The results of both pooled and meta-analyses of international data from 12 case-control studies indicate that accelerated fetal growth is associated with an increased risk of childhood ALL. Importantly, this association was observed in children whose birth weight was <4,000g, thus suggesting that accelerated fetal growth is associated with an increased risk of ALL in the absence of high birth weight. In contrast, among children with birth weight ≥4000g, risk of ALL appeared to be little influenced by weight for gestational age. This apparent dependence of the relationship between fetal growth and risk of ALL on birth weight warrants further exploration. The overall increased risk of ALL associated with accelerated fetal growth was seen across the subgroups of sex, ethnicity and immunophenotype.
To our knowledge, all previously published studies of LGA or POBW and childhood ALL except one3 have been included in our CLIC meta-and pooled analyses. Through CLIC, we have been able to combine data on LGA and POBW from 12 and three (respectively) case-control studies, providing strong support for these associations – overall and within informative sub-groups. Exclusion from the analyses of each study in turn made little difference to the pooled/summary ORs. The results of the CLIC pooled analyses of LGA and POBW are consistent with those of all previously published studies, including the study not included which reported an OR of 1.66 (95% CI 1.32-2.10) for LGA.3
The reduced OR we observed for SGA is consistent with that of Sprehe and colleagues:3 OR 0.78; 95% CI: 0.57, 1.05. Schuz and colleagues, however, did not observe this reduction.2
Two different measures of fetal growth – one categorical (LGA vs AGA) and one continuous (POBW) – were used to investigate this association and the results were highly consistent, including when the same set of participants were analysed using these two measures. The similarity in results from the meta- and pooled analyses provide additional support for the validity of the associations observed.
This study had some limitations. Data on birth weight and gestational age (necessary for the calculation of both POBW and LGA) were reported by the mother in nine studies, and abstracted from medical records in three studies. Although mothers’ reports of birth weight have been shown to be highly correlated with data obtained from medical records,13this has not been established for gestational age. Our results may have been affected by inaccuracies in maternal recall and reporting of gestational age; however, such inaccuracies are likely to be similar among cases and controls, particularly as birth weight and gestational age are not widely known to be possible risk factors for childhood cancer. Therefore, the most likely effect of this error in exposure measurement is under-estimation of the strength of association, rather than the introduction of bias and distortion of the association.
Data on gestational age were missing for a high proportion of participants in two studies (57.9% for Greece and 23.4% for Australia); sensitivity analyses, however, showed little change in results after removal of these studies. Gestational age data were missing for similar proportions of cases and controls in eight of the 12 studies, for a higher proportion of cases than controls in two studies (USA (NCCLS) and France (Electre)), and for a higher proportion of controls than cases in two studies (Australia and Greece). Any impact of these missing data on study results is difficult to predict and probably unlikely.
Published population-based birth weight for gestational age centiles – on which we based our LGA/AGA/SGA estimates – may include babies who died shortly after birth. As early infant death is associated with low birth weight,14, 15 the inclusion of these babies in the population centiles, but not in the case-control studies, may have led to over-estimation of the proportion of study children who were LGA and under-estimation of the proportion who were SGA. This is consistent with our observation that the percentage of LGA children was higher than 10 percent in nine of the 12 studies, and the percentage of SGA controls was less than 10 percent in five of the 12 studies. As the same standards were applied to cases and controls in each study, any over-estimation of percent LGA is unlikely to have introduced substantial bias in the study-specific ORs.
A related issue is that percentages of LGA children varied among the studies, despite the use of the published birth centiles from the most relevant populations available and from time periods overlapping subject recruitment in each study. The reasons for the variation are not clear, but they may reflect differences in the study participants relative to the underlying populations and/or chance variation. To determine the possible impact of these issues on our results, we re-analysed the data using the 90th percentile among controls in each individual study to assign LGA, with little change in the results; this consistency suggests our findings are robust.
As is often observed in case-control studies,16 the controls in the CLIC member studies had higher SES – variously classified – than the case families (data not shown), and this difference, if SES were also related to exposure, could potentially confound the association between exposure and disease. At least one measure of SES was available for all studies, and it was positively associated with LGA in five of 12 studies [Canada, France (all 3 studies) and UK]. Therefore, the appropriate SES variable was included in all models estimating study-specific ORs; parental education level – the only SES variable common to all studies – was included in the pooled analysis. Given our empirical evidence that LGA was associated with higher SES (at least in some studies) and the likelihood that controls are of higher SES than the source population, the most likely effect of confounding or bias associated with SES would be to underestimate the effect of increased fetal growth on risk of ALL. Classification of non-Caucasian participants into weight for gestational age categories based on largely Caucasian reference groups may have led to some misclassification, but this was probably non-differential for cases and controls.
Each of the analytical methods used has advantages and disadvantages. The primary advantage of meta-analysis of study-specific ORs is that matching between cases and controls can be retained, and study-specific confounding variables can be included in their original form. This is not possible in a pooled analysis of individual data if potentially confounding variables were classified differently or not collected in some studies; one or the other was the case for ethnicity, income and education in this study. The main advantage of pooled analysis is that it is possible to conduct subgroup analyses, even when the numbers of participants in particular subgroups are small in individual studies. Meta-analysis is often not possible in this situation, as small numbers may preclude estimation of study-specific ORs. In addition, pooled analysis can offer greater precision for effect estimates if heterogeneity between studies is low, as in this analysis.17
The similarity among the results of the analysis of POBW using data from three studies, LGA using these same three studies, and LGA using data from all 12 studies, provides confidence that both are useful measures of accelerated intra-uterine growth. The disadvantage of using weight for gestational age categories is that, by definition, only approximately 10% of most study populations will be in the LGA category, so even large studies may have limited statistical power, particularly when sub-group analyses are important.
As discussed in previous reports, an association between accelerated fetal growth and risk of ALL is biologically plausible, and suggests involvement of fetal growth factors.3, 5, 18-21 Insulin-like growth factor 1 (IGF-1) is involved in cell proliferation and prevention of apoptosis.18, 19, 21 There is empirical evidence for a relationship between IGF-1, birth weight and leukemia. IGF-1 levels have been found to be lower in SGA babies and higher in LGA babies.22 In addition, knock-out mouse models confirm the role of IGF-1 in murine fetal growth.23 Studies have also found that IGF-2 is associated with ALL24 and AML,25 and IGFs are known to be involved in the regulation of normal and malignant haematopoiesis.26 It has been proposed that high levels of bioavailable IGFs would increase the likelihood of ALL development because lymphocytes (or their precursors) with acquired genetic damage would be less likely to undergo apoptosis and more likely to divide.21 Associations observed between accelerated fetal growth and risk of other childhood cancers2, 21, 27, 28 suggest that the proliferative and anti-apoptotic effects of IGF may also be involved in their development.
The evidence for a positive association between accelerated fetal growth and risk of childhood ALL is strong and consistent. Future studies should focus on investigating the mechanisms that underlie this association. Exploring it among cytogenetic subtypes of ALL may offer clues to the mechanisms.
Supplementary Material
Novelty and impact.
Over twenty studies of perinatal risk factors for childhood acute lymphoblastic leukemia (ALL) have reported an increased risk associated with high birth weight, but most have not distinguished between high birth weight per se and accelerated fetal growth by accounting for gestation age. This study involved pooling original data from 12 case-control studies internationally to investigate specifically the association of accelerated fetal growth and ALL. The findings were relatively consistent across studies and positive overall.
Acknowledgments
We wish to thank Dr Eve Blair who developed the POBW measure and advised us regarding its use, and Alice Kang, Project Manager of the Childhood Leukemia International Consortium (CLIC). We thank all the participants and their families for their contribution to these studies.
The Aus-ALL consortium conducted the study and the Telethon Institute for Child Health Research (TICHR), University of Western Australia, was the coordinating centre. Bruce Armstrong (Sydney School of Public Health), Elizabeth Milne (TICHR), Frank van Bockxmeer (Royal Perth Hospital), Michelle Haber (Children’s Cancer Institute Australia), Rodney Scott (University of Newcastle), John Attia (University of Newcastle), Murray Norris (Children’s Cancer Institute Australia), Carol Bower (TICHR), Nicholas de Klerk (TICHR), Lin Fritschi (WA Institute for Medical Research), Ursula Kees (TICHR), Margaret Miller (Edith Cowan University), Judith Thompson (WA Cancer Registry) were the research investigators and Helen Bailey (TICHR) was the project coordinator. The clinical Investigators were: Frank Alvaro (John Hunter Hospital, Newcastle); Catherine Cole (Princess Margaret Hospital for Children, Perth); Luciano Dalla Pozza (Children’s Hospital at Westmead, Sydney); John Daubenton (Royal Hobart Hospital, Hobart); Peter Downie (Monash Medical Centre, Melbourne); Liane Lockwood, (Royal Children’s Hospital, Brisbane); Maria Kirby (Women’s and Children’s Hospital, Adelaide); Glenn Marshall (Sydney Children’s Hospital, Sydney); Elizabeth Smibert (Royal Children’s Hospital, Melbourne); Ram Suppiah, (previously Mater Children’s Hospital, Brisbane).
The UKCCS was conducted by 12 teams of investigators (10 clinical and epidemiological and two biological) based in university departments, research institutes, and the National Health Service in Scotland. Its work is coordinated by a management committee. Further information can be found on the web-site www.ukccs.org.
The Northern California Childhood Leukemia Study (NCCLS) was conducted in northern and central California from 1995 to 2008 and included the following clinical collaborators and participating hospitals: University of California Davis Medical Center (Dr. Jonathan Ducore), University of California San Francisco (Dr. Mignon Loh and Dr Katherine Matthay), Children’s Hospital of Central California (Dr. Vonda Crouse), Lucile Packard Children’s Hospital (Dr. Gary Dahl), Children’s Hospital Oakland (Dr. James Feusner), Kaiser Permanente Sacramento (Dr. Vincent Kiley), Kaiser Permanente Santa Clara (Dr. Carolyn Russo and Dr. Alan Wong), Kaiser Permanente San Francisco (Dr. Kenneth Leung), and Kaiser Permanente Oakland (Dr. Stacy Month). Key investigators and staff during the conduct of the study include Patricia A. Buffler (PI), Catherine Metayer (UCB), Anand Chokkalingam (UCB), Joe Wiemels (UCSF), Xiaomei Ma (Yale University), Monique Does (UCB), Pagan Morris (UCB), and Alice Kang (UCB). The study is continuing as the California Childhood Leukemia Study with support from the National Institutes of Health (National Institute of Environmental Health Sciences and the National Cancer Institute).
GCCR: The German study was conducted by the nationwide German Childhood Cancer Registry (GCCR) at the Institute of Medical Biostatistics, Epidemiology and Informatics at the Johannes Gutenberg-University Mainz; researchers involved were Drs Jörg Michaelis (head), Peter Kaatsch, Uwe Kaletsch, Rolf Meinert, Anke Miesner and Joachim Schüz.
COG: The E15 cohort of the Children’s Oncology Group was identified by CCG (Children’s Cancer Group) principle and affiliate member institutions. Further information can be found on the web-site: http://www.curesearch.org/
The NZCCS was co-ordinated at the University of Otago, where the study team included JD Dockerty, GP Herbison (who helped prepare data for this pooled analysis), DCG Skegg and JM Elwood.
NARECHEM Greek Pediatric Hematology Oncology Clinicians: Margarita Baka MD: Department of Pediatric Hematology –Oncology, “Pan.&Agl. Kyriakou” Children’s Hospital, Athens, Greece, Thivon & Levadeias, Goudi; Maria Moschovi MD: Hematology-Oncology Unit, First Department of Pediatrics, Athens University Medical School, “Aghia Sophia” General Children’s Hospital, Athens, Greece, Thivon & Papadiamantopoulou, Goudi, 11527 Athens, Greece; Sophia Polychronopoulou MD: Department of Pediatric Hematology-Oncology, “Aghia Sophia” General Children’s Hospital, Athens, Greece, Thivon & Papadiamantopoulou, Goudi, 11527 Athens, Greece; Fani Athanassiadou MD: 2nd Department of Pediatrics, Aristotelion University of Thessaloniki, AHEPA General Hospital, Thessaloniki, Greece, 1 St. Kyriakidi, 54636 Thessaloniki, Greece; Ioanna Fragandrea MD: Pediatric Oncology Department, Hippokration Hospital, Thessaloniki, Greece ; Eftichia Stiakaki MD: Department of Pediatric Hematology-Oncology, University Hospital of Heraklion, Heraklion, Greece. Charalampia Papadopoulou MD and Ioannis Matsoukis MD: Department of Hygiene, Epidemiology and Medical Statistics, Athens University Medical School, 11527 Athens, Greece helped prepare the data.
BCSG-IAL (Brazil) acknowledge their study pediatricians: Fernando A Werneck, Jane Dobbin (Rio de Janiero), Isis Q. Magalhães (Brasilia), Vitória Pinheiro, Silvia Brandalise (Campinas), Imaruí Costa (Florianopolis), Lilian M. Bulacchini de Carvalho, Nilma Pimentel Brito, Eny Guimarães de Carvalho (Salvador), Virginia M. Cóser (Santa Maria), Gilberto Ramos (Belo Horizonte), Flávia Pimenta, Eloisa Cartaxo (Joao Pessoa), José Carlos Cordoba (Goiania), Rosania Baseggio (Campo Grande), Alejandro Aranciba, Renato Melarangno (Sao Paulo), Mara A.D. Pianovsky, Flora M.Watanabe (Parana).
The French authors would like to thank all of the Société Française de lutte contre les Cancers de l’Enfant et de l’Adolescent (SFCE) principal investigators: André Baruchel (Hôpital Saint-Louis/Hôpital Robert Debré, Paris), Claire Berger (Centre Hospitalier Universitaire, Saint-Etienne), Christophe Bergeron (Centre Léon Bérard, Lyon), Jean-Louis Bernard (Hôpital La Timone, Marseille), Yves Bertrand (Hôpital Debrousse, Lyon), Pierre Bordigoni (Centre Hospitalier Universitaire, Nancy), Patrick Boutard (Centre Hospitalier Régional Universitaire, Caen), Gérard Couillault (Hôpital d’Enfants, Dijon), Christophe Piguet (Centre Hospitalier Régional Universitaire, Limoges), Anne-Sophie Defachelles (Centre Oscar Lambret, Lille), François Demeocq (Hôpital Hôtel-Dieu, Clermont-Ferrand), Alain Fischer (Hôpital des Enfants Malades, Paris), Virginie Gandemer (Centre Hospitalier Universitaire – Hôpital Sud, Rennes), Dominique Valteau-Couanet (Institut Gustave Roussy, Villejuif), Jean-Pierre Lamagnere (Centre Gatien de Clocheville, Tours), Françoise Lapierre (Centre Hospitalier Universitaire Jean Bernard, Poitiers), Guy Leverger (Hôpital Armand-Trousseau, Paris), Patrick Lutz (Hôpital de Hautepierre, Strasbourg), Geneviève Margueritte (Hôpital Arnaud de Villeneuve, Montpellier), Françoise Mechinaud (Hôpital Mère et Enfants, Nantes), Gérard Michel (Hôpital La Timone, Marseille), Frédéric Millot (Centre Hospitalier Universitaire Jean Bernard, Poitiers), Martine Münzer (American Memorial Hospital, Reims), Brigitte Nelken (Hôpital Jeanne de Flandre, Lille), Hélène Pacquement (Institut Curie, Paris), Brigitte Pautard (Centre Hospitalier Universitaire, Amiens), Stéphane Ducassou (Hôpital Pellegrin Tripode, Bordeaux), Alain Pierre-Kahn (Hôpital Enfants Malades, Paris), Emmanuel Plouvier (Centre Hospitalier Régional, Besançon), Xavier Rialland (Centre Hospitalier Universitaire, Angers), Alain Robert (Hôpital des Enfants, Toulouse), Hervé Rubie (Hôpital des Enfants, Toulouse), Stéphanie Haouy (Hôpital Arnaud de Villeneuve, Montpellier), Christine Soler (Fondation Lenval, Nice), and Jean-Pierre Vannier (Hôpital Charles Nicolle, Rouen).
Funding
Childhood Leukemia International Consortium administration is supported by the National Cancer Institute NCI, USA (grant R03CA132172) and the UK Charity Children with Cancer.
Individual study funding was provided by the following sources:
Australia
Aus-ALL was supported by the Australian National Health and Medical Research Council (Grant ID 254539) and the Cancer Council of Western Australia;
USA (NCCLS)
NCCLS is supported by the National Institute of Environmental Health Sciences (NIEHS), USA (grants R01 ES09137 and P42-ES04705) and the Children with Cancer, UK (former Children with Leukaemia) for data collection. The content is solely the responsibility of the authors and does not necessarily represent the official views of the NIEHS or NCI.
United Kingdom
The United Kingdom Childhood Cancer Study (UKCCS) is sponsored and administered by Leukaemia and Lymphoma Research. The researchers are independent from the funders.
Germany
The German study (GCCR) was supported by a grant from the Federal Ministry of the Environment, Nuclear Safety and Nature Preservation.
Greece
NARECHEM’s establishment was co-funded by a DGSANCO grant, whereas the ongoing case control study is funded in part by the National and Kapodistrian University of Athens, Greece
USA (COG)
The COG E-15 study was funded by National Cancer Institute grant R01CA048051 and the Children’s Cancer Research Fund, Minneapolis, MN.
New Zealand
The New Zealand Childhood Cancer Study was funded by the Health Research Council of NZ (MRC Ref no. 91/24 and HRC Ref no. 93/23), the NZ Lottery Grants Board, the Otago Medical School (Faculty Bequest Funds), the Cancer Society of NZ (Grant no. 959/4), the Otago Medical Research Foundation, and the A.B. de Lautour Charitable Trust.
France (Adele, Electre, Escale)
Adele was funded by grants from INSERM, the French Ministère de l’Environnement, the Association pour la Recherche contre le Cancer, the Fondation de France, the Fondation Jeanne Liot, the Fondation Weisbrem-Berenson, the Ligue Contre le Cancer du Val de Marne, and the Ligue Nationale Contre le Cancer.
Electre Funding was funded by grants from INSERM, the Ministère de l’Environnement et de l’Aménagement du Territoire, the Fondation pour la Recherche Médicale, the Association pour la Recherche contre le Cancer, the Fondation de France, and the Institut Electricité Santé.
Escale was funded by grants from INSERM, the Fondation de France, the Association pour la Recherche sur le Cancer (ARC), the Agence Française de Sécurité Sanitaire des Produits de Santé (AFSSAPS), the Agence Française de Sécurité Sanitaire de l’Environnement et du Travail (AFSSET), the association Cent pour sang la vie, the Institut National du Cancer (INCa), the Agence Nationale de la Recherche (ANR), and the Cancéropôle Ile de France
Québec, Canada
The Québec study was funded by: The National Cancer Institute of Canada (#014113 and #010735-CCERN #RFA0405); the Medical Research Council of Canada (MOP 37951); the Fonds de la recherche en santé du Québec (#981141); the Bureau of Chronic Disease Epidemiology, Health and Welfare Canada; the Leukemia Research Fund of Canada; and the National Health and Research Development Program, Ottawa
Abbreviations
- AGA
Appropriate-for-gestational-age
- ALL
Acute lymphoblastic leukemia
- CI
Confidence Interval
- CLIC
Childhood Leukemia International Consortium
- IGF
Insulin-like growth factor
- LGA
Large-for-gestational-age
- OR
Odds ratio
- POBW
Proportion of optimal birth weight
- SES
Socioeconomic status
- SGA
Small-for-gestational-age
Footnotes
Authorship: All authors are principal investigators, co-investigators or designates of participating CLIC studies. All authors have reviewed the manuscript.
Conflict of Interest: None Identified.
References
- 1.Caughey RW, Michels KB. Birth weight and childhood leukemia: a meta-analysis and review of the current evidence. Int J Cancer. 2009;124:2658–70. doi: 10.1002/ijc.24225. [DOI] [PubMed] [Google Scholar]
- 2.Schüz J, Forman MR. Birthweight by gestational age and childhood cancer. Cancer Causes Control. 2007;18:655–63. doi: 10.1007/s10552-007-9011-y. [DOI] [PubMed] [Google Scholar]
- 3.Sprehe MR, Barahmani N, Cao Y, Wang T, Forman MR, Bondy M, Okcu MF. Comparison of birth weight corrected for gestational age and birth weight alone in prediction of development of childhood leukemia and central nervous system tumors. Pediatr Blood Cancer. 2010;54:242–9. doi: 10.1002/pbc.22308. [DOI] [PMC free article] [PubMed] [Google Scholar]
- 4.Blair E, Liu X, de Klerk N, Lawrence D. Optimal fetal growth for the Caucasian singleton and assessment of appropriateness of fetal growth: an analysis of a total population perinatal database. BMC Pediatr. 2005;5 doi: 10.1186/1471-2431-5-13. [DOI] [PMC free article] [PubMed] [Google Scholar]
- 5.Milne E, Royle JA, de Klerk NH, Blair E, Bailey H, Cole C, Attia J, Scott RJ, Armstrong BK. Fetal growth and risk of childhood acute lymphoblastic leukemia: results from an Australian case-control study. Am J Epidemiol. 2009;170:221–8. doi: 10.1093/aje/kwp117. [DOI] [PubMed] [Google Scholar]
- 6.Milne E, Laurvick CL, Blair E, Bower C, de Klerk N. Fetal Growth and Acute Childhood Leukemia: Looking Beyond Birth Weight. Am J Epidemiol. 2007;166:151–9. doi: 10.1093/aje/kwm065. [DOI] [PubMed] [Google Scholar]
- 7.Metayer C, Milne E, Clavel J, Infante-Rivard C, Petridou E, Taylor M, Schüz J, Spector LG, Dockerty JD, Magnani C, Pombo-de-Oliveira MS, Sinnett D, et al. The Childhood Leukemia International Consortium. Cancer Epidemiol. 2013;37:336–47. doi: 10.1016/j.canep.2012.12.011. [DOI] [PMC free article] [PubMed] [Google Scholar]
- 8.Fleiss JL. The statistical basis of meta-analysis. Stat Methods Med Res. 1993;2:121–45. doi: 10.1177/096228029300200202. [DOI] [PubMed] [Google Scholar]
- 9.Bower C, Rudy E, Callaghan A, Quick J, Cosgrove P. Report of the Birth Defects Registry of Western Australia 1980-2009. Subiaco: Department of Health, Government of Western Australia; 2010. [Google Scholar]
- 10.Higgins JPT, Thompson SG, Deeks JJ, Altman DG. Measuring inconsistency in meta-analyses. Br Med J. 2003;327:557–60. doi: 10.1136/bmj.327.7414.557. [DOI] [PMC free article] [PubMed] [Google Scholar]
- 11.Oken E, Kleinman KP, Rich-Edwards J, Gillman MW. A nearly continuous measure of birth weight for gestational age using a United States national reference. BMC Pediatr. 2003;3:6. doi: 10.1186/1471-2431-3-6. [DOI] [PMC free article] [PubMed] [Google Scholar]
- 12.Mamelle N, Munoz F, Grandjean H. Croissance foetale à partir de l’étude AUDIPOG. I. Etablissement de courbes de référence. J Gynecol Obstet Biol Reprod (Paris) 1996;25:61–70. [Fetal growth from the AUDIPOG study. I. Establishment of reference curves]. [PubMed] [Google Scholar]
- 13.Olson JE, Shu XO, Ross JA, Pendergrass T, Robison LL. Medical record validation of maternally reported birth characteristics and pregnancy-related events: a report from the Children’s Cancer Group. Am J Epidemiol. 1997;145:58–67. doi: 10.1093/oxfordjournals.aje.a009032. [DOI] [PubMed] [Google Scholar]
- 14.Malloy MH. Size for gestational age at birth: impact on risk for sudden infant death and other causes of death, USA 2002. Arch Dis Child Fetal Neonatal Ed. 2007;92:F473–8. doi: 10.1136/adc.2006.107094. [DOI] [PMC free article] [PubMed] [Google Scholar]
- 15.McIntire DD, Bloom SL, Casey BM, Leveno KJ. Birth weight in relation to morbidity and mortality among newborn infants. N Engl J Med. 1999;340:1234–8. doi: 10.1056/NEJM199904223401603. [DOI] [PubMed] [Google Scholar]
- 16.Law GR, Smith AG, Roman E. The importance of full participation: lessons from a national case- control study. Br J Cancer. 2002;86:350–5. doi: 10.1038/sj.bjc.6600092. [DOI] [PMC free article] [PubMed] [Google Scholar]
- 17.Blettner M, Sauerbrei W, Schlehofer B, Scheuchenpflug T, Friedenreich C. Traditional reviews, meta-analyses and pooled analyses in epidemiology. Int J Epidemiol. 1999;28:1–9. doi: 10.1093/ije/28.1.1. [DOI] [PubMed] [Google Scholar]
- 18.Ross JA, Perentesis JP, Robison LL, Davies SM. Big babies and infant leukemia: a role for insulin-like growth factor-1? Cancer Causes Control. 1996;7:553–9. doi: 10.1007/BF00051889. [DOI] [PubMed] [Google Scholar]
- 19.Petridou E, Dessypris N, Spanos E, Mantzoros C, Skalkidou A, Kalmanti M, Koliouskas D, Kosmidis H, Panagiotou JP, Piperopoulou F, Tzortzatou F, Trichopoulos D. Insulin-like growth factor-I and binding protein-3 in relation to childhood leukaemia. Int J Cancer. 1999;80:494–6. doi: 10.1002/(sici)1097-0215(19990209)80:4<494::aid-ijc2>3.0.co;2-k. [DOI] [PubMed] [Google Scholar]
- 20.Petridou E, Skalkidou A, Dessypris N, Moustaki M, Mantzoros C, Spanos E, Trichopoulos D. Endogenous risk factors for childhood leukemia in relation to the IGF system (Greece). The Childhood Haematologists-Oncologists Group. Cancer Causes Control. 2000;11:765–71. doi: 10.1023/a:1008988819494. [DOI] [PubMed] [Google Scholar]
- 21.Callan AC, Milne E. Involvement of the IGF system in fetal growth and childhood cancer: an overview of potential mechanisms. Cancer Causes Control. 2009;20:1783–98. doi: 10.1007/s10552-009-9378-z. [DOI] [PubMed] [Google Scholar]
- 22.Verhaeghe J, Van Bree R, Van Herck E, Laureys J, Bouillon R, Van Assche FA. C-peptide, insulin-like growth factors I and II, and insulin-like growth factor binding protein-1 in umbilical cord serum: correlations with birth weight. Am J Obstet Gynecol. 1993;169:89–97. doi: 10.1016/0002-9378(93)90137-8. [DOI] [PubMed] [Google Scholar]
- 23.Baker J, Liu JP, Robertson EJ, Efstratiadis A. Role of insulin-like growth factors in embryonic and postnatal growth. Cell. 1993;75:73–82. [PubMed] [Google Scholar]
- 24.Vorwerk P, Mohnike K, Wex H, Rohl FW, Zimmermann M, Blum WF, Mittler U. Insulin-like growth factor binding protein-2 at diagnosis of childhood acute lymphoblastic leukemia and the prediction of relapse risk. J Clin Endocrinol Metab. 2005;90:3022–7. doi: 10.1210/jc.2004-0461. [DOI] [PubMed] [Google Scholar]
- 25.Wu HK, Weksberg R, Minden MD, Squire JA. Loss of imprinting of human insulin-like growth factor II gene, IGF2, in acute myeloid leukemia. Biochem Biophys Res Commun. 1997;231:466–72. doi: 10.1006/bbrc.1997.6127. [DOI] [PubMed] [Google Scholar]
- 26.Zumkeller W, Burdach S. The insulin-like growth factor system in normal and malignant hematopoietic cells. Blood. 1999;94:3653–7. [PubMed] [Google Scholar]
- 27.Rangel M, Cypriano M, de Martino Lee M, Luisi F, Petrilli A, Strufaldi M, Franco M. Leukemia, non-Hodgkin’s lymphoma, and Wilms tumor in childhood: the role of birth weight. Eur J Pediatr. 2010;169:875–81. doi: 10.1007/s00431-010-1139-1. [DOI] [PubMed] [Google Scholar]
- 28.Milne E, Laurvick CL, Blair E, de Klerk N, Charles AK, Bower C. Fetal growth and the risk of childhood CNS tumors and lymphomas in Western Australia. Int J Cancer. 2008;123:436–43. doi: 10.1002/ijc.23486. [DOI] [PubMed] [Google Scholar]
- 29.Roberts CL, Lancaster PA. Australian national birthweight percentiles by gestational age. Med J Aust. 1999;170:114–8. doi: 10.5694/j.1326-5377.1999.tb127678.x. [DOI] [PubMed] [Google Scholar]
- 30.Yudkin PL, Aboualfa M, Eyre JA, Redman CW, Wilkinson AR. New birthweight and head circumference centiles for gestational ages 24 to 42 weeks. Early Hum Dev. 1987;15:45–52. doi: 10.1016/0378-3782(87)90099-5. [DOI] [PubMed] [Google Scholar]
- 31.Voigt M, Schneider KTM, Jährig K. Analyse des Geburtengutes des Jahrgangs 1992 der Bundesrepublik Deutschland. Geburtshilfe Frauenheilkd. 1996;56:550–8. doi: 10.1055/s-2007-1023283. [Analysis of the total number of births in 1992 in the Federal Republic of Germany]. [DOI] [PubMed] [Google Scholar]
- 32.Rousseau T, Ferdynus C, Quantin C, Gouyon JB, Sagot P. Poids des nouveau-nés issus de grossesses uniques et non compliquées entre 28 et 42 semaines d’aménorrhée à partir des données du réseau périnatal de la région Bourgogne. J Gynecol Obstet Biol Reprod (Paris) 2008;37:589–96. doi: 10.1016/j.jgyn.2008.01.009. [Liveborn birth-weight of single and uncomplicated pregnancies between 28 and 42 weeks of gestation from Burgundy perinatal network]. [DOI] [PubMed] [Google Scholar]
- 33.Arbuckle TE, Wilkins R, Sherman GJ. Birth weight percentiles by gestational age in Canada. Obstet Gynecol. 1993;81:39–48. [PubMed] [Google Scholar]
- 34.Festini F, Procopio E, Taccetti G, Repetto T, Cioni ML, Campana S, Mergni G, Mascherini M, Marianelli L, de Martino M. Birth weight for gestational age centiles for Italian neonates. J Matern Fetal Neonatal Med. 2004;15:411–7. doi: 10.1080/147670410001728223. [DOI] [PubMed] [Google Scholar]
- 35.Gonzalez RP, Gomez RM, Castro RS, Nien JK, Merino PO, Etchegaray AB, Carstens MR, Medina LH, Viviani PG, Rojas IT. A national birth weight distribution curve according to gestational age in Chile from 1993 to 2000. Rev Med Chil. 2004;132:1155–65. doi: 10.4067/s0034-98872004001000001. [DOI] [PubMed] [Google Scholar]
Associated Data
This section collects any data citations, data availability statements, or supplementary materials included in this article.