

Abstract
Background
The many attempts that have been made to identify genes for bipolar disorder (BD) have met with limited success, which may reflect an inadequacy of diagnosis as an informative and biologically relevant phenotype for genetic studies. Here we have explored aspects of personality as quantitative phenotypes for bipolar disorder through the use of the Temperament and Character Inventory (TCI), which assesses personality in seven dimensions. Four temperament dimensions are assessed: novelty seeking (NS), harm avoidance (HA), reward dependence (RD), and persistence (PS). Three character dimensions are also included: self-directedness (SD), cooperativeness (CO), and self-transcendence (ST).
Methods
We compared personality scores between diagnostic groups and assessed heritability in a sample of 101 families collected for genetic studies of BD. A genome-wide SNP linkage analysis was then performed in the subset of 51 families for which genetic data was available.
Results
Significant group differences were observed between BD subjects, their first-degree relatives, and independent controls for all but RD and PS, and all but HA and RD were found to be significantly heritable in this sample. Linkage analysis of the heritable dimensions produced several suggestive linkage peaks for NS (chromosomes 7q21 and 10p15), PS (chromosomes 6q16, 12p13, and 19p13), and SD (chromosomes 4q35, 8q24, and 18q12).
Limitations
The relatively small size of our linkage sample likely limited our ability to reach genome-wide significance in this study.
Conclusions
While not genome-wide significant, these results suggest that aspects of personality may prove useful in the identification of genes underlying BD susceptibility.
Keywords: bipolar disorder, personality, TCI, heritability, genetic linkage
INTRODUCTION
Bipolar disorder (BD) is a severe mood disorder that affects approximately 1% of the population and is characterized by episodes of major depression interspersed with periods of mania (bipolar I) or hypomania (bipolar II) (Goodwin and Jameson, 1990). Family, twin, and adoption studies, have suggested that BD is familial with a substantial genetic component and an estimated heritability of approximately 80% (Craddock and Jones, 1999; Taylor et al., 2002). Despite this high heritability, the many attempts have been made over the last few decades to identify genetic variants contributing to BD susceptibility have met with limited success. Linkage and association studies have implicated numerous chromosomal regions and candidate genes with significant evidence for an involvement in BD, yet the causal variants have remained elusive (Serretti and Mandelli, 2008). Recent genome-wide association studies (GWAS) of BD and large meta-analyses of several thousand subjects have produced significant evidence for association to some interesting new candidates, yet these loci explain only 1–2% of BD susceptibility (Baum et al., 2007; Ferreira et al., 2008; Psychiatric GWAS Consortium Bipolar Disorder Working Group, 2011; Scott et al., 2009; Sklar et al., 2008; Smith et al., 2009; Wellcome Trust Case Control Consortium, 2007).
While the difficulties in identifying genes for BD have generally been attributed to genetic heterogeneity and small gene effects, it is also likely that the categorical diagnostic systems (DSM and others) used in genetic studies are limited in their ability to capture the tremendous clinical heterogeneity observed in BD probands and their families (Gershon et al., 1982; Kelsoe, 2003; Price et al., 1985). Since traditional diagnostic systems are based on symptomatology, rather than etiology, they may not adequately reflect with the underlying pathology. As some have suggested BD, may be better conceptualized as part of a continuous distribution of clinical variation, ranging from very mild and subclinical to severe, consistent with a polygenic trait influenced by the interaction of many genes of small effect (Akiskal, 1983; Akiskal and Pinto, 2000; Kelsoe, 2003). Thus, the use of a quantitative phenotype to model this variation may be a powerful tool for elucidating the genetic architecture of BD.
The variation in the presentation, course, and underlying pathology that is observed among patients with BD and other mood disorders has been shown to be associated with personality traits, which may serve as useful endophenotypes in genetic studies (Lara and Akiskal, 2006; Lara et al., 2006; Loftus et al., 2008; Savitz et al., 2008a). Endophenotypes are quantitative phenotypes that relate to specific neurobiological functions associated with a disorder and demonstrate reliability, stability, and heritability (Gottesman and Gould, 2003). Several questionnaires evaluating personality are available, including the Temperament and Character Inventory, 125-question version (TCI-125), which is a self-administered true/false questionnaire that assesses personality according to Cloninger’s psychobiological model (Cloninger et al., 1993). Temperament refers to automatic emotional responses to experience and is measured in four dimensions: novelty seeking (NS), harm avoidance (HA), reward dependence (RD), and persistence (PS). Character refers to self-concepts and individual differences in goals and values and is measured in three dimensions: self-directedness (SD), cooperativeness (CO), and self-transcendence (ST). These temperament and character dimensions interact to form an individual’s personality with certain interactions presumably leading to mood and other psychiatric disorders. Previous studies of the TCI in mood disorders have shown that subjects with BD score higher on the NS, HA, and ST dimensions than the general population (Harley et al., 2011; Loftus et al., 2008; Young et al., 1995), while subjects with major depressive disorder (MDD) score higher on NS and HA but lower on SD, CO, and ST (Bayon et al., 1996; Cloninger et al., 1994; Farmer et al., 2003; Hansenne et al., 1999; Harley et al., 2011; Marijnissen et al., 2002; Svrakic et al., 1993; Young et al., 1995). Thus, subjects with mood disorders appear to possess personality traits that are significantly different from non-ill individuals. Importantly, the TCI has been shown to have very good reliability, internal consistency, and stability over time (Cloninger et al., 1994; Cloninger et al., 1993; Heath et al., 1994; Keller et al., 2005), as well as evidence of heritability in the general population (Heath et al., 1994; Heiman et al., 2003; Keller et al., 2005).
Here we have used the TCI to assess the utility of personality dimensions as endophenotypes to aid in dissecting the underlying genetic architecture of BD. We evaluated personality dimension scores for subjects with BD, relatives with MDD, and their clinically unaffected relatives with comparison to an independent sample of control subjects. We have previously reported evidence for the familiality of personality in BD (Evans et al., 2005). We now report evidence for the heritability of five personality dimensions in 101 BD families and the results of a subsequent genetic linkage analysis of 51 families genotyped for a single nucleotide polymorphism (SNP) linkage panel. Even in this post-GWAS era, linkage remains a valuable tool for the detection of the aggregate effects of multiple rare and common variants within a gene or region.
METHODS
Subjects
Subjects from BD families were selected from three different data sets collected for genetic studies of BD. The primary dataset (University of California San Diego, UCSD) was recruited at one of three sites (San Diego, Vancouver, and Cincinnati) as part of a collaborative genetic linkage study of BD (Kelsoe et al., 2001). The other two data sets were recruited at UCSD as part of the National Institute of Mental Health (NIMH) Genetics Initiative for Bipolar Disorder Waves 3 and 4 (Dick et al., 2003). Since the TEMPS-A was only administered at the San Diego site of the NIMH consortium, data was not available for the rest of the NIMH collection. Families were first identified through a proband diagnosed with bipolar I disorder or bipolar II disorder (UCSD sample) or a bipolar I sibling pair (Waves 3 and 4). Each subject was interviewed and diagnosed using either a modified version of the Structured Clinical Interview for DSM-III-R (SCID) or the Diagnostic Interview for Genetics Studies (DIGS) (Nurnberger et al., 1994; Spitzer et al., 1992). Interviewers were extensively trained and reliability was regularly tested. A panel of clinicians reviewed the interview, medical records, and information from family informants in order to make a final DSM-IV diagnosis. Control subjects were ascertained by advertising in the UCSD Mental Health Clinical Research Center and screened using the SCID for the absence of psychiatric illness. The TCI-125 was also administered to all subjects at the time of interview, and blood was drawn for the establishment of lymphoblastoid cell lines. All subjects provided written informed consent according to procedures approved by the local Institutional Review Board of each university.
The final sample included 670 subjects from 101 families with TCI data available for 428 subjects with the following diagnoses: 129 subjects (30.2%) with bipolar I (BDI), 39 (9.1%) with bipolar II (BDII), 9 (2.1%) with schizoaffective disorder, bipolar-type (SA-BP), 99 (23.2%) with recurrent major depression (MDD-R), 18 (4.2%) with a single episode of major depression (MDD-SE), 122 (28.6%) with no history of mood disorders, and 11 (2.6%) of unknown diagnoses. These data, along with the number of informative relative pairs, are summarized in Table 1. We also included an independent sample of 53 control subjects with no personal or family history of mental illness. This sample is approximately 62% female with an average age at interview of 45 (±17). All subjects were Caucasians of European ancestry.
Table 1.
Summary of the subjects and families included in the heritability and linkage analyses.
| Family Information | Heritability | Linkage |
|---|---|---|
| Number of families | 101 | 51 |
| Average size | 6.6 | 7.0 |
| Average generations | 2.5 | 2.5 |
|
| ||
| Relative Pairs | ||
|
| ||
| Sibling | 310 | 200 |
| Half-sibling | 13 | 9 |
| Parent-child | 764 | 424 |
| Grandparent-grandchild | 302 | 148 |
| Avuncular | 249 | 123 |
| Cousin | 75 | 25 |
|
| ||
| Subjects (with TCI data) | ||
|
| ||
| Total Subjects | 670 (427) | 356 (234) |
| Bipolar Disorder (BD) | 200 (177) | 127 (110) |
| Major Depressive Disorder (MDD) | 133 (117) | 74 (65) |
| No history of mood disorders (REL) | 148 (122) | 72 (56) |
The numbers of subjects with TEMPS-A data in total and across diagnostic categories are indicated in parentheses. The BD group includes BDI, BDII, and SA-BP, and the MDD group includes MDD-R and MDD-SE.
Genotyping
Genotyping was performed by the Center for Inherited Disease Research (CIDR) using the Illumina Infinium HumanLinkage-12 panel containing 6,090 SNP markers across the genome. A subset of the families and were genotyped as part of a larger study of 972 European ancestry families that were evaluated for linkage to BD (Badner et al., 2012). The 5,670 autosomal and X-linked SNPs that passed the initial quality control assessments by CIDR were evaluated for missingness, allele frequency, and Hardy–Weinberg equilibrium, and families were further assessed for relatedness, Mendelian errors, unlikely genotypes, and ancestry, as described in detail in elsewhere (Badner et al., 2012). Cleaned genotypes were available for 261 subjects from 51 of our 101 UCSD and NIMH families (see Table 1). The remaining 5,642 SNPs were ordered on the physical map according to Genome Build 36, and the deCODE genetic map was used to estimate genetic map distances (Kong et al., 2002). The final SNPs had an average physical spacing of 490 kb and an average genetic spacing of 0.62 cM.
Statistics
Subjects diagnosed as BDI, BDII, or SA-BP had similar scores across the personality dimensions and were combined into a BD group for analysis. Subjects diagnosed with MDD-R or MDD-SE also had similar personality scores and were combined into an MDD group. Unaffected relatives and independent controls subjects were placed into the REL and CTL groups, respectively. Group differences were evaluated using one-way ANOVA with diagnosis as the grouping factor, and the Tukey HSD for unequal n’s was utilized as a post-hoc test to compare specific groups.
Heritability (h2) estimates were computed using the variance components method implemented in SOLAR v.4.3.1 (Almasy and Blangero, 1998). Prior to analysis, all personality dimensions were transformed using the inverse normal function to correct for non-normality in the distributions. Age at interview and gender were explored as potential covariates and retained in the analysis when significant (p<0.05).
Linkage analysis was performed using the inverse normal transformed and covariate-adjusted residual scores for the five heritable dimensions. Two-point and multipoint log of the odds ratio (LOD) scores were computed using MERLIN v.1.1.2 (Abecasis et al., 2002). Although several different methodologies are available to assess linkage for quantitative traits, the pedigree-wide regression method in MERLIN was selected because it has been shown to be more robust to issues involving incomplete marker informativity and is appropriate for selected samples, allowing for the specification of population based parameters (Cordell, 2004; Schork and Greenwood, 2004a, b; Sham et al., 2002). A variance components model was instead used for analysis of the X chromosome, since the regression algorithm only supports the analysis of autosomes. Multipoint identity-by-descent matrices were generated at a 1 cM resolution, slightly larger than the average spacing between SNPs. As linkage analysis of tightly linked loci can inflate LOD scores, we required that the r2 value between markers be less than 0.1. Genome-wide suggestive and significant thresholds were estimated using gene-dropping simulations in MERLIN with 1,000 replicates. The suggestive and significant thresholds for each dimension are as follows: 2.06 and 3.60 for NS, 2.12 and 3.89 for PS, 2.79 and 5.06 for SD, 2.49 and 4.69 for CO, and 1.64 and 3.05 for ST, respectively. The suggestive threshold for all dimensions considered together is 3.34.
RESULTS
The average personality dimension scores in subjects with BD and MDD, along with their unaffected relatives (REL) and independent controls (CTL), are shown in Figure 1. Significant group differences (p<0.001) were observed for five of the dimensions as follows: NS F=17.7, HA F=33.8, SD F=54.2, CO F=9.4, and ST F=19.0. As shown in Table 2, post hoc analyses revealed significantly higher NS, HA, and ST scores and lower SD and CO scores for BD subjects compared with the MDD, REL, and CTL groups. MDD subjects revealed significantly higher HA and lower SD scores compared to the REL and CTL groups, as well as higher ST scores compared to the CTL group. HA also successfully distinguished REL and CTL subjects, and a trend was observed for ST. Significant differences were not observed between any diagnostic groups for RD or PS, consistent with our previous report (Evans et al., 2005).
Figure 1.
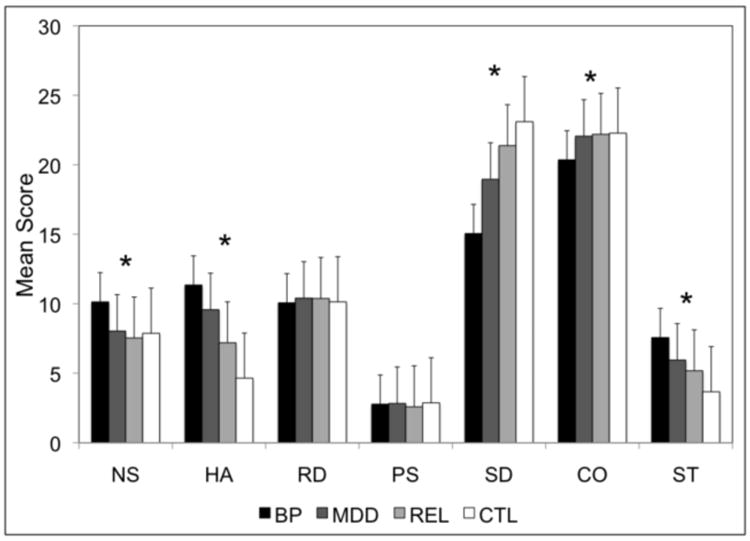
Mean scores for each personality dimension are indicated by diagnostic group. An * indicates that a significant difference was found across the four diagnostic groups for the respective dimension.
Table 2.
Post hoc analyses of group differences across the personality dimensions.
| NS | HA | RD | PS | SD | CO | ST | |
|---|---|---|---|---|---|---|---|
| BD vs. MDD | <0.001 | 0.014 | ns | ns | <0.001 | <0.001 | 0.002 |
| BD vs. REL | <0.001 | <0.001 | ns | ns | <0.001 | <0.001 | <0.001 |
| BD vs. CTL | <0.001 | <0.001 | ns | ns | <0.001 | 0.003 | <0.001 |
| MDD vs. REL | ns | 0.001 | ns | ns | 0.002 | ns | ns |
| MDD vs. CTL | ns | <0.001 | ns | ns | <0.001 | ns | 0.001 |
| REL vs. CTL | ns | 0.008 | ns | ns | ns | ns | 0.068 |
All significant and trend (p<0.10) p values are indicated with nonsignificant p values (p>0.10) indicated by “ns”.
We assessed several clinical and demographic factors in the 177 subjects with BD to evaluate the utility of the personality dimensions in predicting aspects of the course and severity of illness. Females scored significantly higher than males for HA (12.6 vs. 9.1, p<0.001), RD (10.5 vs. 9.3, p=0.004), and CO (21.2 vs. 18.9, p=0.001), consistent with previous findings (Evans et al., 2005). An earlier age at onset of BD was significantly correlated with higher scores for HA (r=-0.35, p=0.002) and lower scores for PS (r=0.24, p=0.030), SD (r=0.42, p<0.001), and CO (r=0.27, p=0.015). Higher NS scores were correlated with more suicide attempts (r=0.28, p=0.016), whereas subjects with suicidal ideation had lower PS scores (2.9 vs. 4.2, p<0.001). Subjects with co-morbid obsessive-compulsive disorder scored significantly higher on HA (16.1 vs. 10.9, p=0.001) and lower on SD (10.1 vs. 15.5, p=0.001), as did subjects with co-morbid panic disorder (13.3 vs. 10.8, p=0.011 for HA and 13.3 vs. 15.6, p=0.040 for SD). Higher NS scores were observed for subjects with co-morbid alcoholism (11.2 vs. 9.6, p=0.004), and lower CO scores were observed for subjects with co-morbid substance dependence (19.2 vs. 20.8, p=0.025). We did not observe any significant correlations with other measures of illness severity, such as the number of episodes per year, number of hospitalization per year, lifetime course, or psychosis. Data regarding current state was available for only 97 of the 177 subjects with BD. Of these, 45% met full criteria or were symptomatic at the time of interview, yet the scores of these subjects did not significantly differ from those who were in remission at the time of interview for any dimension (p>0.05). Similarly, current state data was available for 47 of the 117 subjects with MDD, and no significant differences in scores were found between the 13% who met full criteria or were symptomatic at the time of interview compared with those in remission (p>0.05). Among the BD subjects, relatively strong and significant correlations (p<0.001) were observed between SD and HA (r=-0.54), SD and CO (r=0.42), and CO and RD (r=0.43), while weaker but significant (p<0.05) correlations were observed between NS and HA (r=-0.23), NS and SD (r=-0.16), NS and CO (r=-0.21), and HA and CO (r=-0.22).
Five of the seven personality dimensions were found to be moderately but significantly heritable in this sample, as shown in Table 3, with heritability estimates ranging from 17% for ST to 35% for SD. Age was found to be a significant covariate for NS, SD, and CO, and gender was found to be a significant covariate for CO. HA and RD were not found to be heritable in this sample and were thus excluded from further genetic analyses.
Table 3.
Heritability estimates observed for the seven personality dimensions in the 101 families.
| TCI Dimension | Informative Pairs | Covariate P Values | Variance | ||||||
|---|---|---|---|---|---|---|---|---|---|
| N | Sib | P-O | Other | h2r ± SE | P value | Age | Gender | ||
| Novelty Seeking (NS) | 404 | 230 | 284 | 265 | 0.20 ± 0.09 | 0.007 | <0.0001 | ns | 0.10 |
| Harm Avoidance (HA) | 402 | 229 | 283 | 265 | 0.06 ± 0.12 | ns | <0.0001 | <0.0001 | 0.10 |
| Reward Dependence (RD) | 416 | 227 | 283 | 268 | 0.09 ± 0.09 | ns | ns | <0.0001 | 0.04 |
| Persistence (PS) | 426 | 235 | 297 | 278 | 0.24 ± 0.11 | 0.009 | ns | ns | |
|
| |||||||||
| Self-Directedness (SD) | 395 | 228 | 278 | 255 | 0.35 ± 0.12 | <0.0001 | <0.0001 | ns | 0.04 |
| Cooperativeness (CO) | 397 | 228 | 278 | 258 | 0.21 ± 0.10 | 0.010 | <0.0001 | <0.0001 | 0.14 |
| Self-Transcendence (ST) | 418 | 231 | 287 | 267 | 0.17 ± 0.09 | 0.021 | ns | ns | |
Key: Sib = sibling pairs; P-O = parent-offspring pairs; Other = half-sibling, grandparent- grandchild, avuncular, and cousin pairs; h2r=residual heritability after adjustment for significant covariates; SE=standard error; Variance = the proportion of the trait variance explained by all significant covariates. All nonsignificant p values (p>0.05) are indicated by “ns”.
As shown in Figure 2 and summarized in Table 4, genome-wide linkage analyses collectively identified several interesting linkage regions across the five heritable dimensions. A summary of all multipoint LOD scores >1.0 is provided in Table S1. Suggestive evidence of linkage was observed for NS on chromosomes 7q21 and 10p15, for PS on chromosomes 6q16, 12p13, and 19p13, and for SD on chromosomes 4q35, 8q24, and 18q12. The linkage peaks for NS on 10p15 and SD on 18q12 also pass the threshold for suggestive linkage across all dimensions with LOD scores >3.34. CO and ST produced several peaks with multipoint LOD scores >1.0, but none met genome-wide suggestive criteria. The observed peaks did not overlap, suggesting that each personality dimension may reflect the influence of different genes.
Figure 2.
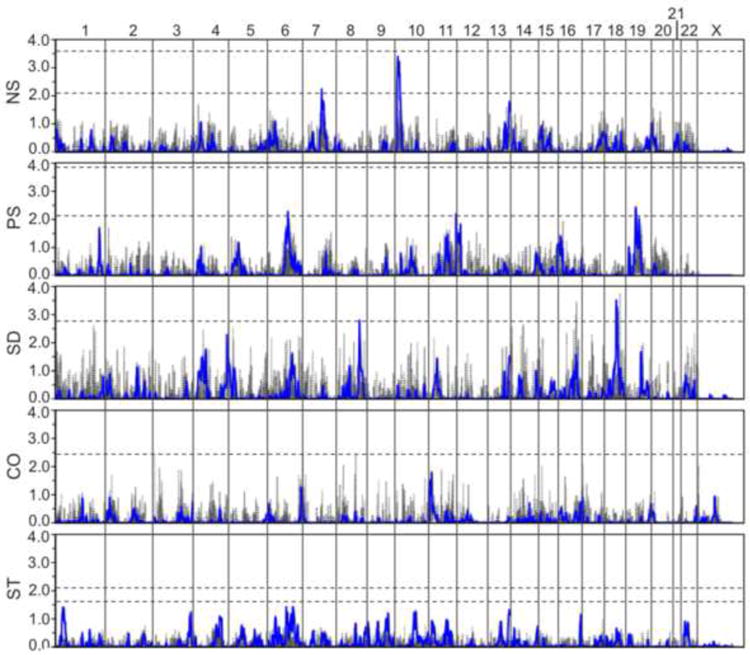
Results of the genome-wide SNP linkage scan in the 51 families for each of the five personality dimensions assessed. Multipoint results are shown in blue with two-point results shown in gray. LOD scores are indicated on the y-axis, along with the name of the corresponding dimension, and chromosomes are aligned along the x-axis end to end with the p-terminus on the left and locations indicated at the top of the figure. Dashed horizontal lines indicate significant and suggestive LOD score thresholds for each dimension based on simulations. Note that LOD score significance thresholds for SD and CO were >4.0 and are not shown.
Table 4.
Summary of all chromosomal regions with multipoint LOD scores reaching suggestive evidence for linkage.
| Dimension | Chr | Location (cM / Mb) | Peak LOD | 1-LOD Interval (cM / Mb) | Nearest Genes | Nearby Genes of Interest |
|---|---|---|---|---|---|---|
| NS | 7q21 | 104 / 92.7 | 2.25 | 101-115 / 89.6-105.2 | CCDC132 | RELN |
| 10p15 | 5 / 2.3 | 3.40 | 1-16 / 0.1-5.1 | ADARB2 | ||
|
| ||||||
| PS | 6q16 | 107 / 103.7 | 2.27 | 101-114 / 95.2-110.0 | GRIK2 | POU3F2 |
| 12p13 | 0 / 0.2 | 2.20 | 0-11 / 0.2-3.9 | CACNA1C | ||
| 19p13 | 42 / 17.6 | 2.44 | 39-46 / 16.0-19.3 | UNC13A | HOMER3, NCAN | |
|
| ||||||
| SD | 4q35 | 183 / 183.3 | 2.27 | 181-192 / 182.7-186.1 | ODZ3 | CASP3 |
| 8q24 | 122 / 122.1 | 2.70 | 120-126 / 120.2-124.1 | SNTB1 | ||
| 18q12 | 56 / 29.9 | 3.53 | 55-61 / 28.4-36.7 | NOL4 | ||
Key: 1-LOD interval = genetic and physical boundaries of LOD scores within one unit of the maximum; Nearest genes = genes immediately flanking the peak LOD score, with those of particular interest based on function or previous studies underlined; Nearby Genes of Interest = genes within the 1-LOD interval that are expressed in brain or have been implicated in previous studies of psychiatric illness.
Several genes of potential neuronal significance were identified beneath the suggestive peaks. RELN lies within the 1-LOD interval of the NS peak on 7q21. This gene, which encodes a large secreted extracellular matrix protein thought to be critical for cell positioning and neuronal migration during brain development, has been implicated in BD, MDD, schizophrenia, and autism (Folsom and Fatemi, 2013). The glutamate receptor gene GRIK2 lies directly beneath the PS peak on 6q16. Glutamate receptors are the predominant excitatory neurotransmitter receptors in the mammalian brain and are activated in a variety of normal neurophysiologic processes. POU3F2 also lies within the 1-LOD interval on 6q16 and encodes a member of the POU-III class of neural transcription factors that is involved in neuronal differentiation. Interestingly, the calcium channel gene CACNA1C lies directly under the PS peak on 12p13. This gene has shown significant associations with BD in several large samples (Ferreira et al., 2008; Psychiatric GWAS Consortium Bipolar Disorder Working Group, 2011; Sklar et al., 2008). The neurocan gene, NCAN, lies within the 1-LOD interval of the PS peak on 19q13 and has been implicated as a susceptibility gene for BD in a recent large GWAS (Cichon et al., 2011). ODZ3 lies directly beneath the SD peak on 4q35. Although not of obvious significance here, this gene is a homolog of the ODZ4 gene, which was recently implicated in a very large GWAS of BD (Psychiatric GWAS Consortium Bipolar Disorder Working Group, 2011). The CASP3 gene also lies within 1-LOD interval on 4q35 and encodes a member of the caspase family that is not only essential for normal brain development but is also associated with neuronal death in Alzheimer’s disease via its role in the cleavage of amyloid-beta 4A precursor protein (Porter and Janicke, 1999). Finally, the nucleolar protein 4 gene, NOL4, lies directly under the SD peak on 18q12 and is expressed predominantly in fetal and adult brain.
DISCUSSION
The use of diagnosis as a phenotype may not have the best power to detect causal genes in genetic studies of BD, given the high degree of clinical variability observed among BD subjects, which is a likely reflection of underlying genetic heterogeneity. Here we have explored the utility of personality dimensions as quantitative genetic traits influencing BD susceptibility.
In this study, we observed significant group differences across all personality dimensions, except RD and PS. HA, SD, and ST in particular showed the expected trend of more pathological scores for BD subjects, followed by MDD and unaffected relatives, and finally controls. NS and CO were also significantly different in BD subjects as compared to all other groups. These results are consistent with our previous study, which reported evidence of familiality for the TCI in an overlapping sample (Evans et al., 2005). The observation in this study of higher NS, HA, and ST scores and lower SD scores in BD subjects compared to controls replicates the findings of other studies (Harley et al., 2011; Loftus et al., 2008; Young et al., 1995), as does the observation of higher HA and ST and lower SD in MDD subjects compared to controls (Bayon et al., 1996; Cloninger et al., 1994; Farmer et al., 2003; Hansenne et al., 1999; Harley et al., 2011; Marijnissen et al., 2002; Svrakic et al., 1993; Young et al., 1995). However, higher NS and lower CO scores were not observed for MDD compared to controls in this study, contrary to previous findings (Bayon et al., 1996; Cloninger et al., 1994; Farmer et al., 2003; Hansenne et al., 1999; Svrakic et al., 1993).
Heritability estimates for the TCI dimensions range from approximately 30–60% in the general population (Heath et al., 1994; Heiman et al., 2003; Keller et al., 2005); yet, few studies have directly assessed their heritability in families with BD and other mood disorders. Here we have found five of the seven dimensions to be significantly, although modestly, heritable in BD families and thus suitable for genetic analyses of BD susceptibility. In another study of 241 subjects from 31 extended Caucasian South African families, heritability was estimated as 57% for HA, 40% for RD, 26% for PS, 30% for SD, and 36% for CO, and NS and ST were not found to be heritable (Savitz et al., 2008b). With the notable exceptions of PS and SD, the heritability estimates observed in this previous study show little agreement with our findings. These discrepancies are likely due not only to differences in the two samples, both in terms of size and composition, but are also likely attributable to the different methods of analysis. Despite these differences, there is consistent evidence for the heritability of several TCI personality dimensions across studies.
Previous linkage studies of an earlier temperament-based version of the TCI, the Tridimensional Personality Questionnaire (TPQ), in population-based samples have identified significant linkage peaks for HA on 8p21-23 and NS on 12p13 and 17q21 (Cloninger et al., 1998; Curtis, 2004; Zohar et al., 2003). Other than the suggestive linkage of PS to 12p13, we did not find any evidence to support linkage to these regions for any of the five dimensions assessed. However, some overlap between our results and previous linkage studies of BD, and other disorders, does exist. For example, the 6q16 region observed for PS in this sample was also observed for BD in our previous study of 34 families and in the NIMH Wave 3 sample, both of which overlap in part with the sample presented here (Dick et al., 2003; Greenwood et al., 2012). An evaluation of temperament in this same cohort, as assessed by the Temperament Evaluation of Memphis, Pisa, Paris, and San Diego Auto-questionnaire (TEMPS-A), also revealed suggestive linkage of the hyperthymic temperament to 6q16 (Akiskal et al., 2005a; Akiskal et al., 2005b; Greenwood et al., in press). Additionally, the 8q24 region identified here for SD has been repeatedly implicated in BD (Avramopoulos et al., 2004; Cichon et al., 2001; McInnis et al., 2003; McQueen et al., 2005), and the 18q21 region observed for SD, the strongest finding in our study with a LOD score of 3.53, has shown prior evidence of linkage to BD and schizophrenia (Maziade et al., 2001). Interestingly, the 10p15 region observed for NS, the second strongest finding in our study with a LOD score of 3.40, has shown evidence of linkage to early-onset obsessive-compulsive disorder, with further evidence of association to the ADARB2 gene, which lies directly beneath this linkage peak (Hanna et al., 2007).
A recent GWAS of the four TCI temperament dimensions in a sample of 5,117 Australians failed to identify any genome-wide significant genetic variants (Verweij et al., 2010), as did a subsequent meta-analysis of more that 11,000 subjects (Service et al., 2012). Other GWAS of personality using alternative questionnaires have faired similarly (Calboli et al., 2010; Shifman et al., 2008; Terracciano et al., 2010; van den Oord et al., 2008). One GWAS investigating the TCI in 944 BD subjects was somewhat more successful, finding significant associations for two SNPs on 5q21.3 and 10q23.3, although these did not survive correction for 25 subscales analyzed (Alliey-Rodriguez et al., 2011). While we did not find evidence for linkage to these regions, we also did not evaluate linkage to the TCI subscales, choosing instead to focus on the main personality dimensions, specifically those that were heritable in our sample. We did, however, observe some degree of overlap of our linkage regions with the results of several large GWAS of BD, such as CACNA1C on 12p13 and NCAN on 19q13, both of which were observed for PS (Cichon et al., 2011; Ferreira et al., 2008; Psychiatric GWAS Consortium Bipolar Disorder Working Group, 2011; Sklar et al., 2008).
There are two primary limitations to this study. First, though the TCI is designed to assess personality as a lifelong characteristic, with the dimensions demonstrating good stability over time (Heath et al., 1994), it is possible that the subjects’ self-assessments might have been influenced by their state at the time of testing. Since data regarding current state was only available for a subset of subjects with BD or MDD, adjusting the personality scores for state would effectively eliminate a majority of subjects with mood disorders. However, a comparison of scores for those subjects that meet full criteria or were symptomatic at the time of interview with those who were in remission at the time of interview found no significant differences for any personality dimension. Second, our sample of 51 families is small and lacks sufficient power to reliably detect loci with smaller effects in a linkage analysis. This may explain why no suggestive peaks for CO or ST were observed in this study.
The results of our analyses suggest that personality dimensions may have utility in dissecting the genetic architecture of BD. This may particularly be the case for SD, which was the most heritable personality dimension in our study, gave the strongest linkage signal, and showed the expected trend of significantly more pathological scores for BD subjects, followed by their relatives, with the least pathological scores observed for controls. While the absence of significant linkage signals for all personality dimensions may be an issue of power deficiencies in our sample, it is also likely a reflection of the genetic complexity of personality. Still, we have identified multiple regions meeting genome-wide suggestive criteria that provide support for several interesting genes and chromosomal regions. The extent to which these regions harbor specific mutations that are involved in BD susceptibility remains a topic for future discussion.
Supplementary Material
Acknowledgments
The authors wish to thank all of the participants and support staff who made this study possible.
Footnotes
CONTRIBUTORS
Dr. Greenwood is responsible for the conception and design of the study, data analysis and interpretation, and drafting and critically revising the article. Drs. Badner and Byerley provided cleaned genotype data for the sample, and Dr. Badner provided statistical support. Drs. Keck, McElroy, Remick, and Sadovnick participated in subject recruitment. Dr. Kelsoe participated in the conception and design of the study, subject recruitment, data interpretation, and critical revision of the article. All authors approved the final manuscript.
CONFLICT OF INTEREST
Drs. Badner, Byerley, Greenwood, Kelsoe, Remick, and Sadovnick have no competing financial interests to report. Dr. McElroy is a consultant to or member of the scientific advisory board of Alkermes, Eli Lilly, Shire, and Teva and has received unrelated research support from the Agency for Healthcare Research & Quality (AHRQ), Alkermes, AstraZeneca, Bristol-Myers Squibb, Cephalon, Eli Lilly, Forest Labs, GalaxoSmith Kline, Jazz Pharmaceuticals, Marriott Foundation, Orexigen Therapeutics, Shire, and Takeda Pharmaceutical Company. Dr. McElroy is also an inventor on United States Patent No. 6,323,236 B2 for the use of sulfamate derivatives for treating impulse control disorders and has received payments from Johnson & Johnson Pharmaceutical Research and Development, which has exclusive rights under the patent. Dr. Keck is a co-inventor on a United States Patent (No. 6,387,956) for treating obsessive-compulsive spectrum disorder through tramadol and has received no financial gain.
Publisher's Disclaimer: This is a PDF file of an unedited manuscript that has been accepted for publication. As a service to our customers we are providing this early version of the manuscript. The manuscript will undergo copyediting, typesetting, and review of the resulting proof before it is published in its final citable form. Please note that during the production process errors may be discovered which could affect the content, and all legal disclaimers that apply to the journal pertain.
References
- Abecasis GR, Cherny SS, Cookson WO, Cardon LR. Merlin--rapid analysis of dense genetic maps using sparse gene flow trees. Nat Genet. 2002;30:97–101. doi: 10.1038/ng786. [DOI] [PubMed] [Google Scholar]
- Akiskal HS. The bipolar spectrum: new concepts in classification and diagnosis. In: Grinspoon L, editor. Psychiatry Update: The American Psychiatric Association Annual Review. American Psychiatric Press; Washington, DC: 1983. pp. 271–292. [Google Scholar]
- Akiskal HS, Akiskal KK, Haykal RF, Manning JS, Connor PD. TEMPS-A: progress towards validation of a self-rated clinical version of the Temperament Evaluation of the Memphis, Pisa, Paris, and San Diego Autoquestionnaire. J Affect Disord. 2005a;85:3–16. doi: 10.1016/j.jad.2004.12.001. [DOI] [PubMed] [Google Scholar]
- Akiskal HS, Mendlowicz MV, Jean-Louis G, Rapaport MH, Kelsoe JR, Gillin JC, Smith TL. TEMPS-A: validation of a short version of a self-rated instrument designed to measure variations in temperament. J Affect Disord. 2005b;85:45–52. doi: 10.1016/j.jad.2003.10.012. [DOI] [PubMed] [Google Scholar]
- Akiskal HS, Pinto O. Soft bipolar spectrum: footnotes to Kraepelin on the interface of hypomania, temperament and depression. In: Marneros A, Angst J, editors. Bipolar Disorders: 100 Years after Manic-depressive Insanity. Kluwer Academic; Dordrecht: 2000. pp. 37–62. [Google Scholar]
- Alliey-Rodriguez N, Zhang D, Badner JA, Lahey BB, Zhang X, Dinwiddie S, Romanos B, Plenys N, Liu C, Gershon ES. Genome-wide association study of personality traits in bipolar patients. Psychiatr Genet. 2011;21:190–194. doi: 10.1097/YPG.0b013e3283457a31. [DOI] [PMC free article] [PubMed] [Google Scholar]
- Almasy L, Blangero J. Multipoint quantitative-trait linkage analysis in general pedigrees. Am J Hum Genet. 1998;62:1198–1211. doi: 10.1086/301844. [DOI] [PMC free article] [PubMed] [Google Scholar]
- Avramopoulos D, Willour VL, Zandi PP, Huo Y, MacKinnon DF, Potash JB, DePaulo JR, Jr, McInnis MG. Linkage of bipolar affective disorder on chromosome 8q24: follow-up and parametric analysis. Mol Psychiatry. 2004;9:191–196. doi: 10.1038/sj.mp.4001388. [DOI] [PubMed] [Google Scholar]
- Badner JA, Koller D, Foroud T, Edenberg H, Nurnberger JI, Jr, Zandi PP, Willour VL, McMahon FJ, Potash JB, Hamshere M, Grozeva D, Green E, Kirov G, Jones I, Jones L, Craddock N, Morris D, Segurado R, Gill M, Sadovnick D, Remick R, Keck P, Kelsoe J, Ayub M, Maclean A, Blackwood D, Liu CY, Gershon ES, McMahon W, Lyon GJ, Robinson R, Ross J, Byerley W. Genome-wide linkage analysis of 972 bipolar pedigrees using single-nucleotide polymorphisms. Mol Psychiatry. 2012;17:818–826. doi: 10.1038/mp.2011.89. [DOI] [PMC free article] [PubMed] [Google Scholar]
- Baum AE, Akula N, Cabanero M, Cardona I, Corona W, Klemens B, Schulze TG, Cichon S, Rietschel M, Nothen MM, Georgi A, Schumacher J, Schwarz M, Abou Jamra R, Hofels S, Propping P, Satagopan J, Detera-Wadleigh SD, Hardy J, McMahon FJ. A genome-wide association study implicates diacylglycerol kinase eta (DGKH) and several other genes in the etiology of bipolar disorder. Mol Psychiatry. 2008;13:197–207. doi: 10.1038/sj.mp.4002012. [DOI] [PMC free article] [PubMed] [Google Scholar]
- Bayon C, Hill K, Svrakic DM, Przybeck TR, Cloninger CR. Dimensional assessment of personality in an out-patient sample: relations of the systems of Millon and Cloninger. J Psychiatr Res. 1996;30:341–352. doi: 10.1016/0022-3956(96)00024-6. [DOI] [PubMed] [Google Scholar]
- Calboli FC, Tozzi F, Galwey NW, Antoniades A, Mooser V, Preisig M, Vollenweider P, Waterworth D, Waeber G, Johnson MR, Muglia P, Balding DJ. A genome-wide association study of neuroticism in a population-based sample. PLoS One. 2010;5:e11504. doi: 10.1371/journal.pone.0011504. [DOI] [PMC free article] [PubMed] [Google Scholar]
- Cichon S, Muhleisen TW, Degenhardt FA, Mattheisen M, Miro X, Strohmaier J, Steffens M, Meesters C, Herms S, Weingarten M, Priebe L, Haenisch B, Alexander M, Vollmer J, Breuer R, Schmal C, Tessmann P, Moebus S, Wichmann HE, Schreiber S, Muller-Myhsok B, Lucae S, Jamain S, Leboyer M, Bellivier F, Etain B, Henry C, Kahn JP, Heath S, Hamshere M, O’Donovan MC, Owen MJ, Craddock N, Schwarz M, Vedder H, Kammerer-Ciernioch J, Reif A, Sasse J, Bauer M, Hautzinger M, Wright A, Mitchell PB, Schofield PR, Montgomery GW, Medland SE, Gordon SD, Martin NG, Gustafsson O, Andreassen O, Djurovic S, Sigurdsson E, Steinberg S, Stefansson H, Stefansson K, Kapur-Pojskic L, Oruc L, Rivas F, Mayoral F, Chuchalin A, Babadjanova G, Tiganov AS, Pantelejeva G, Abramova LI, Grigoroiu-Serbanescu M, Diaconu CC, Czerski PM, Hauser J, Zimmer A, Lathrop M, Schulze TG, Wienker TF, Schumacher J, Maier W, Propping P, Rietschel M, Nothen MM. Genome-wide association study identifies genetic variation in neurocan as a susceptibility factor for bipolar disorder. Am J Hum Genet. 2011;88:372–381. doi: 10.1016/j.ajhg.2011.01.017. [DOI] [PMC free article] [PubMed] [Google Scholar]
- Cichon S, Schumacher J, Muller DJ, Hurter M, Windemuth C, Strauch K, Hemmer S, Schulze TG, Schmidt-Wolf G, Albus M, Borrmann-Hassenbach M, Franzek E, Lanczik M, Fritze J, Kreiner R, Reuner U, Weigelt B, Minges J, Lichtermann D, Lerer B, Kanyas K, Baur MP, Wienker TF, Maier W, Rietschel M, Propping P, Nothen MM. A genome screen for genes predisposing to bipolar affective disorder detects a new susceptibility locus on 8q. Hum Mol Genet. 2001;10:2933–2944. doi: 10.1093/hmg/10.25.2933. [DOI] [PubMed] [Google Scholar]
- Cloninger CR, Przybeck TR, Svrakic DM, Wetzel RD. The Temperament and Character Inventory (TCI): A Guide to Its Development and Use. Center for Psychobiology of Personality; St. Louis, MO: 1994. [Google Scholar]
- Cloninger CR, Svrakic DM, Przybeck TR. A psychobiological model of temperament and character. Arch Gen Psychiatry. 1993;50:975–990. doi: 10.1001/archpsyc.1993.01820240059008. [DOI] [PubMed] [Google Scholar]
- Cloninger CR, Van Eerdewegh P, Goate A, Edenberg HJ, Blangero J, Hesselbrock V, Reich T, Nurnberger J, Jr, Schuckit M, Porjesz B, Crowe R, Rice JP, Foroud T, Przybeck TR, Almasy L, Bucholz K, Wu W, Shears S, Carr K, Crose C, Willig C, Zhao J, Tischfield JA, Li TK, Conneally PM, et al. Anxiety proneness linked to epistatic loci in genome scan of human personality traits. Am J Med Genet. 1998;81:313–317. doi: 10.1002/(sici)1096-8628(19980710)81:4<313::aid-ajmg7>3.0.co;2-u. [DOI] [PubMed] [Google Scholar]
- Cordell HJ. Bias toward the null hypothesis in model-free linkage analysis is highly dependent on the test statistic used. Am J Hum Genet. 2004;74:1294–1302. doi: 10.1086/421476. [DOI] [PMC free article] [PubMed] [Google Scholar]
- Craddock N, Jones I. Genetics of bipolar disorder. J Med Genet. 1999;36:585–594. doi: 10.1136/jmg.36.8.585. [DOI] [PMC free article] [PubMed] [Google Scholar]
- Curtis D. Re-analysis of collaborative study on the genetics of alcoholism pedigrees suggests the presence of loci influencing novelty-seeking near D12S391 and D17S1299. Psychiatr Genet. 2004;14:151–155. doi: 10.1097/00041444-200409000-00006. [DOI] [PubMed] [Google Scholar]
- Dick DM, Foroud T, Flury L, Bowman ES, Miller MJ, Rau NL, Moe PR, Samavedy N, El-Mallakh R, Manji H, Glitz DA, Meyer ET, Smiley C, Hahn R, Widmark C, McKinney R, Sutton L, Ballas C, Grice D, Berrettini W, Byerley W, Coryell W, DePaulo R, MacKinnon DF, Gershon ES, Kelsoe JR, McMahon FJ, McInnis M, Murphy DL, Reich T, Scheftner W, Nurnberger JI., Jr Genomewide linkage analyses of bipolar disorder: a new sample of 250 pedigrees from the national institute of mental health genetics initiative. Am J Hum Genet. 2003;73:107–114. doi: 10.1086/376562. [DOI] [PMC free article] [PubMed] [Google Scholar]
- Evans L, Akiskal HS, Keck PE, Jr, McElroy SL, Sadovnick AD, Remick RA, Kelsoe JR. Familiality of temperament in bipolar disorder: support for a genetic spectrum. J Affect Disord. 2005;85:153–168. doi: 10.1016/j.jad.2003.10.015. [DOI] [PubMed] [Google Scholar]
- Farmer A, Mahmood A, Redman K, Harris T, Sadler S, McGuffin P. A sib-pair study of the Temperament and Character Inventory scales in major depression. Arch Gen Psychiatry. 2003;60:490–496. doi: 10.1001/archpsyc.60.5.490. [DOI] [PubMed] [Google Scholar]
- Ferreira MA, O’Donovan MC, Meng YA, Jones IR, Ruderfer DM, Jones L, Fan J, Kirov G, Perlis RH, Green EK, Smoller JW, Grozeva D, Stone J, Nikolov I, Chambert K, Hamshere ML, Nimgaonkar VL, Moskvina V, Thase ME, Caesar S, Sachs GS, Franklin J, Gordon-Smith K, Ardlie KG, Gabriel SB, Fraser C, Blumenstiel B, Defelice M, Breen G, Gill M, Morris DW, Elkin A, Muir WJ, McGhee KA, Williamson R, MacIntyre DJ, MacLean AW, St CD, Robinson M, Van Beck M, Pereira AC, Kandaswamy R, McQuillin A, Collier DA, Bass NJ, Young AH, Lawrence J, Ferrier IN, Anjorin A, Farmer A, Curtis D, Scolnick EM, McGuffin P, Daly MJ, Corvin AP, Holmans PA, Blackwood DH, Gurling HM, Owen MJ, Purcell SM, Sklar P, Craddock N. Collaborative genome-wide association analysis supports a role for ANK3 and CACNA1C in bipolar disorder. Nat Genet. 2008;40:1056–1058. doi: 10.1038/ng.209. [DOI] [PMC free article] [PubMed] [Google Scholar]
- Folsom TD, Fatemi SH. The involvement of Reelin in neurodevelopmental disorders. Neuropharmacology. 2013;68:122–135. doi: 10.1016/j.neuropharm.2012.08.015. [DOI] [PMC free article] [PubMed] [Google Scholar]
- Gershon ES, Hamovit J, Guroff JJ, Dibble E, Leckman JF, Sceery W, Targum SD, Nurnberger JI, Jr, Goldin LR, Bunney WE., Jr A family study of schizoaffective, bipolar I, bipolar II, unipolar, and normal control probands. Arch Gen Psychiatry. 1982;39:1157–1167. doi: 10.1001/archpsyc.1982.04290100031006. [DOI] [PubMed] [Google Scholar]
- Goodwin FK, Jameson KR. Manic-Depressive Illness. Oxford University Press; New York: 1990. [Google Scholar]
- Gottesman II, Gould TD. The endophenotype concept in psychiatry: etymology and strategic intentions. Am J Psychiatry. 2003;160:636–645. doi: 10.1176/appi.ajp.160.4.636. [DOI] [PubMed] [Google Scholar]
- Greenwood TA, Badner JA, Byerley W, Keck PE, Jr, McElroy SL, Remick RA, Sadovnick AD, Akiskal HS, Kelsoe JR. Heritability and genome-wide SNP linkage analysis of temperament in bipolar disorder. J Affect Disord. doi: 10.1016/j.jad.2013.05.035. in press. [DOI] [PMC free article] [PubMed] [Google Scholar]
- Greenwood TA, Nievergelt CM, Sadovnick AD, Remick RA, Keck PE, Jr, McElroy SL, Shekhtman T, McKinney R, Kelsoe JR. Further evidence for linkage of bipolar disorder to chromosomes 6 and 17 in a new independent pedigree series. Bipolar Disord. 2012;14:71–79. doi: 10.1111/j.1399-5618.2011.00970.x. [DOI] [PMC free article] [PubMed] [Google Scholar]
- Hanna GL, Veenstra-Vanderweele J, Cox NJ, Van Etten M, Fischer DJ, Himle JA, Bivens NC, Wu X, Roe CA, Hennessy KA, Dickel DE, Leventhal BL, Cook EH., Jr Evidence for a susceptibility locus on chromosome 10p15 in early-onset obsessive-compulsive disorder. Biol Psychiatry. 2007;62:856–862. doi: 10.1016/j.biopsych.2007.01.008. [DOI] [PMC free article] [PubMed] [Google Scholar]
- Hansenne M, Reggers J, Pinto E, Kjiri K, Ajamier A, Ansseau M. Temperament and character inventory (TCI) and depression. J Psychiatr Res. 1999;33:31–36. doi: 10.1016/s0022-3956(98)00036-3. [DOI] [PubMed] [Google Scholar]
- Harley JA, Wells JE, Frampton CM, Joyce PR. Bipolar Disorder and the TCI: Higher Self-Transcendence in Bipolar Disorder Compared to Major Depression. Depress Res Treat. 2011;2011 doi: 10.1155/2011/529638. 529638. [DOI] [PMC free article] [PubMed] [Google Scholar]
- Heath AC, Cloninger CR, Martin NG. Testing a model for the genetic structure of personality: a comparison of the personality systems of Cloninger and Eysenck. J Pers Soc Psychol. 1994;66:762–775. doi: 10.1037//0022-3514.66.4.762. [DOI] [PubMed] [Google Scholar]
- Heiman N, Stallings MC, Hofer SM, Hewitt JK. Investigating age differences in the genetic and environmental structure of the tridimensional personality questionnaire in later adulthood. Behav Genet. 2003;33:171–180. doi: 10.1023/a:1022558002760. [DOI] [PubMed] [Google Scholar]
- Keller MC, Coventry WL, Heath AC, Martin NG. Widespread evidence for non-additive genetic variation in Cloninger’s and Eysenck’s personality dimensions using a twin plus sibling design. Behav Genet. 2005;35:707–721. doi: 10.1007/s10519-005-6041-7. [DOI] [PubMed] [Google Scholar]
- Kelsoe JR. Arguments for the genetic basis of the bipolar spectrum. J Affect Disord. 2003;73:183–197. doi: 10.1016/s0165-0327(02)00323-3. [DOI] [PubMed] [Google Scholar]
- Kelsoe JR, Spence MA, Loetscher E, Foguet M, Sadovnick AD, Remick RA, Flodman P, Khristich J, Mroczkowski-Parker Z, Brown JL, Masser D, Ungerleider S, Rapaport MH, Wishart WL, Luebbert H. A genome survey indicates a possible susceptibility locus for bipolar disorder on chromosome 22. Proc Natl Acad Sci U S A. 2001;98:585–590. doi: 10.1073/pnas.011358498. [DOI] [PMC free article] [PubMed] [Google Scholar]
- Kong A, Gudbjartsson DF, Sainz J, Jonsdottir GM, Gudjonsson SA, Richardsson B, Sigurdardottir S, Barnard J, Hallbeck B, Masson G, Shlien A, Palsson ST, Frigge ML, Thorgeirsson TE, Gulcher JR, Stefansson K. A high-resolution recombination map of the human genome. Nat Genet. 2002;31:241–247. doi: 10.1038/ng917. [DOI] [PubMed] [Google Scholar]
- Lara DR, Akiskal HS. Toward an integrative model of the spectrum of mood, behavioral and personality disorders based on fear and anger traits: II. Implications for neurobiology, genetics and psychopharmacological treatment. J Affect Disord. 2006;94:89–103. doi: 10.1016/j.jad.2006.03.021. [DOI] [PubMed] [Google Scholar]
- Lara DR, Pinto O, Akiskal K, Akiskal HS. Toward an integrative model of the spectrum of mood, behavioral and personality disorders based on fear and anger traits: I. Clinical implications. J Affect Disord. 2006;94:67–87. doi: 10.1016/j.jad.2006.02.025. [DOI] [PubMed] [Google Scholar]
- Loftus ST, Garno JL, Jaeger J, Malhotra AK. Temperament and character dimensions in bipolar I disorder: a comparison to healthy controls. J Psychiatr Res. 2008;42:1131–1136. doi: 10.1016/j.jpsychires.2007.11.005. [DOI] [PubMed] [Google Scholar]
- Marijnissen G, Tuinier S, Sijben AE, Verhoeven WM. The temperament and character inventory in major depression. J Affect Disord. 2002;70:219–223. doi: 10.1016/s0165-0327(01)00364-0. [DOI] [PubMed] [Google Scholar]
- Maziade M, Roy MA, Rouillard E, Bissonnette L, Fournier JP, Roy A, Garneau Y, Montgrain N, Potvin A, Cliche D, Dion C, Wallot H, Fournier A, Nicole L, Lavallee JC, Merette C. A search for specific and common susceptibility loci for schizophrenia and bipolar disorder: a linkage study in 13 target chromosomes. Mol Psychiatry. 2001;6:684–693. doi: 10.1038/sj.mp.4000915. [DOI] [PubMed] [Google Scholar]
- McInnis MG, Lan TH, Willour VL, McMahon FJ, Simpson SG, Addington AM, MacKinnon DF, Potash JB, Mahoney AT, Chellis J, Huo Y, Swift-Scanlan T, Chen H, Koskela R, Colin Stine O, Jamison KR, Holmans P, Folstein SE, Ranade K, Friddle C, Botstein D, Marr T, Beaty TH, Zandi P, Raymond DePaulo J. Genome-wide scan of bipolar disorder in 65 pedigrees: supportive evidence for linkage at 8q24, 18q22, 4q32, 2p12, and 13q12. Mol Psychiatry. 2003;8:288–298. doi: 10.1038/sj.mp.4001277. [DOI] [PubMed] [Google Scholar]
- McQueen MB, Devlin B, Faraone SV, Nimgaonkar VL, Sklar P, Smoller JW, Abou Jamra R, Albus M, Bacanu SA, Baron M, Barrett TB, Berrettini W, Blacker D, Byerley W, Cichon S, Coryell W, Craddock N, Daly MJ, Depaulo JR, Edenberg HJ, Foroud T, Gill M, Gilliam TC, Hamshere M, Jones I, Jones L, Juo SH, Kelsoe JR, Lambert D, Lange C, Lerer B, Liu J, Maier W, Mackinnon JD, McInnis MG, McMahon FJ, Murphy DL, Nothen MM, Nurnberger JI, Pato CN, Pato MT, Potash JB, Propping P, Pulver AE, Rice JP, Rietschel M, Scheftner W, Schumacher J, Segurado R, Van Steen K, Xie W, Zandi PP, Laird NM. Combined analysis from eleven linkage studies of bipolar disorder provides strong evidence of susceptibility loci on chromosomes 6q and 8q. Am J Hum Genet. 2005;77:582–595. doi: 10.1086/491603. [DOI] [PMC free article] [PubMed] [Google Scholar]
- Nurnberger JI, Jr, Blehar MC, Kaufmann CA, York-Cooler C, Simpson SG, Harkavy-Friedman J, Severe JB, Malaspina D, Reich T. Diagnostic interview for genetic studies. Rationale, unique features, and training NIMH Genetics Initiative. Arch Gen Psychiatry. 1994;51:849–859. doi: 10.1001/archpsyc.1994.03950110009002. discussion 863-844. [DOI] [PubMed] [Google Scholar]
- Porter AG, Janicke RU. Emerging roles of caspase-3 in apoptosis. Cell Death Differ. 1999;6:99–104. doi: 10.1038/sj.cdd.4400476. [DOI] [PubMed] [Google Scholar]
- Price RA, Kidd KK, Pauls DL, Gershon ES, Prusoff BA, Weissman MM, Goldin LR. Multiple threshold models for the affective disorders: the Yale-NIMH collaborative family study. J Psychiatr Res. 1985;19:533–546. doi: 10.1016/0022-3956(85)90071-8. [DOI] [PubMed] [Google Scholar]
- Psychiatric GWAS Consortium Bipolar Disorder Working Group. Large-scale genome-wide association analysis of bipolar disorder identifies a new susceptibility locus near ODZ4. Nat Genet. 2011;43:977–983. doi: 10.1038/ng.943. [DOI] [PMC free article] [PubMed] [Google Scholar]
- Savitz J, van der Merwe L, Ramesar R. Dysthymic and anxiety-related personality traits in bipolar spectrum illness. J Affect Disord. 2008a;109:305–311. doi: 10.1016/j.jad.2007.12.006. [DOI] [PubMed] [Google Scholar]
- Savitz J, van der Merwe L, Ramesar R. Personality endophenotypes for bipolar affective disorder: a family-based genetic association analysis. Genes Brain Behav. 2008b;7:869–876. doi: 10.1111/j.1601-183X.2008.00426.x. [DOI] [PubMed] [Google Scholar]
- Schork NJ, Greenwood TA. Got bias? The authors reply. Am J Hum Genet. 2004a;75:723–727. [Google Scholar]
- Schork NJ, Greenwood TA. Inherent bias toward the null hypothesis in conventional multipoint nonparametric linkage analysis. Am J Hum Genet. 2004b;74:306–316. doi: 10.1086/381714. [DOI] [PMC free article] [PubMed] [Google Scholar]
- Scott LJ, Muglia P, Kong XQ, Guan W, Flickinger M, Upmanyu R, Tozzi F, Li JZ, Burmeister M, Absher D, Thompson RC, Francks C, Meng F, Antoniades A, Southwick AM, Schatzberg AF, Bunney WE, Barchas JD, Jones EG, Day R, Matthews K, McGuffin P, Strauss JS, Kennedy JL, Middleton L, Roses AD, Watson SJ, Vincent JB, Myers RM, Farmer AE, Akil H, Burns DK, Boehnke M. Genome-wide association and meta-analysis of bipolar disorder in individuals of European ancestry. Proc Natl Acad Sci U S A. 2009;106:7501–7506. doi: 10.1073/pnas.0813386106. [DOI] [PMC free article] [PubMed] [Google Scholar]
- Serretti A, Mandelli L. The genetics of bipolar disorder: genome ‘hot regions,’ genes, new potential candidates and future directions. Mol Psychiatry. 2008;13:742–771. doi: 10.1038/mp.2008.29. [DOI] [PubMed] [Google Scholar]
- Service SK, Verweij KJ, Lahti J, Congdon E, Ekelund J, Hintsanen M, Raikkonen K, Lehtimaki T, Kahonen M, Widen E, Taanila A, Veijola J, Heath AC, Madden PA, Montgomery GW, Sabatti C, Jarvelin MR, Palotie A, Raitakari O, Viikari J, Martin NG, Eriksson JG, Keltikangas-Jarvinen L, Wray NR, Freimer NB. A genome-wide meta-analysis of association studies of Cloninger’s Temperament Scales. Transl Psychiatry. 2012;2:e116. doi: 10.1038/tp.2012.37. [DOI] [PMC free article] [PubMed] [Google Scholar]
- Sham PC, Purcell S, Cherny SS, Abecasis GR. Powerful regression-based quantitative-trait linkage analysis of general pedigrees. Am J Hum Genet. 2002;71:238–253. doi: 10.1086/341560. [DOI] [PMC free article] [PubMed] [Google Scholar]
- Shifman S, Bhomra A, Smiley S, Wray NR, James MR, Martin NG, Hettema JM, An SS, Neale MC, van den Oord EJ, Kendler KS, Chen X, Boomsma DI, Middeldorp CM, Hottenga JJ, Slagboom PE, Flint J. A whole genome association study of neuroticism using DNA pooling. Mol Psychiatry. 2008;13:302–312. doi: 10.1038/sj.mp.4002048. [DOI] [PMC free article] [PubMed] [Google Scholar]
- Sklar P, Smoller JW, Fan J, Ferreira MA, Perlis RH, Chambert K, Nimgaonkar VL, McQueen MB, Faraone SV, Kirby A, de Bakker PI, Ogdie MN, Thase ME, Sachs GS, Todd-Brown K, Gabriel SB, Sougnez C, Gates C, Blumenstiel B, Defelice M, Ardlie KG, Franklin J, Muir WJ, McGhee KA, MacIntyre DJ, McLean A, VanBeck M, McQuillin A, Bass NJ, Robinson M, Lawrence J, Anjorin A, Curtis D, Scolnick EM, Daly MJ, Blackwood DH, Gurling HM, Purcell SM. Whole-genome association study of bipolar disorder. Mol Psychiatry. 2008;13:558–569. doi: 10.1038/sj.mp.4002151. [DOI] [PMC free article] [PubMed] [Google Scholar]
- Smith EN, Bloss CS, Badner JA, Barrett T, Belmonte PL, Berrettini W, Byerley W, Coryell W, Craig D, Edenberg HJ, Eskin E, Foroud T, Gershon E, Greenwood TA, Hipolito M, Koller DL, Lawson WB, Liu C, Lohoff F, McInnis MG, McMahon FJ, Mirel DB, Murray SS, Nievergelt C, Nurnberger J, Nwulia EA, Paschall J, Potash JB, Rice J, Schulze TG, Scheftner W, Panganiban C, Zaitlen N, Zandi PP, Zollner S, Schork NJ, Kelsoe JR. Genome-wide association study of bipolar disorder in European American and African American individuals. Mol Psychiatry. 2009;14:755–763. doi: 10.1038/mp.2009.43. [DOI] [PMC free article] [PubMed] [Google Scholar]
- Spitzer RL, Williams JB, Gibbon M, First MB. The Structured Clinical Interview for DSM-III-R (SCID). I: History, rationale, and description. Arch Gen Psychiatry. 1992;49:624–629. doi: 10.1001/archpsyc.1992.01820080032005. [DOI] [PubMed] [Google Scholar]
- Svrakic DM, Whitehead C, Przybeck TR, Cloninger CR. Differential diagnosis of personality disorders by the seven-factor model of temperament and character. Arch Gen Psychiatry. 1993;50:991–999. doi: 10.1001/archpsyc.1993.01820240075009. [DOI] [PubMed] [Google Scholar]
- Taylor L, Faraone SV, Tsuang MT. Family, twin, and adoption studies of bipolar disease. Curr Psychiatry Rep. 2002;4:130–133. doi: 10.1007/s11920-002-0046-1. [DOI] [PubMed] [Google Scholar]
- Terracciano A, Sanna S, Uda M, Deiana B, Usala G, Busonero F, Maschio A, Scally M, Patriciu N, Chen WM, Distel MA, Slagboom EP, Boomsma DI, Villafuerte S, Sliwerska E, Burmeister M, Amin N, Janssens AC, van Duijn CM, Schlessinger D, Abecasis GR, Costa PT., Jr Genome-wide association scan for five major dimensions of personality. Mol Psychiatry. 2010;15:647–656. doi: 10.1038/mp.2008.113. [DOI] [PMC free article] [PubMed] [Google Scholar]
- van den Oord EJ, Kuo PH, Hartmann AM, Webb BT, Moller HJ, Hettema JM, Giegling I, Bukszar J, Rujescu D. Genomewide association analysis followed by a replication study implicates a novel candidate gene for neuroticism. Arch Gen Psychiatry. 2008;65:1062–1071. doi: 10.1001/archpsyc.65.9.1062. [DOI] [PubMed] [Google Scholar]
- Verweij KJ, Zietsch BP, Medland SE, Gordon SD, Benyamin B, Nyholt DR, McEvoy BP, Sullivan PF, Heath AC, Madden PA, Henders AK, Montgomery GW, Martin NG, Wray NR. A genome-wide association study of Cloninger’s temperament scales: implications for the evolutionary genetics of personality. Biol Psychol. 2010;85:306–317. doi: 10.1016/j.biopsycho.2010.07.018. [DOI] [PMC free article] [PubMed] [Google Scholar]
- Wellcome Trust Case Control Consortium. Genome-wide association study of 14,000 cases of seven common diseases and 3,000 shared controls. Nature. 2007;447:661–678. doi: 10.1038/nature05911. [DOI] [PMC free article] [PubMed] [Google Scholar]
- Young LT, Bagby RM, Cooke RG, Parker JD, Levitt AJ, Joffe RT. A comparison of Tridimensional Personality Questionnaire dimensions in bipolar disorder and unipolar depression. Psychiatry Res. 1995;58:139–143. doi: 10.1016/0165-1781(95)02684-o. [DOI] [PubMed] [Google Scholar]
- Zohar AH, Dina C, Rosolio N, Osher Y, Gritsenko I, Bachner-Melman R, Benjamin J, Belmaker RH, Ebstein RP. Tridimensional personality questionnaire trait of harm avoidance (anxiety proneness) is linked to a locus on chromosome 8p21. Am J Med Genet B Neuropsychiatr Genet. 2003;117B:66–69. doi: 10.1002/ajmg.b.10029. [DOI] [PubMed] [Google Scholar]
Associated Data
This section collects any data citations, data availability statements, or supplementary materials included in this article.