Abstract
Objective
To accurately measure the end-expiratory pulmonary artery wedge pressure (PAWP) with the “expiration holding” function on the ventilator and the “pulmonary artery wedge pressure review” software on the monitor.
Materials and methods
Fifty prospective measurements were made on 12 patients undergoing pulmonary artery catheter and mechanical ventilation. All measurements were divided into <8 mmHg or ≥8 mmHg subgroups according to respiratory variability, and they were then subdivided into either an airway pressure display measurement group (AM group) or an expiration holding (EH) group for comparison.
Results
In all measurements, the two groups showed similar levels of accuracy; however, for the time spent for measurement, the EH group was much faster than the airway pressure display measurement group (P<0.001). Additionally, the EH group was associated with lower medical costs.
Conclusion
The expiration holding approach measured the PAWP more accurately, more quickly, and with reduced costs in comparison to the airway pressure display approach.
Keywords: expiration holding, pulmonary artery wedge pressure, eePAWP, mechanical ventilation, pulmonary artery catheter
Introduction
Pulmonary artery wedge pressure (PAWP) reading is important in intensive care. At the end of expiration, the PAWP accurately reflects central vessel pressures.1 The measurement of end-expiratory PAWP (eePAWP) has, therefore, attracted much attention, and various approaches have been developed.2,3 The Fluids and Catheters Treatment Trial4 (FACTT) in 2005 showed that the airway pressure display approach led to good results for eePAWP measurement; however, the procedure was complicated, leading to low compliance for the user.
The “expiration holding” approach that we recently developed combines the “expiration holding” function on the ventilator and the “PAWP review” software on the monitor for eePAWP measurements, showing high accuracy.5 With the expiration holding function, the ventilator maintains a breathing-out state for 15 seconds in order to measure the maximum inspiratory negative pressure of the patient, as well as to guide the withdrawal of the ventilator. With this function, positive ventilation was maintained at the breathing-out phase and, therefore, the effect of positive pressure ventilation on blood pressure was eliminated. In the case of spontaneous breathing, the program function was started at the end of spontaneous breathing, and the effect of spontaneous breathing on blood pressure was eliminated as well. This would lead to a steady blood pressure waveform when positive pressure ventilation and spontaneous breathing both occurred at the end of expiration. The “PAWP review” software is available in most monitors to measure selected waveforms accurately. In the present study, we demonstrated that combing the “expiration holding” function of a ventilator and the PAWP review software could lead to the accurate, convenient, and user-friendly measurement of eePAWP.
Materials and methods
Preparation
The experimental group was established as described in the FACTT trial.4 The detailed PAWP measurement procedure was established, and systemic training of all of the staff members was performed. One person was in charge of the waveform strips for PAWP-steady graphics and blood vessel/airway pressure waveforms. For each measurement, the waveform was first read by one experienced doctor, and then it was blindly and separately read by six additional experts (a total of seven results). All experts received standard training as above that was specific in Pulmonary Artery Catheter Education Project level 2. The experts have worked in this area for more than 5 years.
Clinical data
The 12 patients who underwent pulmonary artery catheter (PAC) and mechanical ventilation in our intensive care unit were prospectively recruited from August 2009 to August 2012. All measurements were divided into <8 mmHg or ≥8 mmHg according to respiratory variability (RV), and they were then subdivided into either an airway pressure display measurement (AM) group or an expiration holding (EH) group for comparisons. All measurements were composed of positive pressure ventilation mixed with spontaneous breathing. The mode was dual-level positive pressure ventilation plus assisted spontaneous breathing. The study was approved by the Ethics Committee on the Medical Research on Human Subjects of the Fifth Central Hospital of Tianjin. Informed written consent was obtained from all of the subjects.
Monitoring
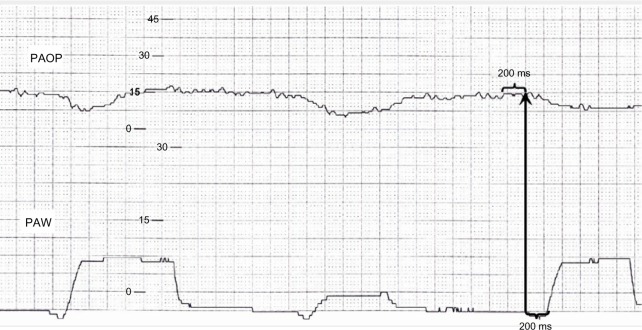
The patients were placed with a 7F PAC (Edwards Life-sciences Corporation, Irvine, CA, USA) in the right internal jugular vein, and subsequently connected to a GE Dash 4000 monitor (GE Healthcare Bio-Sciences Corp, Piscataway, NJ, USA). The catheter tip was placed into the pulmonary WEST III region with computed tomography examination. The pressure sensor was positioned at the same level as the axillary line at the fourth intercostal space. Before each measurement, the mechanical zero and electric zero positions were adjusted. The airway pressure display approach was conducted as described previously,4 with sample results shown in Figure 1. The end of expiration was identified by drawing a vertical line 200 ms before the initial positive or negative pulmonary artery wedge deflection of each breath. The time when the final data were captured (a total of seven results) was recorded as T1.
Figure 1.
The strip from the FACTT airway pressure display approach.
Abbreviations: PAOP, pulmonary artery occlusion pressure; PAW, pulmonary artery wedge; FACTT, Fluids and Cathers Treatment Trial.
For the expiration holding approach, the “expiration holding” button was pressed at the end of the spontaneous breath, with the PAC airbag inflated. Fifteen to 20 seconds after the airbag inflated following spontaneous inhalation, either inflation was stopped or the “expiration holding” button was pressed, reaching ventilator aspiration. From the “PAWP review” software, a graph was obtained by one specific expert that captured a frozen period of time. The end of expiration was identified as 200 ms either before the spontaneous breath, or before the positive pressure ventilation after “expiration holding.” The time when the final data were captured (a total of seven results) was recorded as T2.
Data analysis
The seven results for one recorded strip or frozen graph can lead to 21 pairwise comparisons. A match is defined when the difference between two results was <2 mmHg. All measurements were then divided into <8 mmHg or ≥8 mmHg according to RV. The match rate and duration for each measurement was calculated in each condition. Finally, a total of five recording strips were unclear and were subsequently excluded from the study, resulting in a total of 45 recording strips; in addition, three frozen graphs were unclear and were subsequently excluded, resulting in a total of 47 frozen graphs.
Statistical analysis
Generalized estimating equations using the Generalized Linear Model (GENMOD) procedure in SAS (SAS Institute Inc., Cary, NC, USA) were used for the analysis. Two-tailed P-values of ≤0.05 were considered statistically significant.
Results
PAWP waveform changes before and after expiration holding
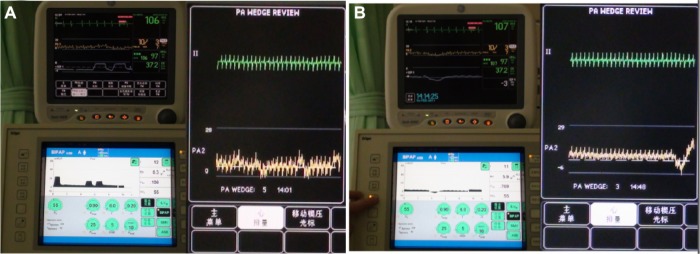
In the baseline state, when positive pressure ventilation was mixed with spontaneous breathing, the PAWP waveform fluctuates and the end of expiration cannot be identified (Figure 2A). When the “expiration holding” button was pressed, a smooth PAWP waveform was found; this effect lasted until either the spontaneous inhalation commenced (PAWP decrease), or until ventilation started (PAWP increase) (Figure 2B).
Figure 2.

The PAWP waveform fluctuations with positive pressure ventilation and spontaneous breathing, and after pressing the “expiration holding” button.
Notes: (A) Under a natural state, the PAWP waveform fluctuates with positive pressure ventilation and spontaneous breathing, and is associated with difficult identification of the end of expiration. (B) When pressing the “expiration holding” button, the PAWP fluctuations disappear until the beginning of self-inspiration; the end of expiration can be easily identified.
Abbreviations: PA, pulmonary artery; PAWP, pulmonary artery wedge pressure.
The comparisons between the two approaches
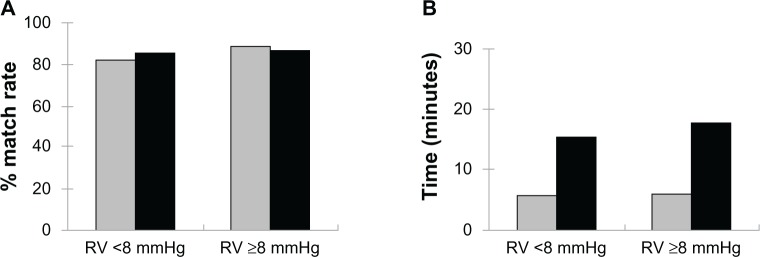
We found that in both the RV <8 mmHg and the RV ≥8 mmHg groups, the results measured with the two approaches showed no statistical significance (P>0.05) (Figure 3A). However, in both the RV <8mmHg and RV ≥8 mmHg groups, the amount of time needed for the eePAWP measurement was significantly shorter in the “ expiration holding” approach (P<0.05) (Figure 3B).
Figure 3.

The match rates of, and the amount of time consumed for, the measurements from the two approaches.
Notes: (A) the match rates of the measurements from the two approaches. (B) The amount of time consumed for the measurements from the two approaches; Black bars, airway display approach; gray bars, expiration holding approach.
Abbreviation: RV, respiratory variability.
Additionally, with respect to medical expenses, the “ expiration holding” approach does not incur additional costs, while the airway pressure display approach requires a personalized sensor for each patient, which costs US$70, and the printing of each strip costs US$1.70.
Discussion
Among the diverse parameters available for hemodynamics, the PAWP is one important index; the absolute value of the PAWP has been cited by the Joint Council of Europe and the United States in the standard diagnosis of acute lung injury/acute respiratory distress syndrome,6 as well as in guidelines for diagnosing pulmonary hypertension.7 The 7–3 volume therapy in the Liquid Load Test also cited the dynamic range for PAWP values.8 These guidelines emphasized the importance of the accurate measurement of PAWP. There are many factors that affect measurement accuracy such as the location of the catheter tip, the natural frequency and attenuation coefficient of the catheter connection tube–sensor system, the bubbles/thrombus observed in the pipes, the zero correction and placement, the adjustment for exogenous/endogenous positive pressure at the end of expiration, and importantly, end-expiratory waveform identification.
The end-expiratory waveform is at its minimum pressure value in positive-pressure ventilated patients, and it is at its maximum pressure value in spontaneous breathing subjects.9 The PAWP value that is automatically measured is higher than the eePAWP, depending on the extent of the tidal volume, lung compliance, and chest wall compliance. The greater the tidal volume, the higher the lung compliance and the more stiff the chest wall, resulting in an increase in inspiratory pleural pressure that is more obvious, which leads to an overestimation of the measurement.10,11 When positive pressure ventilation is mixed with spontaneous breath, this leads to a more complicated condition,8 and the overestimation/underestimation depends on the contribution of the two components. In addition, in the case of spontaneous breath, the airway resistance and the self-inspiratory force could also cause an underestimation of the measurement.12
Previously, the eePAWP measurements were mainly measured with vessel pressure waveform strip approach13 and the airway pressure display approach, the latter of which showed better accuracy. In the FACTT trial4 in 2005, the two approaches were combined, demonstrating promising results. However, we found that there are some disadvantages in this approach. First, the identification of the end of expiration is still limited: “200 ms before the initial positive or negative PAW deflection of each breath”4 is not always flat. Second, the frequency/attenuation coefficient of the difference sensors would affect the waveform. Third, the airway pressure sensor medium is air, while the vessel pressure sensor medium is liquid, leading to desynchronization of the signal transmission under certain circumstances. Fourth, the paper strip printing might have distorted graphics, and reading of these graphs by the human eye might bring certain errors. Fifth, the approach is time consuming, with multiple steps required for measurement. Finally, the sensors used for patients and the amount of paper printing required can increase certain medical costs.
In our “expiration holding” approach, the results are as accurate as those from the FACTT approach;4 however, our approach is not associated with any of the disadvantages described above. Still, there are several limitations with our approach. First, as in the FACTT trial,4 we compared the match rates of the reviewers rather than the recording accuracy of the recorders. Second, when comparing the two approaches, we compared the measurements from different time points. Third, the endogenous/exogenous positive pressure at the end of expiration was not corrected with the conduction index method.14 Fourth, in cases of fast spontaneous breath or slow heart rate, the smooth phase observed in the frozen graphic is short, suggesting that sedation procedures may be required for measurements. We expect to further explore an improved approach in the future, with an increased number of patients being involved.
Conclusion
In summary, the combined use of the ventilator and monitor for the “expiration holding” approach is a novel approach in eePAWP measurement. In addition, it can also act as a complementary approach to the airway pressure display approach.
Acknowledgments
The authors thank the hospital for support.
Author contribution
WY, XZ, QF, YA, KW, WW, and XC designed the study. WY, XZ, QF, YA, CL, and XC performed the study. All authors analyzed the data and wrote the paper together. All authors read and approved the final version of the manuscript. The authors listed here all contributed significantly to the study and merit the author requirements for the journal.
Disclosure
The authors report no conflicts of interest in this work.
References
- 1.Berryhill RE, Benumof JL, Rauscher LA. Pulmonary vascular pressure reading at the end of exhalation. Anesthesiology. 1978;49(5):365–368. doi: 10.1097/00000542-197811000-00010. [DOI] [PubMed] [Google Scholar]
- 2.Ellis DM. Interpretation of beat-to-beat blood pressure values in the presence of ventilatory changes. J Clin Monit. 1985;1(1):65–70. doi: 10.1007/BF02832692. [DOI] [PubMed] [Google Scholar]
- 3.Mitchell MM, Meathe EA, Jones BR, et al. Accurate, automated, continuously displayed pulmonary artery pressure measurement. Anesthesiology. 1987;67(3):294–300. doi: 10.1097/00000542-198709000-00003. [DOI] [PubMed] [Google Scholar]
- 4.Rizvi K, Deboisblanc BP, Truwit JD, et al. NIH/NHLBI ARDS Clinical Trials Network Effect of airway pressure display on interobserver agreement in the assessment of vascular pressures in patients with acute lung injury and acute respiratory distress syndrome. Crit Care Med. 2005;33(1):98–103. doi: 10.1097/01.ccm.0000150650.70142.e9. discussion 243–244. [DOI] [PubMed] [Google Scholar]
- 5.Yang WJ, Zhao XF, Feng QG, Wei K, Ren WB, Cheng XL. The application of “expiration holding” in measuring end expiration pulmonary artery wedge pressure in patients undergoing mechanical ventilation. Zhongguo Wei Zhong Bing Ji Jiu Yi Xue. 2011;23(4):228–231. Chinese. [PubMed] [Google Scholar]
- 6.Bernard GR, Artigas A, Brigham KL, et al. The American-European Consensus Conference on ARDS. Definitions, mechanisms, relevant outcomes, and clinical trial coordination. Am J Respir Crit Care Med. 1994;149(3 Pt 1):818–824. doi: 10.1164/ajrccm.149.3.7509706. [DOI] [PubMed] [Google Scholar]
- 7.Rubin LJ, American College of Chest Physicians Diagnosis and management of pulmonary arterial hypertension: ACCP evidence-based clinical practice guidelines. Chest. 2004;126:1–92. doi: 10.1378/chest.126.1_suppl.4S. [DOI] [PubMed] [Google Scholar]
- 8.Tuman KJ, Carroll GC, Ivankovich AD. Pitfalls in interpretation of pulmonary artery catheter data. J Cardiothorac Anesth. 1989;3(5):625–641. doi: 10.1016/0888-6296(89)90165-8. [DOI] [PubMed] [Google Scholar]
- 9.Mark JB. Atlas of Cardiovascular Monitoring. New York, NY: Churchill Livingstone; 1998. [Google Scholar]
- 10.Perel A, Pizov R. Cardiovascular effects of mechanical ventilation. In: Perel A, Stock MC, editors. Handbook of Mechanical Ventilatory Support. Baltimore, MD: Williams & Wilkins; 1992. pp. 51–65. [Google Scholar]
- 11.O’Quin R, Marini JJ. Pulmonary artery occlusion pressure: clinical physiology, measurement, and interpretation. Am Rev Respir Dis. 1983;128(2):319–326. doi: 10.1164/arrd.1983.128.2.319. [DOI] [PubMed] [Google Scholar]
- 12.Mark JB. Central venous pressure monitoring: clinical insights beyond the numbers. J Cardiothorac Vasc Anesth. 1991;5(2):163–173. doi: 10.1016/1053-0770(91)90333-o. [DOI] [PubMed] [Google Scholar]
- 13.Morgan BL.Hemodynamic waveforms interpretation 2005Available from http://www.caccn.ca/en/pdfs/4A%20Hemodyn_waves%20(B%20Morgan).pdfAccessed September 25, 2013
- 14.Teboul JL, Pinsky MR, Mercat A, et al. Estimating cardiac filling pressure in mechanically ventilated patients with hyperinflation. Crit Care Med. 2000;28(11):3631–3636. doi: 10.1097/00003246-200011000-00014. [DOI] [PubMed] [Google Scholar]


