

Abstract
Using multivoxel pattern analysis (MVPA), we studied how distributed visual representations in human occipitotemporal cortex are modulated by attention and link their modulation to concurrent activity in frontal and parietal cortex. We detected similar occipitotemporal patterns during a simple visuoperceptual task and an attention-to-working-memory task in which one or two stimuli were cued before being presented among other pictures. Pattern strength varied from highest to lowest when the stimulus was the exclusive focus of attention, a conjoint focus, and when it was potentially distracting. Although qualitatively similar effects were seen inside regions relatively specialized for the stimulus category and outside, the former were quantitatively stronger. By regressing occipitotemporal pattern strength against activity elsewhere in the brain, we identified frontal and parietal areas exerting top-down control over, or reading information out from, distributed patterns in occipitotemporal cortex. Their interactions with patterns inside regions relatively specialized for that stimulus category were higher than those with patterns outside those regions and varied in strength as a function of the attentional condition. One area, the frontal operculum, was distinguished by selectively interacting with occipitotemporal patterns only when they were the focus of attention. There was no evidence that any frontal or parietal area actively inhibited occipitotemporal representations even when they should be ignored and were suppressed. Using MVPA to decode information within these frontal and parietal areas showed that they contained information about attentional context and/or readout information from occipitotemporal cortex to guide behavior but that frontal regions lacked information about category identity.
Introduction
Average activity in several regions of human occipitotemporal cortex changes depending on which visual stimuli are the focus of attention (Corbetta et al., 1990; Gazzaley et al., 2005, 2007; Lepsien and Nobre, 2007; Higo et al., 2011). For example, average activity in “category-specific” areas, such as the fusiform face area (FFA), extrastriate body area (EBA), and parahippocampal place area (PPA), is increased when people attend to faces, bodies, and places, respectively. However, the additional existence of distributed representations of faces, bodies, and places outside of category-specific areas is suggested by multivoxel pattern analysis (MVPA) of functional magnetic resonance imaging (fMRI) data. Although individual voxels may only show subtle subthreshold changes when these stimuli are presented, they are nevertheless part of a highly reproducible multivariate pattern decodable each time the stimuli are presented (Haxby et al., 2001; Kriegeskorte et al., 2006; Norman et al., 2006). In this study, we investigate the influence of attention on such multivariate patterns and link this attentional modulation of patterns to activity in other brain areas in frontal and parietal cortex.
Multivariate pattern strength also increases when stimuli are attended (Chen et al., 2012; Hou and Liu, 2012; Seidl et al., 2012) and maintained in working memory (Kuhl et al., 2011, 2012a,b; Christophel et al., 2012). However, most MVPA studies decode patterns from large occipitotemporal regions encompassing multiple category-specific visual areas as well as less category-specific areas, such as lateral occipital cortex (LOC). Hence, it is not clear to what extent the decoded pattern is driven by univariate differences in category-specific areas.
In this study, we examined whether finer-scale spatial patterns within small regions of cortex centered on FFA, EBA, and PPA also vary with the level of attention and whether any such modulation depends on the correspondence between the presented stimulus type and the preferred stimulus type of the brain area. We trained our classifier on an independent condition, veridical perception, allowing us to make inferences on how closely the pattern during attention reflects lower-level stimulus features rather than more abstract higher-level or contextual features that may additionally be present.
Finally, we related changes in occipitotemporal pattern strength cortex to univariate signals throughout the rest of the brain to identify areas that exert top-down control over distributed representations in occipitotemporal cortex. This was accomplished by regressing trial-by-trial indices of multivariate pattern strength against whole-brain univariate activity. By using indices derived from both “categorically specific” areas and other occipitotemporal areas, we tested for interaction patterns consistent with active facilitation or inhibition of occipitotemporal representations and whether interaction patterns differed when areas were relatively specialized for processing particular stimulus types and when they were not. The interactions we found shed light on the roles of frontal cortical regions, such as the frontal operculum (FO), that become active during the initiation and performance of many different types of cognitive tasks (Dosenbach et al., 2007).
Materials and Methods
Rationale
In this study, we investigate how multivariate visual representations are modulated by different levels of attention. To this end, we first test whether MVPA can decode fMRI activity patterns in occipitotemporal cortex and whether the decoding accuracy is modulated by the level of attention. The results of these investigations are presented in Analyses 1 and 2. Second, we test whether these modulations in occipitotemporal multivariate patterns can be related to activity in other brain areas, such as frontal and parietal cortices. The results of these investigations are presented in Analyses 3 and 4.
In this paper, we will refer to the FFA, EBA, and PPA as being “privileged” regions for the processing of faces, bodies, and places, respectively, instead of the commonly used terms “category-specific” or “specialized.” Previous research (Haxby et al., 2001; Cichy et al., 2012, 2013), as well as our own study shows that these areas are not uniquely specialized because they contain information about more than just one stimulus category. However, stimulating these regions (Pitcher et al., 2009; Parvizi et al., 2012) seems to cause behavioral impairments mainly confined to the “preferred” stimulus category of the area, suggesting that the area is privileged, i.e., that it has some advantage when dealing with “its” stimulus category.
Subjects
Ten healthy volunteers (23–35 years old; nine males, one female) participated in the study, with each subject completing two separate fMRI sessions. Subjects reported no history of significant neurological or psychiatric history, and they did not take any psychotropic medication. After complete description of the study to the subjects, written informed consent was obtained in accordance with the Declaration of Helsinki. The study protocol was approved by the Research Ethics Committee of the University of Oxford.
Experimental task
During each fMRI session, subjects performed two tasks in an interleaved design. Attention task blocks consisted of eight trials, followed by 12 s of passive fixation (Fig. 1a). Visuoperceptual task blocks consisted of six trials of a dimming detection task (Fig. 1b). The color of the central crosshair (blue or yellow) was indicative of the task type (counterbalanced across subjects) so that a change in crosshair color signaled a switch to the other task type.
Figure 1.

Experimental paradigm. a, Attention to working-memory task. Subjects memorize two exemplars from different object categories. After an initial delay (crosshair fixation), they are cued to remember either one of these two stimuli by the number 1 or 2 (selective attention trial) or both stimuli by an ! symbol (nonselective attention trial). After a short delay, a triplet array is presented with one exemplar from each object category, followed by a backward mask. Subjects subsequently made a match/no-match decision depending on whether the attended stimulus/stimuli was present in the array. b, Visuoperceptual task. Subject viewed eight presentations of the same exemplar interleaved with fixation crosses, counting the number of times a shading square appeared in a random location, dimming part of the image. Next, a response screen appeared with two possible answers of which the subject had to pick the correct total number of dimmings. All times are given in milliseconds. The color of the fixation cross indicated the ongoing task to the participant. c, Break-down of trial types for each condition during each scanning session (every subject was scanned twice). Overall, the attended exemplar (in selective attention trials) or one of the attended exemplars (in nonselective attention trials) was present in 33% of trials. Therefore, a match decision was expected on these trials.
Attention to working-memory task
Subjects were instructed to memorize two initial stimuli, shown sequentially for 950 ms each, of a set of six possible pictures: frontal views of two female faces, two headless bodies of ballerinas, and two houses. On every trial, the two stimuli that were presented were drawn from different categories. For example a house and a face, a face and a body, or a house and a body might be presented in either order. After a variable delay period (4–8 s, steps of 1 s), a cue appeared on screen for 500 ms. The task consists of two types of trials that differed in the degree to which selective attention to particular stimuli was possible. On selective attention trials, the cue was the number 1 or 2, prompting the subject to only pay attention to either the first or the second stimulus in working memory and to ignore the other stimulus. In nonselective attention trials, the cue took the form of an exclamation mark, informing the subjects that both initial stimuli have to be kept in memory.
The subjects were asked to hold memories of one cued stimulus (selective trials) or both stimuli (nonselective trials) so as to be ready to judge whether or not they were present within an array of three images that was presented after another variable delay (1500–2500 ms, 500 steps) after the cue. The triplet array included one face, one body, and one house and was immediately followed by a 200 ms backward mask. The three stimuli in the triplet array were drawn from either the initial stimuli or an additional “unfamiliar” pool of 23 female faces, 23 headless bodies of ballerinas, and 23 houses that varied in similarity to the initial stimuli. Stimuli were taken from previously published datasets (Minear and Park, 2004; Higo et al., 2011) or created from publicly available images on the internet. After testing the first two subjects, triplet duration was fixed to 500 ms (for the first two subjects, triplet duration was 200 and 550 ms) to avoid confounds on the classification attributable to visual presentation duration differences between subjects. We thought this to be more important than trying to match task difficulty exactly across subjects, because subjects performed with high accuracy at this presentation duration (on average 88 and 78% correct for selective and nonselective trials, respectively).
The position of the object categories on the screen during triplet array presentation was randomized (always one on top and two below in a triangular formation). Therefore, subjects always had to search for the location of the attended category (selective trials) or both attended categories (nonselective trials) before reporting whether one of the initial stimuli (selective trial) or either of the initial stimuli (nonselective trials) were present (“match” decision, one-third of trials) or absent (“no match” decision, two-thirds of trials). Subjects indicated their decision by pressing one of two buttons. Button-response mapping was the same for all subjects, with the left button (index finger of the right hand) meaning target present and right button (middle finger of the right hand) meaning target absent. Subjects were asked to respond as soon as they had reached a decision. Responses were recorded from the onset of triplet appearance, during mask presentation and for an additional 4 s before the next trial began.
An initial training session outside the scanner on a separate day ensured that subjects became familiar with both the six initial stimuli and the task itself. This session consisted of 72 selective attention and 24 nonselective attention trials. During the two subsequent fMRI sessions, conducted at least 1 week apart, subjects performed the actual task, consisting of 144 trials per session, half of which were selective and half nonselective attention trials presented in a randomized order. The additional distribution of the trial types is shown in Figure 1c.
As in the experiment conducted by Higo et al. (2011), on which our task is based, we will focus our analyses on the time period immediately after cue onset. Because of the short time interval between cue and triplet appearance and the limited temporal resolution of the fMRI scan, we cannot fully separate effects attributable to attention to stimuli in working memory (before triplet onset) and attention to stimuli actually being present on the screen (starting at triplet onset). However, numerous investigations have highlighted similarities in the selective processes and neural mechanisms that underlie attention to visual representations and to representations in working memory (Griffin and Nobre, 2003; Lepsien et al., 2005; Nobre and Stokes, 2011; Gazzaley and Nobre, 2012). Our aim in using the current paradigm was to examine these selective processes that are probably common to both working memory and attention and their underlying neural mechanisms. Future experiments might compare the nature of these processes in visuoperceptual and working-memory contexts.
Visuoperceptual task
Each trial consisted of eight 1 s presentations of one of the six familiar stimuli (the initial stimuli in the attention to working-memory task), interleaved with presentations of a 1 s fixation cross. A random number (0–4) of these eight stimulus presentations contained a darker square shading a randomly selected position over the image. Across the entire experiment, each of the six stimuli was dimmed in this way 18 times, overall counterbalancing visuoperceptual conditions across the six different stimuli. After a 1 s fixation cross after the last stimulus presentation, a screen appeared for 2 s with two possible answers, from which the subject indicated the correct number of observed dimmings in the block by pressing the button corresponding to the side of the correct answer (index or middle finger of the right hand). After a 12 s passive fixation to allow for a return of the hemodynamic function to baseline, the next trial was started. Each block of this visuoperceptual task contained one trial for each of the six familiar stimuli, in a randomly chosen order.
Scanning
MRI scans were acquired on a 3 T Siemens Verio scanner equipped with a 32-channel head coil. A structural image was acquired using a T1-weighted sequence (1 × 1 × 1 mm3 voxels; 176 × 256 × 224 grid; TR, 3000 ms; TE, 4.75 ms; TI, 1100 ms; flip angle, 8°) and functional images using an EPI sequence (3 × 3 × 3 mm3 voxels; 64 × 64 × 44 mm grid; TR, 2410 ms; TE, 30 ms; flip angle, 90°). The first three volumes of each fMRI scan were discarded to allow for the signal to reach equilibrium state. Each subject underwent two fMRI scanning sessions of ∼50 min each at least 1 week apart. For the first three subjects, there was a break in scanning after three task blocks. For the seven subsequent subjects, scanning was continued during a subject-terminated rest break after each three task blocks to simplify subsequent analyses (obviating the need to model the different scanning “runs” within a session). Each scanning session consisted of 18 blocks of interleaved tasks, always starting with a visuoperceptual task block.
Data preprocessing
Statistica (version 6; StatSoft) was used for statistical analyses and SPM8 (Wellcome Trust Centre for Neuroimaging, London, UK; http://www.fil.ion.ucl.ac.uk/spm/software/spm8/) was used for data preprocessing and voxel-based statistics. Scans of separate sessions of the same subject were first coregistered (by registering the first scan of a session to the first scan of the first session). Motion correction was implemented by realigning and unwarping the scans. Next, slice time correction was applied to correct for differences in slice acquisition time. The structural MRI was coregistered to the mean EPI image and was segmented into gray matter. All images were nonlinearly transformed into MNI space using the transformation matrix obtained in the unified segmentation step of SPM8. Functional images were not smoothed for within-subjects analyses to preserve spatial resolution, as is commonly done in MVPA. For the first three subjects, runs within a session were demeaned to correct for potential overall signal differences attributable to scanner breaks, so they could subsequently be modeled as one “session” in the design matrix.
The design matrix included the following explanatory variables: face stimulus, body stimulus, house stimulus, and response in the visuoperceptual task; initial face, initial body, initial house (always two of these initial stimuli modeled per trial), face attend and body ignore (selective) cue, face attend and house ignore (selective) cue, body attend and face ignore (selective) cue, body attend and house ignore (selective) cue, house attend and face ignore (selective) cue, house attend and body ignore (selective) cue, face attend and body attend (nonselective) cue, face attend and house attend (nonselective) cue, body attend and house attend (nonselective) cue, triplet array, and response in the attention task. Because the time period between cue and triplet was short (1.5–2.5 s) compared with the TR (2.41 s), we only modeled the different attention conditions for one of these regressors. We chose to model them at the level of the cue rather than the triplet regressor to capture the earliest stage of the effect.
In addition, a switch-cue regressor (change in crosshair color) modeled the transition between the perception and attention tasks, and, for the last seven subjects, rest break periods between blocks were modeled as well. All trials were modeled as events, except for the rest break, which had a finite duration. Both scanning sessions were entered as separate sessions in SPM, as a result of which two extra covariates were included to model the session. Data were high-pass filtered at 128 s, and a canonical hemodynamic response function (HRF) (without time or dispersion derivatives) was used as the basis function for modeling the responses.
A univariate statistical parametric mapping approach yielded contrast images for the visuoperceptual and attention conditions (for specific contrasts used, see next section). A priori volumes of interest (VOIs) were defined as a sphere with a 6 mm radius around an average coordinate derived from previous studies (Higo et al., 2011) averaging across left and right hemisphere VOIs: FFA (−37, −54, −22; 41, −51, −24), EBA (−46, −79, −5; 49, −74, −4), PPA (−29, −50, −12; 29, −47, −13), LOC (two coordinates per hemisphere: −31, −93, −4; 32, −92, −2; −38, −85, −5; 38, −84, −4), and occipitotemporal cortex (the average across all the aforementioned VOIs).
Multivoxel pattern classification
We conducted a series of MVPA-based analyses of visual category-specific representations. The first analysis tested whether representations of visual category were present even outside of the occipitotemporal regions privileged for the particular category and examined how they were modulated as a function of attention. The second analysis confirmed this attentional modulation using a complementary trial-by-trial decoding method. The third analysis was used to identify other brain regions that might interact with this trial-by-trial decoding of distributed multivariate patterns in occipitotemporal cortex. The fourth analysis examined whether the frontal and parietal areas identified by the third analysis also contained information about the attended visual category or whether they instead represented other aspects of the task, such as the attended stimuli being present or absent in the triplet array (match vs non-match) or the attentional condition (selective vs nonselective attention) used on a given trial.
1: Correlational approach.
Input data for whole-brain pattern classification were contrast images obtained from the standard SPM analysis mentioned above, using unsmoothed input data. Classification involved a linear correlation approach (Stokes et al., 2009), with the “training set” always being a contrast derived from the visuoperceptual task in which stimuli were presented in isolation [e.g., face − (body + house)] and the “test set” usually an attention contrast (a contrast derived from the “cue” regressor in the attention task).
The attention contrast that was expected, on the basis of univariate fMRI activity (Higo et al., 2011), to generate the greatest difference between conditions was that between selectively attending and ignoring a certain stimulus category. For example, for the face category, this “selective attend − selective ignore” contrast is given by the following:
 |
We specified three additional attention contrasts, corresponding to the three different “levels” of attention for each object category in our paradigm: (1) a nonselectively attended target category (using data from nonselective attention trials on which that category of stimulus had been presented); (2) the selectively attended target; and (3) its counterpart the selectively ignored distractor (based on selective attention trials on which the subjects selectively attended to that particular stimulus category or on which they could ignore that stimulus category, respectively). Each level was contrasted against an “absent” condition (trials on which the stimulus category was not present among the initial stimuli at the start of the trial). On these trials, the stimulus category was neither ignored nor attended (neither selectively nor nonselectively).
For example, for the face category, the “selective attend” contrast is given by the following:
 |
The “selective ignore” contrast is given by the following:
 |
The “nonselective attend” contrast is given by the following:
 |
The weighting factor of 2 in the last contrast ensures that the number of regressors involved in calculating the subtraction contrast is proportionate. Analogous contrasts for the body and house categories were also constructed.
Next, a searchlight approach (Kriegeskorte et al., 2006) was used in which, for each gray matter voxel (gray matter probability >0.01), decoding was performed using all voxels within a sphere with a radius of 9 mm centered on that voxel. More specifically, using all voxels in the spherical searchlight, the values for the training contrast were correlated with the corresponding values for the test contrast, yielding a correlation coefficient that was assigned to the central voxel (Stokes et al., 2009). This approach yields images of pairwise correlations between the different training and test contrasts.
Areas that encode the stimulus category of interest, e.g., faces, are expected to show a higher pairwise correlation between the training (e.g., visuoperceptual) contrast for faces and the test (e.g., selective attend − selective ignore) contrast for faces compared with all other pairwise correlations (i.e., train with faces vs test with bodies; train with faces vs test with houses; train with bodies vs test with faces; and train with houses vs test with faces). In other words, we expect to find more similar patterns when training and testing on the same stimulus category versus on two different categories if the area indeed encodes category-relevant information. If such a pattern of correlation values is true for all three stimulus categories, it corresponds statistically to finding a significant interaction effect between the training conditions and the testing conditions when performing a repeated-measures ANOVA with decoding accuracy (correlation between patterns) as the dependent variable and training condition (three levels, one for each stimulus category) and test condition (three levels, one for each stimulus category) as within-subjects factors.
We performed such a repeated-measures ANOVA voxelwise on the correlations between the visuoperceptual and the “selective attend − selective ignore” contrast images. For this group-level analysis, subjects' correlation maps were first smoothed with an isotropic 6 mm full-width at half-maximum (FWHM) Gaussian kernel before being entered in a “full factorial” design in SPM. We report areas showing a significant interaction effect between the training and test set reflecting the ability to decode all three stimulus categories. To expand on this finding, we next extracted mean decoding accuracy (train–test correlations) based on each of the three attended versus absent contrasts (selective attend, selective ignore, and nonselective attend) from the a priori VOIs in FFA, EBA, PPA, and LOC. For each contrast, we performed a similar repeated-measures ANOVA as before but now with VOI (four levels) as one additional within-subjects factor.
2: Logistic regression analysis (trial-by-trial MVPA approach).
Because the “correlation approach” to multivariate analysis described above is performed on beta estimates based on the entire fMRI session for each subject, it only yields one summary index of multivariate pattern strength per subject across the entire experiment. To determine multivariate pattern strength on individual trials within each subject, we used a logistic regression approach similar to that used in previously published studies (Kuhl et al., 2012a,b), implemented in the Princeton Multi-Voxel Pattern Analysis toolbox (http://code.google.com/p/princeton-mvpa-toolbox/).
Input data for the Princeton MVPA toolbox were the motion and slice-time corrected (unsmoothed) functional images in MNI space. Only time courses from voxels within each of the predefined masks (left and right FFA, EBA, PPA, and LOC) were retained. High-pass filtering (128 s), detrending, and z scoring were performed within each session. Relevant regressors already convolved with the HRF were imported from the SPM design matrix.
To improve the signal-to-noise ratio for subsequent pattern decoding, we averaged fMRI activity across multiple sequential fMRI volumes at the appropriate time in the cognitive task, yielding one representative activation pattern summarizing a single trial. For a visuoperceptual training trial, the HRF convolved events (eight presentations of the stimulus in short succession) sum to a block-type activation, of which we selected the five scans with the highest value for the (convolved) regressor. This corresponds to the scans in the center of the activation block, which are the least affected by onset or offset of the condition. For each of the attention trials, we selected the three scans with the highest value for the (convolved) regressor reflecting cue onset (see Fig. 7). The averaged pattern of activity across the selected scans for each trial was used as the input for subsequent classifier training and testing.
Figure 7.

Pattern decoding probabilities for the different conditions and time points. a, Mean ±SEM decoding probabilities in occipitotemporal cortex across subjects for the attended (s att), ignored (s ign), and absent (s abs) stimulus in the selective attend condition (left) and for the attended (ns att) and absent (ns abs) stimulus in the nonselective attend condition (right). These data were obtained by averaging across the three scan volumes shown in gray shading (b–d) to improve the signal-to-noise ratio. b, Regressor describing the cue event over time (in scan volume), convolved with an HRF. c, d, Mean ± SEM decoding probabilities across trials and subjects per scan volume for selective (c) and nonselective (d) trials. Trials were time-locked to the onset of the cue (scan 4, see b).
The classifier algorithm used was a logistic regression with L1 regularization (default options as provided by the Princeton MVPA toolbox). We trained one multinomial regression classifier to distinguish between the three object categories based on all visuoperceptual task trials, which was subsequently tested on all trials of the attention task. For each trial, the classifier assigned a probability that the attended category was a face, body, or house: these decoding probabilities always summed to 1.5, and the object category associated with the highest probability was assumed to be the final guess of the classifier (“winner takes all”).
3: Identification of top-down control areas beyond occipitotemporal cortex.
This analysis sought to identify brain areas in which univariate activity was correlated with the trial-by-trial variation in the strength of the multivariate patterns in occiptotemporal cortex identified in the preceding analysis. Areas with such a pattern of activity may also contain information about the type of stimulus. Alternatively, or additionally, such areas might exert top-down control over the occipitotemporal cortex.
To test which brain areas contained activity correlated with decoding accuracies in the occipitotemporal cortex, we performed a modified first-level SPM analysis in each subject. To this end, we included three regressors of interest (not convolved with an HRF), reflecting trial-by-trial decoding probability for selectively attended, selectively ignored, and nonselectively attended categories. These probabilities were based on a composite VOI, including bilateral FFA, EBA, PPA, and LOC VOIs as defined previously. For example, in case of a “face attend and body ignore” trial, the probability associated with face decoding was reflected in the selective attend regressor and the probability associated with body decoding in the selective ignore regressor. For a nonselective “face attend and body attend” trial, the value in the nonselective attend regressor was the mean of the decoded probabilities for the face and body categories. Decoding accuracy, which as mentioned above is the result of decoding across the three scans reflecting cue onset, was assigned to the time corresponding to the first of these scans to reflect the early influence of top-down control.
Furthermore, to model out potential confounding effects, we added similar (HRF-convolved) regressors (modeling the initial face, initial body, initial house, and triplet array events) to obtain univariate analysis-based contrast images. Unlike in the previous univariate analysis, we did not model cue type because of a high correlation with the three regressors of interest reflecting trial-by-trial decoding at cue onset. Finally, the design matrix also included the (HRF-convolved) visuoperceptual events (viewing faces, bodies, and houses, and response events) as confounding regressors, because blocks of visuoperceptual and attention trials were interleaved.
For every subject, contrast values were created for each of the decoding probability regressors (selective attend, selective ignore, and nonselective attend), which reflect the partial correlation between that regressor and the fMRI signal, taking into account variability attributable to other sources modeled in the design matrix. These contrast images were smoothed with an isotropic 8 mm FWHM Gaussian kernel and entered into three second-level analyses, one for each contrast, to test significant effects across subjects (voxelwise one-sample t test). The threshold for significance was set at a cluster-level FWE-corrected p < 0.05. with voxel-level uncorrected p < 0.001.
Positive effects would suggest a consistent positive (partial) correlation between decoding probability in occipitotemporal areas and fMRI response in the remote voxel, suggesting a voxel that may be implicated in top-down facilitative control over attention in occipitotemporal cortex. Negative effects would be consistent with the remote voxels being in a brain area that exerted a top-down inhibitory influence over the occipitotemporal cortex. It is perhaps worth briefly clarifying this argument because it partly depends on the results of the previous analysis. Analysis 2 (trial-by-trial MVPA approach; see Fig. 7) showed that occipitotemporal multivoxel patterns associated with the to-be-ignored stimulus became weaker rather than stronger. If another brain area is actively causing that weakening of occipitotemporal pattern strength, then we should expect its activity to be greater on trials when occipitotemporal pattern strength was lower.
Next, we tested whether there was a difference between such a correlation when decoding was based either on areas privileged for the stimulus category compared with decoding within the rest of occipitotemporal cortex, i.e., “nonprivileged” regions for that stimulus category. To this end, in two additional analyses, we repeated the above procedure but, instead of using regressors based on the trial-by-trial multivariate pattern strength within the occipitotemporal composite VOI, we used regressors that were based on the trial-by-trial strength of the multivariate pattern in either of the following: (1) the area privileged for the category of interest (e.g., multivariate pattern strength associated with face decoding was derived only from the bilateral FFA)—as a short hand, we refer to this condition as using “privileged area regressors”; or (2) the nonprivileged regions, i.e., the occipitotemporal composite VOI minus the privileged area (e.g., multivariate pattern strength associated with face decoding was derived only from bilateral EBA, PPA, and LOC but not FFA)—as a short hand, we refer to this condition as using “nonprivileged area regressors.” In this way, we can determine whether there are differences in top-down control when areas are categorically privileged or nonprivileged for a particular stimulus type.
To investigate the resulting areas further, we chose seven VOIs based on the locations of local maxima in the maps for “privileged area regressors” (because this contrast showed most significant areas), subdividing the frontal and parietal clusters into subclusters: (1) pre-supplementary motor area (pre-SMA); (2) dorsal premotor cortex (PMd); (3) lateral prefrontal cortex (LPFC; extending across inferior frontal sulcus, areas 9/46v, 9/46d, and 8B); (4) inferior frontal junction (IFJ; adjacent 6v); (5) FO; (6) anterior intraparietal sulcus (aIPS); and (7) posterior intraparietal sulcus (pIPS). We selected the closest local maximum, if present, to each of these regions in the nonselective attention contrast group comparison. To corroborate the results of these analyses and to exclude any selection biases in our analyses, we also checked activity in similar VOIs based on the maxima of the selective attend contrast group analysis. The locations of this second set of regions were often close to or even overlapping with the locations of the regions determined on the basis of the nonselective attend contrast. The selective ignore contrast showed no significant clusters. Spherical VOIs with a radius of 6 mm (similar to the occipitotemporal VOI definition) were centered on each of these peak coordinates (Table 1). The mean contrast values in these areas reflecting partial correlations between their univariate fMRI activity and privileged area or nonprivileged area regressors were compared with repeated-measures ANOVAs.
Table 1.
Frontal and parietal VOI center coordinates
| Hemisphere | Nonselective contrast | Selective contrast |
|---|---|---|
| Pre-SMA | ||
| Left | −6, 8, 55 | −3, 8, 55 |
| Right | 9, 8, 49 | 9, 14, 46 |
| PMd | ||
| Left | −39, −4, 49 | −39, −1, 40 |
| Right | 48, −1, 46 | |
| LPFC (areas 9/46v, 9/46d, inferior frontal sulcus, 8B) | ||
| Left | −39, 35, 31 | −36, 32, 40 |
| Right | 36, 26, 40 | |
| IFJ and adjacent 6v | ||
| Left | −45, 8, 37 | −39, −1, 40 |
| Right | 51, 2, 43 | |
| aIPS | ||
| Left | −36, −49, 43 | −27, −49, 40 |
| Right | 36, −43, 49 | |
| pIPS | ||
| Left | −18, −58, 46 | −24, −67, 34 |
| Right | 24, −64, 46 | |
| FO | ||
| Right | 33, 23, −5 |
Peak coordinates in which univariate fMRI activity shows a significant correlation with trial-by-trial decoding probabilities in occipitotemporal cortex. “Selective contrast” refers to the correlation with decoding performed within the occipitotemporal area thought to be privileged for the category of interest (privileged area regressors; see Materials and Methods). “Nonselective contrast” refers to the correlation with decoding performed within the nonprivileged regions (nonprivileged area regressors; see Materials and Methods).
4: Frontal and parietal decoding of stimulus category, response selection, and attentional context.
The preceding analysis, Analysis 3, identified areas of frontal and parietal cortex in which the univariate brain signal was correlated with trial-by-trial variation in pattern strength in occipitotemporal cortex. Because we wanted to establish whether these frontal and parietal areas also contained information about the identity of the stimulus category that was attended, we used the same multinomial logistic regression classifier as mentioned previously (Analysis 2) within each of the frontal and parietal VOIs (as defined in Analysis 3).
First, as before (Analysis 2), we attempted to decode the difference between attended stimulus category, training the classifier on all visuoperceptual task trials and testing on all attention task trials, but this time using data from a frontal or parietal VOI. We then calculated the percentage of correctly classified trials (i.e., highest decoding probability given to the real category) of all attention trials (chance level is 0.33). This analysis thus tests whether there is any information present in those VOIs that is directly related to the actual visual category.
However, these areas may not encode visual characteristics in the same way as in veridical perception per se but could instead encode more abstract/more highly processed features such as salient areas in the stimulus or the fact that the stimulus was the focus of attention. Therefore, we performed an additional analysis that was intended to investigate whether it was possible to identify, for example, a face attend trial on the basis of the similarity in the multivariate activity in these areas with the activity recorded on other face attend trials. This time, the classifier was trained with attention trials instead of visuoperceptual data. We used a leave-one-out classification approach whereby each attention trial was used as a test trial once to be classified based on a training set consisting of all remaining attention trials. Again, the percentage of correctly classified trials was tested versus the chance level of 0.33.
To test alternatively whether these frontal and parietal VOIs contain more abstract information about the attention task to be performed rather than the actual stimuli to be attended, we ran two more multinomial logistic regressions: (1) one to discriminate between selective and nonselective attention trials; and (2) one to decode match and no-match attention trials. The first analysis will test whether the activity contains information about the rule to be used for determining the deployment of top-down attention (pay attention to one vs two stimuli) and should therefore highlight areas involved in top-down control over visual cortex. The second analysis tests whether the activity contains information about the response to be given, more specifically whether the attended stimulus is present (match) or absent (no-match) in the triplet array, and therefore it should highlight areas that are more involved in reading out signals from occipitotemporal cortex to guide behavior. We again used a leave-one-out cross-validation approach: we trained the classifier on all attention trials but one and tested it on the left-out trial, with every trial being left out once, and report the average percentage of correctly classified trials across all these permutations (with chance level being at 0.5).
For all four of these MVPAs, a repeated-measures ANOVA on all subjects was first used to test whether there was a significant difference in pattern decoding across the different areas and hemispheres. Decoding accuracies per subject were next averaged across similar areas and submitted to a one-sample t test against chance level.
Results
Behavioral performance
Subjects performed very well on the visuoperceptual task, with an average accuracy of 96% (range of 91–99%). Such high performance levels confirm that they were engaged in viewing the stimuli.
In the attention task, subjects were significantly slower (p = 0.000018) and less accurate (p = 0.0026) on nonselective trials (mean of 1345 ms, 77% correct) compared with selective trials (mean of 1055 ms, 89% correct; Fig. 2). Hence, subjects indeed used selective cues to their advantage rather than adopting a strategy of always comparing both initial stimuli with the triplet array.
Figure 2.

Behavioral performance. Mean ± SEM reaction time.
Multivoxel pattern classification
Correlational approach
This first set of analyses examined whether distributed multivariate representations of visual category identity were present even outside of the occipitotemporal regions privileged for the particular category. It then examined how these representations changed as a function of attention.
First, in a proof-of-principle test, we tried to predict which stimulus category a subject was viewing based on the pattern within each occipitotemporal VOI. To this end, we used visuoperceptual contrast images, one for each subject, based on one of the fMRI sessions as the training condition and the visuoperceptual contrast images from the remaining session as the test condition (Fig. 3). We found that all four VOIs (FFA, EBA, PPA, and LOC) were capable of decoding which object category subjects are viewing; the test × training interaction effect was highly significant (p < 10−8). In other words, the decoding accuracy for the face pattern strength when a face was presented in the test dataset was higher when the classifier had been trained on trials of the same type, and this was true for the other two stimulus categories as well. Thus, with MVPA, we were able to decode the object category even if it is not the preferred category of the area (e.g., the EBA, privileged for bodies, is nevertheless also able to discriminate between faces and houses).
Figure 3.

Visuoperceptual decoding. Decoding accuracy (y-axis) is given by the correlation between a training pattern, indicated here within each panel, and a test pattern, one per panel. The training and test data are visuoperceptual data from two independent MRI sessions in the same participant. The highest decoding accuracy per panel predicts at which object category a subject is looking. The different privileged areas are indicated by different colors. Mean ± SEM decoding accuracy are plotted. B, bodies; F, faces; H, houses. Lines are plotted to guide the eye only. Yellow crosses indicate correlations significantly different from 0 (one-sample t test, p < 0.05).
Importantly, using a univariate approach (comparing the average contrast value in the same VOI), we were generally only able to predict the preferred object category within the privileged areas. The EBA showed significantly larger activity for bodies compared with the other two object categories (paired t tests, p = 0.0000040), but there was no significant difference between the nonpreferred face and house categories (p = 0.48). Likewise, the FFA showed higher activity for faces compared with bodies and houses (p = 0.019), whereas activity for bodies did not differ from houses (p = 0.63). In the PPA, activity for houses was largest and significantly different from activity for the other two object categories (p = 0.000020), although activity for bodies was also slightly higher than activity for faces (p = 0.019). Because univariate signals in privileged regions cannot distinguish between nonpreferred categories, this suggests that the multivariate encoding of this information cannot simply be attributed to univariate changes.
Second, we tested whether we could decode which stimulus category a subject was attending to during the attention task. To this end, we used the training contrast from the visuoperceptual task and different test contrasts from the attention task. Decoding was clearly possible from all four VOIs during trials in which subjects attended to one object type only (selective attend contrast used as test set, test–train interaction, p = 2.9 × 10⁻⁵; Fig. 4a). In other words, it is possible to decode from each individual occipitotemporal area which object category subjects are attending to on the basis of training datasets in which subjects viewed single objects in isolation. Decoding was less precise for nonselective trials in which subjects divided their attention across two categories (nonselective attend contrast used as test set, test–train interaction, p = 0.015; Fig. 4b). This is probably attributable to the fact that we now try to decode from a contrast image that combines information from two different attended categories; hence, the simultaneous presence of two patterns may interfere with decoding of each individual pattern. Finally, decoding the selectively ignored category was not possible in any VOI (selective ignore contrast used as test set, test–train interaction, p = 0.91; Fig. 4c). This analysis confirms the selective nature of the representation of the attended category and suggests no detectable information about the identity of the ignored category remained.
Figure 4.
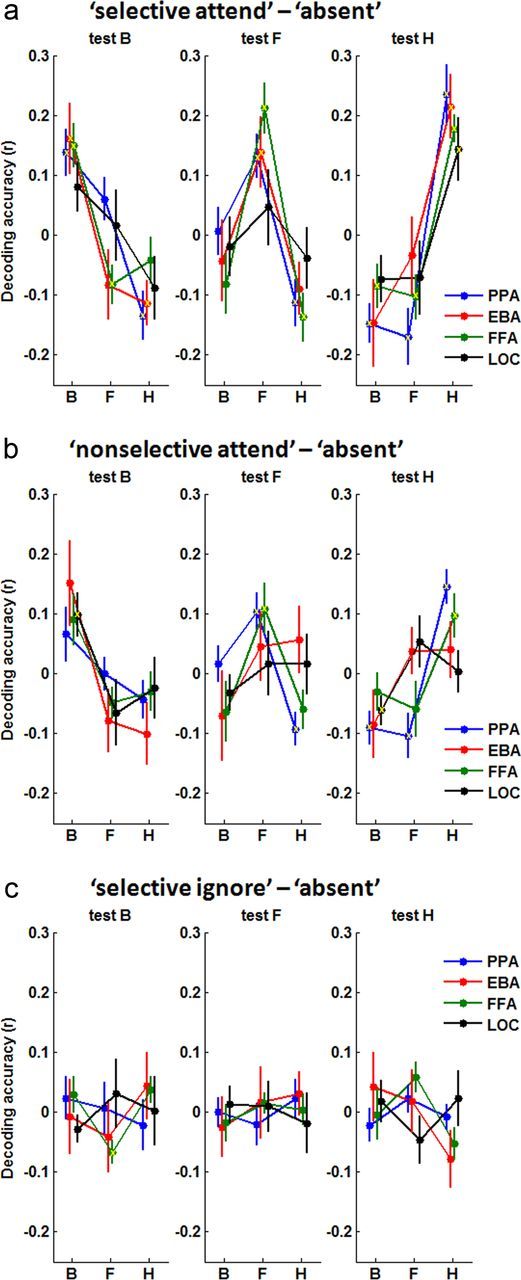
Decoding of attention. Decoding accuracy (y-axis) is given by the correlation between a training pattern, indicated here within each panel, and a test pattern, one per panel. The training set is always visuoperceptual data, and the test set is an attention contrast in the same participant (a, selective attend; b, nonselective attend; c, selective ignore; see Materials and Methods). The highest decoding accuracy per panel predicts to which object category a subject is attending (or ignoring in c). The different privileged areas are indicated by different colors. Mean ± SEM decoding accuracy are plotted. B, bodies; F, faces; H, houses. Lines are plotted to guide the eye only. Yellow crosses indicate correlations significantly different from 0 (one-sample t test, p < 0.05).
A voxel-based ANOVA on the “selective attend − ignore” contrast (Fig. 5) tested for regions across the whole brain in which there was a similar significant test–train interaction effect (FWE-corrected cluster-level p < 0.05, voxel-level p < 0.001). The test identified a continuous region in bilateral occipitotemporal cortex overlapping with all the privileged areas, FFA, EBA, and PPA, that we had investigated. This suggests that any change in the precise placement of regions of interest within occipitotemporal cortex would be unlikely to alter the conclusion that all regions privileged for particular stimulus categories can actually decode between all three attended categories.
Figure 5.

Voxel-based interaction effect. Areas showing a significant interaction effect between the visuoperceptual training and attentional test set, reflecting a higher similarity between patterns when the category that is being attended to is the same as the category being viewed in a separate dataset (for a more extended explanation of the interaction effect, see Materials and Methods). Areas in red are significant at uncorrected voxel-level p < 0.001 combined with FWE-corrected cluster-level p < 0.05; areas in yellow are significant at voxel-level FWE-corrected p < 0.05. L, Left hemisphere. Numbers in the top left corner indicate MNI slice coordinates.
Despite the fact that FFA, EBA, and PPA all seem to contain information about all three stimulus categories and that the strength of the representation of the information changes with attention, attentional modulation of pattern strength is most apparent when attention is directed to the stimulus category for which the area is privileged. To demonstrate this quantitatively, we calculated an index of “discriminability” for the category of stimuli for which the three areas, FFA, EBA, and PPA, are privileged (faces, bodies, and houses, respectively) versus the two other categories (houses and bodies, houses and faces, and bodies and faces, respectively). This discriminability index summarizes how much higher the similarity is between the multivariate patterns in the attention condition versus the visuoperceptual condition when attended and visuoperceptual categories are the same as opposed to different. For each category (e.g., bodies), we calculated a discriminability index as follows:
 |
with corr(body test vs body train) being the correlation between attended bodies (from the test dataset acquired during the attentional task, using the selective attend contrast) and visually presented bodies (from the training dataset acquired during the visuoperceptual task), corr(body test vs face train) is the correlation between attended bodies in the attention task (test) and faces in the perceptual task (train), etc.
The EBA showed the highest discriminability index for bodies, the FFA for faces, and the PPA for houses (Fig. 6). A repeated-measures ANOVA with category type (bodies, faces, and houses) as categorical predictor and discriminability index in the privileged area (discriminability index for bodies in EBA, for faces in FFA, and for houses in PPA) as well as the mean discriminability index across both remaining nonprivileged areas (average discriminability index for bodies in FFA and PPA, for faces in EBA and PPA, and for houses in FFA and EBA) as dependent variables yielded a significant main effect of privileged area versus nonprivileged area (p = 0.023), without a significant main effect of category type (p = 0.37) or interaction effect (p = 0.83).
Figure 6.

Discriminability indices. Mean ± SEM index of discriminability across subjects for each stimulus type and category-specific area. This index reflects how much higher the multivariate pattern similarity between attended and viewed stimuli is when both stimuli belong to the same as opposed to different categories (for the formula, see Results).
Previously, we demonstrated the presence of multivariate decoding in the absence of significant differences in univariate signal. However, in the current analysis, we cannot exclude the possibility that the finding of higher discriminability indices may be related to the presence of stronger univariate signals for the preferred category. Theoretically, correlation coefficients, which we use for classification here, do not change if a constant value, reflecting univariate signal increase in the privileged area, is added to or multiplied with one or both of the regressors. However, we cannot exclude the possibility that the signal increase would be inhomogenous between voxels or that it might be accompanied by a decrease in variability. Our main aim here is to demonstrate that MVPA can be a more flexible and robust analysis tool than univariate analyses, not to specifically measure fully independent non-univariate effects.
In summary, we found that, both within and outside of the privileged occipitotemporal region, distributed multivariate representations of stimulus category were most detectable in selective compared with nonselective attention conditions. For each stimulus category, the privileged area showed the highest pattern similarity between the attention condition and the visuoperceptual condition. These results suggest that, although stimulus category encoding may be implemented across a large occipitotemporal area, its encoding in privileged areas may nevertheless be favored or specialized in some way.
The increased ability to decode stimulus category during selective compared with nonselective attention trials may be attributable to attention being more focused and/or working-memory load being decreased. Emrich et al. (2013) showed that MVPA-based decoding in visual cortex decreases with increasing memory load. They suggest that this may reflect a decreased mnemonic precision of the attended/memorized stimuli. As mentioned previously, because of the temporal resolution of our fMRI paradigm, we cannot separate effects attributable to attention to stimuli in working memory from attention to stimuli present on the screen.
Logistic regression analysis (trial-by-trial MVPA approach)
The second set of analyses used a complementary approach to corroborate whether distributed multivariate representations of visual category identity changed as a function of attention. The key difference between Analysis 2 and Analysis 1 is that Analysis 2 used a trial-by-trial index of multivariate pattern strength. Figure 7, c and d, shows pattern strength, as indexed by mean pattern decoding probabilities in the occipitotemporal composite VOI, per scan volume, time-locked to the onset of the cue for selective and nonselective trials across all subjects. Despite the expected noisy nature of this signal, the plot confirms the existence of attentional modulation linked to the cue in the three scan volumes that the analysis focused on (Fig. 7, gray shading). In the remainder of this section, results are discussed after averaging of these three scans to improve the signal-to-noise ratio.
Pattern strength in occipitotemporal cortex, as indexed by decoding probabilities, varied significantly with condition (Fig. 7a). Subjects showed lower decoding probabilities for the pattern associated with the ignored compared with the absent category—the category of the object that had not been presented at all at the beginning of the trial (t test, p = 0.0083)—and for the absent category compared with the selectively attended category (t test, p = 0.00034). The decoding probabilities for the attended category in the nonselectively attended trials were likewise higher than for the absent category (t test, p = 0.041).
The observation that the pattern strength for ignored stimuli is lower than that for absent stimuli suggests that the pattern becomes less clear (more random) in the ignored condition and hence possibly reflects selective inhibition. Note that we do not make any inferences about the exact change in the underlying univariate BOLD signal, which could be decreased (perhaps reflecting decreased neuronal processing), increased (perhaps reflecting input from active top-down inhibition), or similar (perhaps reflecting a combination of the two processes).
There was no difference in decoding probabilities between trials in which a cued stimulus was present in the triplet array compared with trials in which all triplet stimuli were nontargets (paired t test between match vs no-match trials for mean decoding probabilities across subjects for selectively attended, selectively ignored, or nonselectively attended stimuli, p > 0.31). The fact that decoding probabilities are not significantly influenced by the presence of the attended or ignored target confirms that we are not decoding information about identity match and justifies pooling both match and no-match trial types in all other analyses to increase sample size.
In summary, trial-by-trial decoding confirmed the presence of attentional modulation as measured with the correlational approach (see above, Correlational approach). We also found significantly decreased decoding probabilities for the pattern associated with the ignored stimulus category, possibly reflecting selective inhibition.
Lewis-Peacock et al. (2012a,b) report a return of MVPA evidence for the uncued item back to baseline rather than the small drop below baseline we report here. LaRocque et al. (2013) use the same paradigm as Lewis-Peacock et al. combined with EEG to provide an improved temporal resolution. MVPA decoding peaks at ∼7 s after the cue, which is concordant with fMRI-based decoding in both the Lewis-Peacock et al. studies as well as our own study (Fig. 7, three scans after onset = 7.2 s).
There are a number of basic methodological differences that could explain the apparent lack of selective suppression in the studies by Lewis-Peacock et al. For example, they trained their classifier on delay period activity, whereas we trained our classifier on veridical stimulus perception trials, and they tested in a more extensive area than our occipitotemporal VOI, which included frontal and parietal cortices. However, more importantly, their double retrocueing paradigm differs substantially from our task in terms of the behavioral importance attached to the uncued stimulus.
In the first half of their trial, uncued items could not be completely discarded (or inhibited), because this information could become relevant again after a second cue (in “switch” trials). This second half of the trial is most similar to our paradigm, in which the irrelevant stimulus category will not be probed and can now be fully discarded from working memory. In the studies of Lewis-Peacock et al., there is some indication that the irrelevant stimulus category may drop below baseline during this second half of the trial (Lewis-Peacock et al., 2012a, their Fig. 6; Lewis-Peacock et al., 2012b, their Fig. 5). This would be compatible with the drop observed in our study, which may thus be associated with more fully discarding the irrelevant stimulus from working memory instead of keeping it online and ready to reuse. However, given the increased complexity of the double-cue task, it is perhaps not surprising that participants might not fully suppress the irrelevant item even after the second cue.
If anything, in our experiment, there may be even more need for strong suppression of the irrelevant stimulus category than in the studies by Lewis-Peacock et al., because, unlike in their studies, the irrelevant stimulus category in our paradigm is present in the probe array of stimuli. Such different levels of stimulus category suppression, with more suppression (reflected in lower classifier evidence) demanded when the subsequent behavioral task is more sensitive to interference from the irrelevant information, may also explain the strong inhibition effects seen by Seidl et al. (2012).
Identification of top-down control areas beyond occipitotemporal cortex
Next, we tested whether other brain areas contained a univariate BOLD signal that was correlated with the strength of pattern decoding in the occipitotemporal cortex described in the previous section. This analysis should identify areas that are engaged in top-down control over representations in occipitotemporal cortex. Partial regression plots were used to test for possible outliers influencing correlations within individual subjects. One trial in one subject showed an abnormally low fMRI activity value, and this outlier trial was removed from all subsequent analyses.
Two clusters, one in the frontal cortex, which included the IFJ, and one in the IPS and adjacent cortex, which included areas IPS1–IPS4, exhibited univariate fMRI activity that was significantly correlated with decoding accuracies in occipitotemporal cortex for selectively attended stimuli (voxel-level uncorrected p < 0.001; cluster-level FWE corrected p < 0.05; Fig. 8a). Anatomical definitions were as follows: FO (Neubert et al., 2013) and IPS1–IPS4 (Mars et al., 2011).
Figure 8.
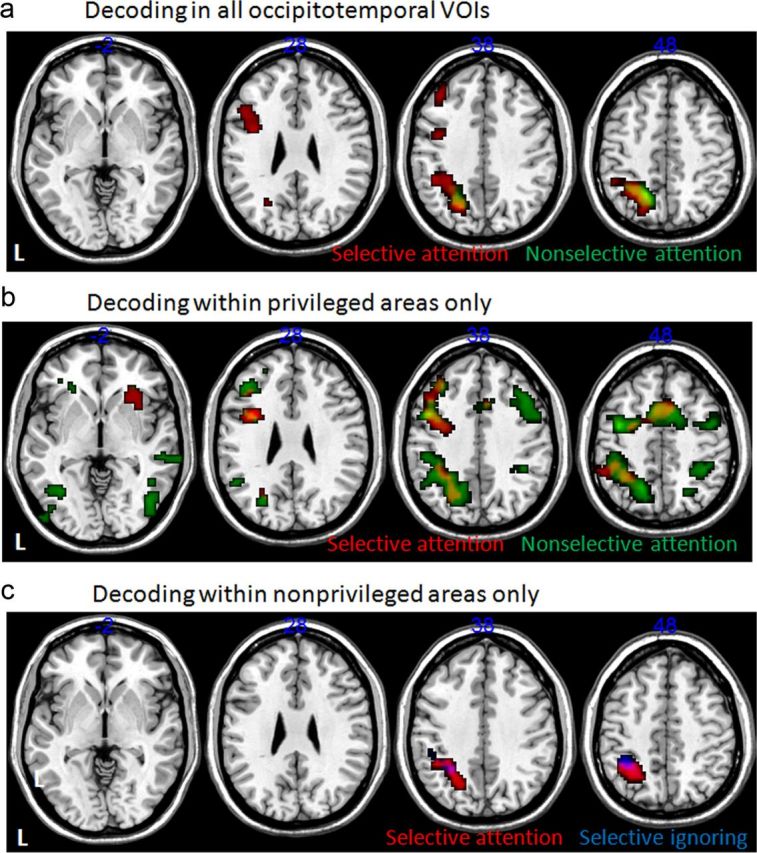
Correlations between occipitotemporal decoding ability and whole-brain fMRI activity. Areas showing a significant effect (uncorrected voxel-level p < 0.001, FWE-corrected cluster level p < 0.05) in a voxel-based one-sample t test across all subjects. Input images were contrast values reflecting the partial correlation between trial-by-trial decoding probability for selectively ignored (blue), selectively attended (red), and nonselectively attended (green) trials and the fMRI signal in that voxel. All effects shown are positive (correlations >0); there were no significant negative correlations. The different rows reflect different occipitotemporal areas that were used to calculate decoding probabilities: a, decoding based on all occipitotemporal areas; b, decoding performed within the occipitotemporal area thought to be privileged for the category of interest (privileged area regressors; see Materials and Methods); c, decoding within the nonprivileged regions (nonprivileged area regressors; see Materials and Methods).
Next, we tested the possibility that frontal and parietal regions might show different correlations with occipitotemporal multivariate patterns depending on the identity of the occipitotemporal areas in which decoding was performed. First, we examined the correlation when the multivariate patterns were restricted to the regions privileged for the category of stimulus. In this analysis, the multivariate pattern that was regressed against the univariate BOLD signal was drawn from the FFA on trials during which subjects selectively attended to faces, from the PPA on trials during which subjects selectively attended to houses, and from the EBA on trials during which subjects selectively attended to bodies. Similar analyses were performed for selectively ignored and nonselectively attended trial types. For the sake of brevity, we subsequently refer to this analysis type as the “privileged area analysis” or using the term “privileged area regressor.”
Second, we examined the correlations with multivariate patterns outside the regions privileged for the stimulus category. In this analysis, the multivariate pattern that was regressed against the univariate BOLD signal was drawn from all occipitotemporal VOIs apart from the FFA on trials during which subjects selectively attended to faces, from all occipitotemporal VOIs apart from the PPA on trials during which subjects selectively attended to houses, and from all occipitotemporal VOIs apart from the EBA on trials during which subjects selectively attended to bodies. Again, similar analyses were performed for selectively ignored and nonselectively attended trial types. We subsequently refer to this analysis type as the “nonprivileged area analysis” or using the term “nonprivileged area regressor.”
The privileged area analysis, using pattern strength from areas privileged for the particular stimulus type, revealed similar areas for selectively attended stimuli as mentioned before but now the right FO was also involved (Fig. 8b, red). For nonselectively attended stimuli, the analysis identified a more extensive set of frontal and parietal areas (Fig. 8b, green). Occipitotemporal pattern strength for nonselectively attended stimuli correlated with univariate BOLD signal strength in the pre-SMA and PMd, as well as areas overlapping with those found for the selectively attended stimuli: the IFJ and adjacent 6v area and LPFC (including inferior frontal sulcus, 9/46v, 9/46d, 8B). Again there was also correlated activity in areas IPS1–IPS4 in the IPS. In the nonprivileged area analysis that regressed pattern strength in nonprivileged occipitotemporal cortex against the univariate BOLD signal, we only found correlated activity in the IPS for both selectively attended and selectively ignored stimuli (Fig. 8c). Anatomical definitions were as follows: FO (Neubert et al., 2013); pre-SMA (Johansen-Berg et al., 2004; Sallet et al., 2013); PMd (Tomassini et al., 2007); IFJ, 6v, and LPFC (including inferior frontal sulcus, 9/46v, 9/46d, 8B; Neubert et al., 2013; Sallet et al., 2013); and IPS1–IPS4 (Mars et al., 2011).
Because the result for the nonselective contrast in the privileged area analysis (Fig. 8b, green areas) included more bilateral areas and overlapped greatly with the results for the selective contrast (Fig. 8b, red areas, overlap in yellow), we selected the VOIs based on the local maxima of the nonselective contrast for our main analysis (although we show below in a secondary analysis that similar results are obtained if the VOIs are selected on the basis of the selective contrast).
We then extracted, for each of these frontal and parietal areas (Table 1, column 1), the mean contrast value reflecting the partial correlation between the fMRI signal and the regressor for occipitotemporal decoding during selective attention, selective ignoring, and nonselective attention conditions, and we did this separately for when correlations were based on multivariate patterns in categorically privileged and nonprivileged regions.
We used a repeated-measures ANOVA with contrast value (partial correlation) as the dependent variable and four independent within-subjects variables: (1) occipitotemporal regressor type (two levels: privileged and nonprivileged, indicating from which occipitotemporal areas were decoded); (2) attention condition (three levels: selective attention, selective ignoring, and nonselective attention); (3) area [six levels, one for each bilaterally defined VOI based on the nonselective attention contrast (Table 1, first column): IFJ, LPFC, PMd, pre-SMA, aIPS, and pIPS]; and (4) hemisphere (two levels: left and right, reflecting the laterality of the VOI).
We found a stronger correlation between occipitotemporal multivariate pattern strength and frontal and parietal univariate BOLD signal when the multivariate data were drawn from categorically privileged regions (main effect of occipitotemporal regressor type, p = 0.021) and left-hemispheric regions (main effect of hemisphere, p = 0.00021). There was also a significant difference between areas (main effect of area, p = 0.027) and an interaction between area and hemisphere (interaction effect, p = 0.0042). Correlation contrast values for the different areas in the different conditions are plotted in Figure 9a.
Figure 9.

Correlations between occipitotemporal decoding ability and frontal and parietal fMRI activity. Plotted are the contrast values reflecting the partial correlation between trial-by-trial decoding probability for selectively ignored (s ign), selectively attended (s att), and nonselectively attended (ns att) trials and the fMRI signal in a given VOI (for exact VOI coordinates, see Table 1). The top row shows the results when decoding was performed within the occipitotemporal area thought to be privileged for the category of interest (privileged area regressors; see Materials and Methods); the bottom row shows results when decoding within the remaining nonprivileged regions (nonprivileged area regressors; see Materials and Methods). a, Frontal and parietal areas defined based on the nonselective attend contrast (Fig. 8b, green). Areas are color coded and plotted separately for the left and right hemispheres. b, Right FO VOI as defined based on the selective attend contrast (Fig. 8b, red).
Given the higher value and greater consistency of patterns across regions in the privileged regressor contrast, i.e., when decoding was done in the privileged occipitotemporal area, we next explored this contrast further by a reduced version of the ANOVA with three factors (attention condition, area, and hemisphere). Consistent with the previous analysis, we retained significant main effects of area (p = 0.0034) and hemisphere (p = 0.0034), as well as the interaction between these two factors (p = 0.013). However, the main effect of attention condition was now trend-level significant (p = 0.052), and additional analysis showed that pattern decoding correlated more strongly with univariate frontal and parietal activity in the nonselective compared with the selective attention condition (p = 0.0051), with no difference between the selective attention and selective ignoring conditions (p = 0.93). Additional post hoc planned comparisons indicated that parietal areas had overall lower correlations compared with frontal areas (p = 0.0048). If a similar repeated-measures ANOVA was performed on the correlations with the nonprivileged area regressors, no significant main effect of attention condition, or interactions involving the attention condition, were present (p = 0.53), only a main effect of hemisphere (left > right, p = 0.00095), which interacted with area (p = 0.010).
In a secondary analysis, to test whether the pattern of results was a consequence of selection bias—because the VOIs had been picked based on local maxima for the nonselective contrast—we repeated the same analysis for VOIs defined on the basis of the nearest local maxima in the selective contrast (Table 1, second column). We used a repeated-measures ANOVA with contrast value (partial correlation) as the dependent variable and two independent within-subjects variables: attention condition (three levels: selective attention, selective ignoring, and nonselective attention) and area (seven levels: one for each unilateral VOI in Table 1). Because there were fewer areas that were significantly activated in this contrast and because most of them were in the left hemisphere, we did not consider the factor of hemisphere in this analysis. However, the factor of area now had seven levels (left LPFC, left IFJ, left PMd, left pre-SMA, right pre-SMA, left aIPS, and left pIPS). We found a significant main effect of area (p = 0.00023) and attention condition (p = 0.025). Additional analysis showed correlations were higher in frontal compared with parietal areas (p = 0.011) as well as in the nonselective compared with the selective attention condition (p = 0.031), with no difference between selective attention and selective ignoring conditions (p = 0.46). This replicates the results obtained previously based on VOIs defined on nonselective regions.
The one frontal region that differed from this general pattern was the right FO. Univariate activity in this relatively ventral part of FO was only correlated with occipitotemporal pattern strength in the selective attention condition (Fig. 8b). For this area, we used a repeated-measures ANOVA with contrast value (partial correlation) as the dependent variable and two independent within-subjects variables: occipitotemporal regressor type (two levels: privileged and nonprivileged, indicating from which occipitotemporal areas were decoded) and attention condition (three levels: selective attention, selective ignoring, and nonselective attention).
We found a stronger correlation between occipitotemporal multivariate pattern strength and frontal and parietal univariate BOLD signal strength when the multivariate data were drawn from categorically privileged regions (main effect of occipitotemporal regressor type, p = 0.013) and a significant main effect for attention condition (p = 0.025). Additional analysis showed that the correlation between occipitotemporal multivariate patterns and FO univariate activity was significantly stronger in the selective attention condition compared with the selective ignore condition (p = 0.023) and to the nonselective condition (p = 0.016).
In summary, if the frontal and parietal areas were only interacting with occipitotemporal cortex when subjects attend exclusively to a single item (when occipitotemporal patterns are strongest), then correlation between occipitotemporal multivariate pattern strength and frontal cortical univariate signal strength should have disappeared or at least reduced in the nonselective attention condition. Instead, however, there was in general a small but significant increase in coupling strength on nonselective attention trials. If frontal and parietal areas are exerting top-down control over occipitotemporal cortex, then they may be doing so in a similar manner (at least in as far as we can measure using the BOLD signal) regardless of whether there is a unique focus or multiple foci for attention and, if anything, the correlations between frontal and parietal cortex and occipitotemporal cortex become stronger when the trial is more demanding and selective attention is not possible.
The implications of the correlations seen between frontal and parietal activity and occipitotemporal pattern strength in the selective ignore condition are also important to consider. We showed previously that the occipitotemporal patterns associated with stimuli that were to be ignored become weaker even than those associated with the absent category that was not even presented to subjects at the beginning of the trial. If the same frontal and parietal areas exert a top-down inhibitory influence over representations that are to-be-ignored, then the occipitotemporal multivariate–frontal univariate correlation should become negative. In other words, increased activity in the putative frontal inhibitory area should correlate with decreased ability to classify inhibited representations in visual cortex. However, there was no evidence of negative correlations; if anything, most frontal and parietal areas showed positive correlations. This suggests that instead the frontal and parietal interactions are still sustaining occipitotemporal representations, even when those representations should be ignored. In other words, we found no evidence that the frontal and parietal areas exerted an active process of inhibition over occipitotemporal patterns related to the ignored stimulus categories.
Finally, the right FO region differed from this general pattern in two respects. First, the occipitotemporal multivariate–FO univariate correlation was significantly stronger in the selective attention condition than the selective ignore condition, and, unlike other frontal and parietal areas, it was not stronger (in fact it was significantly weaker) in the nonselective condition than in the selective attention condition. Second, there was no evidence that right FO was significantly or consistently correlated with occipitotemporal pattern strength when objects were to be ignored; across the group of subjects, there was no consistency in the sign of the correlation between univariate signal of the FO and occipitotemporal multivariate activity in the selective ignore condition (average value was ∼0; Fig. 9b).
Stimulus-related decoding beyond the occipitotemporal cortex and the decoding of response selection and attentional context
Finally, we examined whether we could decode stimulus and/or task-related information from the right FO and, in two separate analyses, from the other frontal and the parietal areas mentioned above (using the VOIs defined on the nonselective contrast). Within each of these sets of VOIs (frontal cortex including IFJ, LPFC, PMd, and pre-SMA; parietal cortex including aIPS and pIPS, and FO), we averaged decoding across all areas to improve the signal-to-noise ratio and compared this average decoding with chance level by means of a one-sample t test (Fig. 10). To confirm that this averaging procedure was valid, we performed a repeated-measures ANOVA with area and hemisphere as within-subjects factors within each of our three sets of areas. There was no significant main effect of area, hemisphere, or interaction between area and hemisphere (p > 0.05).
Figure 10.

Decoding in frontal (fron) and parietal (par) areas. Mean ± SEM percentage of correctly classified trials across subjects for a leave-one-trial-out cross-validation approach. The dotted line denotes chance-level performance. *p < 0.05, performance significantly different from chance (one-sample t test). Left, Decoding attended stimulus category (face vs body vs house). Middle, Decoding trial type: selectively versus nonselectively attended trials. Right, Decoding response type: match (attended stimulus present in triplet array) versus no-match (attended stimulus absent). RFO, Right FO.
None of the VOI sets were able to decode the identity of the attended category (face vs body vs house) based on the visuoperceptual training set. This confirms our previous voxel-based finding that this ability seems to be localized to occipitotemporal cortex (Fig. 5). However, when we attempted to decode the identity of the attended category based on a training set of attention trials (leave-one-out approach) instead of visuoperceptual task trials, we did find evidence of significant encoding in parietal cortex. In tandem, these two results suggest that parietal cortex encodes information about stimuli within a particular attentional context even if it does not encode purely visual stimulus characteristics per se.
Frontal and parietal VOIs showed above-chance decoding of the attentional condition used on each trial (selective vs nonselective trials) and the presence of the attended stimulus in the triplet array (match vs no-match), which is reflected in the subject's response (index vs middle finger button press). The latter effect of above-chance encoding of match versus no-match trials was also present in the right FO. Because there was a trend-level significant main effect for area (p = 0.057) in the repeated-measures ANOVA for the frontal regions in the match versus no-match analysis, we also examined performance relative to chance for each of these four frontal areas separately. Only pre-SMA and PMd showed above-chance decoding (p = 0.021 and p = 0.026, respectively).
In summary, in frontal and parietal areas in which univariate activity was linked to occipitotemporal decoding, we were able to decode both stimulus and task-related information. This confirms our hypothesis from the previous section (see above, Identification of top-down control areas beyond occipitotemporal cortex) that these areas are involved in top-down control over, or the reading out of, occipitotemporal processing.
Discussion
MVPA can predict when a stimulus is the focus in one condition (attending) after training a classifier when it is the focus in another condition (passive viewing), even when focusing on small brain regions, such as the FFA, EBA, and PPA, with relative specialization for faces, bodies, and places, respectively. Each area contains activity patterns specifying which of the other two object categories is presented, selectively attended, or jointly attended (Figs. 3, 4). This finding complements and extends recent studies (Cichy et al., 2012, 2013) showing that multivariate patterns within category-specific areas contain information about both preferred and nonpreferred categories during visual perception and imagery.
Such findings support the notion that object representations are distributed throughout visual cortex (Haxby et al., 2001) rather than limited to category-specific regions (Spiridon and Kanwisher, 2002). However, transcranial magnetic stimulation (TMS)-induced category-specific behavioral impairments suggest that some occipitotemporal regions have privileged roles (Pitcher et al., 2009). Activity relating to privileged categories may be attended in a different manner so that it exerts more influence on perceptual judgment or behavior.
To examine these possibilities and to assess more generally how occipitotemporal cortex interacts with brain areas that might exert attentional control over it, we regressed individual trial multivariate pattern strength estimates against whole-brain univariate signals. Trial-to-trial variation in occipitotemporal pattern strength was associated with trial-to-trial variation in intraparietal and frontal activity (pre-SMA, PMd, IFJ, LPFC, and FO; Fig. 8). Furthermore, representations belonging to the preferred category of an occipitotemporal area are privileged. First, patterns encoding stimuli belonging to the privileged category of an occipitotemporal region correlated more strongly with frontal and parietal cortex than did other patterns. Second, these correlations with privileged category patterns exhibited consistent differences as a function of attentional condition, but effects were not so consistent for other patterns (Fig. 9). Third, attentional modulation of occipitotemporal pattern strength was greater for stimuli belonging to the category for which areas are privileged (Fig. 6). These findings support an intermediate interpretation (O'Toole et al., 2005) between objects being coded as fully distributed (Haxby et al., 2001) or fully modular representations (Spiridon and Kanwisher, 2002).
Whether frontal activity reflects the identity of the focus of attention has been unclear (Hou and Liu, 2012; Kuhl et al., 2012a,b; Riggall and Postle, 2012). Some previous studies have trained and tested classifiers on the same or similar high-level attention-demanding conditions. In contrast, we also trained classifiers on a visuoperceptual task in which single stimuli were presented in isolation, thereby minimizing attentional control and its contaminating influence on multivariate patterns. Despite the presence of correlations between occipitotemporal multivariate pattern strength and frontal activity, we could not decode which stimulus was attended from frontal areas (Fig. 10). If frontal areas exert top-down control over occipitotemporal areas, then they do not represent the same information over again in the same code. Frontal activity may not, therefore, reflect the categories per se but also other features of the task context.
The situation is different in parietal cortex; attended stimulus identity was decoded from intraparietal activity but only when the classifier was trained on other attention trials and not when it was trained on the visuoperceptual task. This suggests that parietal cortex encodes information about stimuli within a particular attentional context even if it does not encode visual stimulus characteristics per se. Whereas Christophel et al. (2012) found parietal MVPA evidence of encoding of the attended stimulus identity (artificial color stimuli) during the delay period, Riggall and Postle (2012) and Emrich et al. (2013) (decoding motion direction) did not, suggesting that stimulus type may play a role. Linden et al. (2012), using a delayed discrimination paradigm with stimulus categories similar to ours, showed parietal category-specific decoding during encoding, early delay, and retrieval. Similar interpretations can be made of single neurons from these areas (Freedman and Assad, 2006; Meyers et al., 2008; Swaminathan and Freedman, 2012). Our results predict that category encoding in prefrontal neurons interacts more strongly with encoding of other task features than in parietal neurons.
Correlations between occipitotemporal multivariate pattern strength and frontal and parietal activity may not only reflect top-down control over occipitotemporal cortex but also reading out of information from it to guide behavior. Both possibilities are not mutually exclusive, and regions may differ in the degree to which their activity reflects each process. We demonstrated that it was possible to decode whether subjects made match or non-match responses from frontal and parietal multivariate activity. Frontal effects were particularly strong in PMd and pre-SMA, which have been linked to using and changing rules to guide response selection (Bunge et al., 2005; Rushworth, 2008). Their activation in coordination with occipitotemporal pattern strength may reflect the use of occipitotemporal information to guide behavior. In contrast, the LPFC may encode not the response but the sensorimotor rule used to guide the response (Woolgar et al., 2011; Reverberi et al., 2012; Riggall and Postle, 2012).
However, large lesions of ventral frontal cortex do not just disrupt conditional rule use. They also affect how information relevant for guiding responses is identified (Rushworth et al., 2005). Several frontal and parietal areas had multivariate activity distinguishing selective from nonselective attention trials, but FO differed from other regions because its correlation with occipitotemporal pattern strength was higher in the selective compared with the nonselective attention condition. Also, unlike other areas, it had no positive correlation with occipitotemporal pattern strength during selective ignoring. Moreover, FO univariate activity changes depending on attentional instructions, FO TMS disrupts attentional modulation in occipitotemporal cortex, and FO activity variation is related to variation in behavioral improvement from selective attention (Higo et al., 2011). The FO is cytoartchitectonically distinct from the LPFC (Amunts et al., 2010) and corresponds to anterior insula in macaques (Neubert et al., 2013). Little is known about its contribution to higher-level cognition at a neurophysiological level.
The finding that, unlike FO, other frontal and parietal areas increased their activity on nonselective compared with selective trials accords with the general conclusion that frontal and parietal activity increases with task difficulty (Nobre et al., 2003, Duncan and Owen, 2000, Lepsien et al., 2011). This agrees with findings by Kuhl et al. (2011, 2012a). who found higher frontal and parietal activity during memory retrieval trials in which subjects retrieved two memorized stimuli (also associated with lower classifier performance) versus nonconflicting trials when only one stimulus association was retrieved.
There has been interest in the possibility that prefrontal cortex exerts inhibitory control over both behavior and activity in other brain regions (Anderson et al., 2004; Gazzaley et al., 2005; Tsushima et al., 2006; Depue et al., 2007; Higo et al., 2011). We found evidence for decreases in occipitotemporal pattern strength associated with to-be-ignored stimuli. It is possible that the decrease in multivariate pattern strength is linked to increased alpha-band power that has been associated with unattended stimuli (Foxe and Snyder, 2011). However, if frontal cortex is actively causing these pattern strength decrements, then we expect the correlation between pattern strength and frontal activity to switch from positive to negative in the selective ignore condition with higher inhibitory signals causing reduced pattern decoding, but this was not seen: correlations, with the exception of FO, remained positive. In other words, the degree to which occipitotemporal patterns for the to-be-ignored stimulus category were sustained, rather than diminished, was directly related to frontal activity. We were unable to identify any correlation pattern consistent with the operation of an active inhibitory process.
Although the frontal cortex may exert a causal influence over posterior brain activity (Knight, 1994; Higo et al., 2011; Zanto et al., 2011), the current results suggest that it may facilitate relevant representations but may not directly inhibit irrelevant ones (Egner and Hirsch, 2005). Although often overlooked, influential models of attention selection, such as the biased competition model (Desimone and Duncan, 1995), similarly do not specifically propose active top-down inhibition. Top-down signals may bias processing toward some stimuli, but the competitive processes between representations of different stimuli occur locally in the cortex representing those stimuli. Our results reveal colocalized distributed representations of different stimulus classes in occipitotemporal cortex, and inhibitory interactions may occur between these representations.
We argued above that some frontal regions, such as PMd, may use occipitotemporal activity to guide behavior. If so, then the presence of positive correlations between to-be-ignored occipitotemporal patterns and frontal activity suggests that irrelevant information is not gated out of frontal cortex but instead continues to interact with frontal cortex and may influence its activity and the subject's behavior.
The absence of negative correlations between frontal and parietal activity and occipitotemporal pattern strength cannot be attributed to absence of decrements in the strength of the to-be-ignored pattern; occipitotemporal pattern strength corresponding to the to-be-ignored stimulus category fell, on average, below that of patterns associated with the categories that were not present on a given trial (Fig. 7a). Moreover, there was clearly sufficient parametric variation in the strength of the to-be-ignored pattern for the analysis to identify positively correlated regions of frontal activity. Nevertheless, it would be interesting to test the generality of our conclusions in other attentional paradigms (Seidl et al., 2012).
Footnotes
This work was supported by the Medical Research Council, the Wellcome Trust, and the National Institute for Health Research Oxford Biomedical Research Centre. N.N. is a postdoctoral fellow of the Research Foundation Flanders.
The authors declare no competing financial interests.
This is an open-access article distributed under the terms of the Creative Commons CC-BY license: http://creativecommons.org/licenses/by/3.0.
References
- Amunts K, Lenzen M, Friederici AD, Schleicher A, Morosan P, Palomero-Gallagher N, Zilles K. Broca's region: novel organizational principles and multiple receptor mapping. PLoS Biol. 2010;8:e1000489. doi: 10.1371/journal.pbio.1000489. pii. [DOI] [PMC free article] [PubMed] [Google Scholar]
- Anderson MC, Ochsner KN, Kuhl B, Cooper J, Robertson E, Gabrieli SW, Glover GH, Gabrieli JD. Neural systems underlying the suppression of unwanted memories. Science. 2004;303:232–235. doi: 10.1126/science.1089504. [DOI] [PubMed] [Google Scholar]
- Bunge SA, Wallis JD, Parker A, Brass M, Crone EA, Hoshi E, Sakai K. Neural circuitry underlying rule use in humans and nonhuman primates. J Neurosci. 2005;25:10347–10350. doi: 10.1523/JNEUROSCI.2937-05.2005. [DOI] [PMC free article] [PubMed] [Google Scholar]
- Chen AJ, Britton M, Turner GR, Vytlacil J, Thompson TW, D'Esposito M. Goal-directed attention alters the tuning of object-based representations in extrastriate cortex. Front Hum Neurosci. 2012;6:187. doi: 10.3389/fnhum.2012.00187. [DOI] [PMC free article] [PubMed] [Google Scholar]
- Christophel TB, Hebart MN, Haynes JD. Decoding the contents of visual short-term memory from human visual and parietal cortex. J Neurosci. 2012;32:12983–12989. doi: 10.1523/JNEUROSCI.0184-12.2012. [DOI] [PMC free article] [PubMed] [Google Scholar]
- Cichy RM, Heinzle J, Haynes JD. Imagery and perception share cortical representations of content and location. Cereb Cortex. 2012;22:372–380. doi: 10.1093/cercor/bhr106. [DOI] [PubMed] [Google Scholar]
- Cichy RM, Sterzer P, Heinzle J, Elliott LT, Ramirez F, Haynes JD. Probing principles of large-scale object representation: category preference and location encoding. Hum Brain Mapp. 2013;34:1636–1651. doi: 10.1002/hbm.22020. [DOI] [PMC free article] [PubMed] [Google Scholar]
- Corbetta M, Miezin FM, Dobmeyer S, Shulman GL, Petersen SE. Attentional modulation of neural processing of shape, color, and velocity in humans. Science. 1990;248:1556–1559. doi: 10.1126/science.2360050. [DOI] [PubMed] [Google Scholar]
- Depue BE, Curran T, Banich MT. Prefrontal regions orchestrate suppression of emotional memories via a two-phase process. Science. 2007;317:215–219. doi: 10.1126/science.1139560. [DOI] [PubMed] [Google Scholar]
- Desimone R, Duncan J. Neural mechanisms of selective visual attention. Annu Rev Neurosci. 1995;18:193–222. doi: 10.1146/annurev.ne.18.030195.001205. [DOI] [PubMed] [Google Scholar]
- Dosenbach NU, Fair DA, Miezin FM, Cohen AL, Wenger KK, Dosenbach RA, Fox MD, Snyder AZ, Vincent JL, Raichle ME, Schlaggar BL, Petersen SE. Distinct brain networks for adaptive and stable task control in humans. Proc Natl Acad Sci U S A. 2007;104:11073–11078. doi: 10.1073/pnas.0704320104. [DOI] [PMC free article] [PubMed] [Google Scholar]
- Duncan J, Owen AM. Common regions of the human frontal lobe recruited by diverse cognitive demands. Trends Neurosci. 2000;10:475–483. doi: 10.1016/S0166-2236(00)01633-7. [DOI] [PubMed] [Google Scholar]
- Egner T, Hirsch J. Cognitive control mechanisms resolve conflict through cortical amplification of task-relevant information. Nat Neurosci. 2005;8:1784–1790. doi: 10.1038/nn1594. [DOI] [PubMed] [Google Scholar]
- Emrich SM, Riggall AC, Larocque JJ, Postle BR. Distributed patterns of activity in sensory cortex reflect the precision of multiple items maintained in visual short-term memory. J Neurosci. 2013;33:6516–6523. doi: 10.1523/JNEUROSCI.5732-12.2013. [DOI] [PMC free article] [PubMed] [Google Scholar]
- Foxe JJ, Snyder AC. The role of alpha-band brain oscillations as a sensory suppression mechanism during selective attention. Front Psychol. 2011;2:154. doi: 10.3389/fpsyg.2011.00154. [DOI] [PMC free article] [PubMed] [Google Scholar]
- Freedman DJ, Assad JA. Experience-dependent representation of visual categories in parietal cortex. Nature. 2006;443:85–88. doi: 10.1038/nature05078. [DOI] [PubMed] [Google Scholar]
- Gazzaley A, Nobre AC. Top-down modulation: bridging selective attention and working memory. Trends Cogn Sci. 2012;16:129–135. doi: 10.1016/j.tics.2011.11.014. [DOI] [PMC free article] [PubMed] [Google Scholar]
- Gazzaley A, Cooney JW, Rissman J, D'Esposito M. Top-down suppression deficit underlies working memory impairment in normal aging. Nat Neurosci. 2005;8:1298–1300. doi: 10.1038/nn1543. [DOI] [PubMed] [Google Scholar]
- Gazzaley A, Rissman J, Cooney J, Rutman A, Seibert T, Clapp W, D'Esposito M. Functional interactions between prefrontal and visual association cortex contribute to top-down modulation of visual processing. Cereb Cortex. 2007;17(Suppl 1):i125–i135. doi: 10.1093/cercor/bhm113. [DOI] [PMC free article] [PubMed] [Google Scholar]
- Griffin IC, Nobre AC. Orienting attention to locations in internal representations. J Cogn Neurosci. 2003;15:1176–1194. doi: 10.1162/089892903322598139. [DOI] [PubMed] [Google Scholar]
- Haxby JV, Gobbini MI, Furey ML, Ishai A, Schouten JL, Pietrini P. Distributed and overlapping representations of faces and objects in ventral temporal cortex. Science. 2001;293:2425–2430. doi: 10.1126/science.1063736. [DOI] [PubMed] [Google Scholar]
- Higo T, Mars RB, Boorman ED, Buch ER, Rushworth MF. Distributed and causal influence of frontal operculum in task control. Proc Natl Acad Sci U S A. 2011;108:4230–4235. doi: 10.1073/pnas.1013361108. [DOI] [PMC free article] [PubMed] [Google Scholar]
- Hou Y, Liu T. Neural correlates of object-based attentional selection in human cortex. Neuropsychologia. 2012;50:2916–2925. doi: 10.1016/j.neuropsychologia.2012.08.022. [DOI] [PMC free article] [PubMed] [Google Scholar]
- Johansen-Berg H, Behrens TE, Robson MD, Drobnjak I, Rushworth MF, Brady JM, Smith SM, Higham DJ, Matthews PM. Changes in connectivity profiles define functionally distinct regions in human medial frontal cortex. Proc Natl Acad Sci U S A. 2004;101:13335–13340. doi: 10.1073/pnas.0403743101. [DOI] [PMC free article] [PubMed] [Google Scholar]
- Knight RT. Attention regulation and human prefrontal cortex. In: Thierry AM, Glowinski J, Goldman-Rakic PS, Christen Y, editors. Motor and cognitive functions of the prefrontal cortex. Berlin: Springer; 1994. pp. 161–173. [Google Scholar]
- Kriegeskorte N, Goebel R, Bandettini P. Information-based functional brain mapping. Proc Natl Acad Sci U S A. 2006;103:3863–3868. doi: 10.1073/pnas.0600244103. [DOI] [PMC free article] [PubMed] [Google Scholar]
- Kuhl BA, Rissman J, Chun MM, Wagner AD. Fidelity of neural reactivation reveals competition between memories. Proc Natl Acad Sci U S A. 2011;108:5903–5908. doi: 10.1073/pnas.1016939108. [DOI] [PMC free article] [PubMed] [Google Scholar]
- Kuhl BA, Bainbridge WA, Chun MM. Neural reactivation reveals mechanisms for updating memory. J Neurosci. 2012a;32:3453–3461. doi: 10.1523/JNEUROSCI.5846-11.2012. [DOI] [PMC free article] [PubMed] [Google Scholar]
- Kuhl BA, Rissman J, Wagner AD. Multi-voxel patterns of visual category representation during episodic encoding are predictive of subsequent memory. Neuropsychologia. 2012b;50:458–469. doi: 10.1016/j.neuropsychologia.2011.09.002. [DOI] [PMC free article] [PubMed] [Google Scholar]
- LaRocque JJ, Lewis-Peacock JA, Drysdale AT, Oberauer K, Postle BR. Decoding attended information in short-term memory: an EEG study. J Cogn Neurosci. 2013;25:127–142. doi: 10.1162/jocn_a_00305. [DOI] [PMC free article] [PubMed] [Google Scholar]
- Lepsien J, Nobre AC. Attentional modulation of object representations in working memory. Cereb Cortex. 2007;17:2072–2083. doi: 10.1093/cercor/bhl116. [DOI] [PubMed] [Google Scholar]
- Lepsien J, Griffin IC, Devlin JT, Nobre AC. Directing spatial attention in mental representations: interactions between attentional orienting and working-memory load. Neuroimage. 2005;26:733–743. doi: 10.1016/j.neuroimage.2005.02.026. [DOI] [PubMed] [Google Scholar]
- Lepsien J, Thornton I, Nobre AC. Modulation of working-memory maintenance by directed attention. Neuropsychologia. 2011;49:1569–1577. doi: 10.1016/j.neuropsychologia.2011.03.011. [DOI] [PubMed] [Google Scholar]
- Lewis-Peacock JA, Drysdale AT, Oberauer K, Postle BR. Neural evidence for a distinction between short-term memory and the focus of attention. J Cogn Neurosci. 2012a;24:61–79. doi: 10.1162/jocn_a_00140. [DOI] [PMC free article] [PubMed] [Google Scholar]
- Lewis-Peacock JA, Postle BR. Decoding the internal focus of attention. Neuropsychologia. 2012b;50:470–478. doi: 10.1016/j.neuropsychologia.2011.11.006. [DOI] [PMC free article] [PubMed] [Google Scholar]
- Linden DE, Oosterhof NN, Klein C, Downing PE. Mapping brain activation and information during category-specific visual working memory. J Neurophysiol. 2012;107:628–639. doi: 10.1152/jn.00105.2011. [DOI] [PMC free article] [PubMed] [Google Scholar]
- Mars RB, Jbabdi S, Sallet J, O'Reilly JX, Croxson PL, Olivier E, Noonan MP, Bergmann C, Mitchell AS, Baxter MG, Behrens TE, Johansen-Berg H, Tomassini V, Miller KL, Rushworth MF. Diffusion-weighted imaging tractography-based parcellation of the human parietal cortex and comparison with human and macaque resting-state functional connectivity. J Neurosci. 2011;31:4087–4100. doi: 10.1523/JNEUROSCI.5102-10.2011. [DOI] [PMC free article] [PubMed] [Google Scholar]
- Meyers EM, Freedman DJ, Kreiman G, Miller EK, Poggio T. Dynamic population coding of category information in inferior temporal and prefrontal cortex. J Neurophysiol. 2008;100:1407–1419. doi: 10.1152/jn.90248.2008. [DOI] [PMC free article] [PubMed] [Google Scholar]
- Minear M, Park DC. A lifespan database of adult facial stimuli. Behav Res Methods Instrum Comput. 2004;36:630–633. doi: 10.3758/BF03206543. [DOI] [PubMed] [Google Scholar]
- Neubert FX, Mars RB, Sallet J, Noonan MP, Rushworth MF. Comparison of cognitive control and language areas in human and monkey frontal cortex. 2013 doi: 10.1016/j.neuron.2013.11.012. In press. [DOI] [PubMed] [Google Scholar]
- Nobre AC, Stokes MG. Attention and short-term memory: crossroads. Neuropsychologia. 2011;49:1391–1392. doi: 10.1016/j.neuropsychologia.2011.04.014. [DOI] [PubMed] [Google Scholar]
- Nobre AC, Coull JT, Walsh V, Frith CD. Brain activations during visual search: contributions of search efficiency versus feature binding. Neuroimage. 2003;18:91–103. doi: 10.1006/nimg.2002.1329. [DOI] [PubMed] [Google Scholar]
- Norman KA, Polyn SM, Detre GJ, Haxby JV. Beyond mind-reading: multi-voxel pattern analysis of fMRI data. Trends Cogn Sci. 2006;10:424–430. doi: 10.1016/j.tics.2006.07.005. [DOI] [PubMed] [Google Scholar]
- O'Toole AJ, Jiang F, Abdi H, Haxby JV. Partially distributed representations of objects and faces in ventral temporal cortex. J Cogn Neurosci. 2005;17:580–590. doi: 10.1162/0898929053467550. [DOI] [PubMed] [Google Scholar]
- Parvizi J, Jacques C, Foster BL, Withoft N, Rangarajan V, Weiner KS, Grill-Spector K. Electrical stimulation of human fusiform face-selective regions distorts face perception. J Neurosci. 2012;32:14915–14920. doi: 10.1523/JNEUROSCI.2609-12.2012. [DOI] [PMC free article] [PubMed] [Google Scholar]
- Pitcher D, Charles L, Devlin JT, Walsh V, Duchaine B. Triple dissociation of faces, bodies, and objects in extrastriate cortex. Curr Biol. 2009;19:319–324. doi: 10.1016/j.cub.2009.01.007. [DOI] [PubMed] [Google Scholar]
- Reverberi C, Görgen K, Haynes JD. Distributed representations of rule identity and rule order in human frontal cortex and striatum. J Neurosci. 2012;32:17420–17430. doi: 10.1523/JNEUROSCI.2344-12.2012. [DOI] [PMC free article] [PubMed] [Google Scholar]
- Riggall AC, Postle BR. The relationship between working memory storage and elevated activity as measured with functional magnetic resonance imaging. J Neurosci. 2012;32:12990–12998. doi: 10.1523/JNEUROSCI.1892-12.2012. [DOI] [PMC free article] [PubMed] [Google Scholar]
- Rushworth MF. Intention, choice, and the medial frontal cortex. Ann N Y Acad Sci. 2008;1124:181–207. doi: 10.1196/annals.1440.014. [DOI] [PubMed] [Google Scholar]
- Rushworth MF, Buckley MJ, Gough PM, Alexander IH, Kyriazis D, McDonald KR, Passingham RE. Attentional selection and action selection in the ventral and orbital prefrontal cortex. J Neurosci. 2005;25:11628–11636. doi: 10.1523/JNEUROSCI.2765-05.2005. [DOI] [PMC free article] [PubMed] [Google Scholar]
- Sallet J, Mars RB, Noonan MP, Neubert FX, Jbabdi S, O'Reilly JX, Filippini N, Thomas AG, Rushworth MF. The organization of dorsal frontal cortex in humans and macaques. J Neurosci. 2013;33:12255–12274. doi: 10.1523/JNEUROSCI.5108-12.2013. [DOI] [PMC free article] [PubMed] [Google Scholar]
- Seidl KN, Peelen MV, Kastner S. Neural evidence for distracter suppression during visual search in real-world scenes. J Neurosci. 2012;32:11812–11819. doi: 10.1523/JNEUROSCI.1693-12.2012. [DOI] [PMC free article] [PubMed] [Google Scholar]
- Spiridon M, Kanwisher N. How distributed is visual category information in human occipito-temporal cortex? An fMRI study. Neuron. 2002;35:1157–1165. doi: 10.1016/S0896-6273(02)00877-2. [DOI] [PubMed] [Google Scholar]
- Stokes M, Thompson R, Nobre AC, Duncan J. Shape-specific preparatory activity mediates attention to targets in human visual cortex. Proc Natl Acad Sci U S A. 2009;106:19569–19574. doi: 10.1073/pnas.0905306106. [DOI] [PMC free article] [PubMed] [Google Scholar]
- Swaminathan SK, Freedman DJ. Preferential encoding of visual categories in parietal cortex compared with prefrontal cortex. Nat Neurosci. 2012;15:315–320. doi: 10.1038/nn.3016. [DOI] [PMC free article] [PubMed] [Google Scholar]
- Tomassini V, Jbabdi S, Klein JC, Behrens TE, Pozzilli C, Matthews PM, Rushworth MF, Johansen-Berg H. Diffusion-weighted imaging tractography-based parcellation of the human lateral premotor cortex identifies dorsal and ventral subregions with anatomical and functional specializations. J Neurosci. 2007;27:10259–10269. doi: 10.1523/JNEUROSCI.2144-07.2007. [DOI] [PMC free article] [PubMed] [Google Scholar]
- Tsushima Y, Sasaki Y, Watanabe T. Greater disruption due to failure of inhibitory control on an ambiguous distractor. Science. 2006;314:1786–1788. doi: 10.1126/science.1133197. [DOI] [PubMed] [Google Scholar]
- Woolgar A, Thompson R, Bor D, Duncan J. Multi-voxel coding of stimuli, rules, and responses in human frontoparietal cortex. Neuroimage. 2011;56:744–752. doi: 10.1016/j.neuroimage.2010.04.035. [DOI] [PubMed] [Google Scholar]
- Zanto TP, Rubens MT, Thangavel A, Gazzaley A. Causal role of the prefrontal cortex in top-down modulation of visual processing and working memory. Nat Neurosci. 2011;14:656–661. doi: 10.1038/nn.2773. [DOI] [PMC free article] [PubMed] [Google Scholar]