

Abstract
Dendritic spines are actin-rich compartments that protrude from the microtubule-rich dendritic shafts of principal neurons. Spines contain receptors and postsynaptic machinery for receiving the majority of glutamatergic inputs. Recent studies have shown that microtubules polymerize from dendritic shafts into spines and that signaling through synaptic NMDA receptors regulates this process. However, the mechanisms regulating microtubule dynamics in dendrites and spines remain unclear. Here we show that in hippocampal neurons from male and female mice, the majority of microtubules enter spines from highly localized sites at the base of spines. These entries occur in response to synapse-specific calcium transients that promote microtubule entry into active spines. We further document that spine calcium transients promote local actin polymerization, and that F-actin is both necessary and sufficient for microtubule entry. Finally, we show that drebrin, a protein known to mediate interactions between F-actin and microtubules, acts as a positive regulator of microtubule entry into spines. Together these results establish for the first time the essential mechanisms regulating microtubule entry into spines and contribute importantly to our understanding of the role of microtubules in synaptic function and plasticity.
Introduction
Microtubules (MTs) are dynamic polymers that are present throughout neuronal dendrites and axons (Stepanova et al., 2003). In the dendrites of principle neurons of the mammalian CNS, MTs frequently polymerize from their plus ends along the length of the dendrite in both anterograde and retrograde directions, and can polymerize directly into dendritic spines (Gu et al., 2008; Hu et al., 2008; Jaworski et al., 2009). MT entry into spines is associated with both spine enlargement (Merriam et al., 2011) and increased spine PSD-95 content (Hu et al., 2011), and may be directly involved in trafficking of molecular cargos to and from the synapse (Schapitz et al., 2010; Dent et al., 2011a). While MTs enter spines spontaneously, spine invasions are also positively regulated by membrane depolarization (Hu et al., 2008) and by stimulation of synaptic NMDA receptors (NMDARs; Merriam et al., 2011). In contrast, stimulation of both synaptic and extrasynaptic NMDARs by bath application of NMDA results in a loss of MT dynamics in dendrites and spines (Kapitein et al., 2011).
While these studies highlight the importance of neuronal activity as a regulator of MT dynamics in dendrites and spines, the mechanisms underlying activity-dependent polymerization of MTs into spines remain unclear. In the present study, we conducted live imaging experiments to test whether synaptic calcium influx, and subsequent remodeling of the spine filamentous actin (F-actin) network, regulates MT entry into spines. We found that MT-spine invasions are initiated locally and are calcium-dependent. Using a novel method to image local, synapse-specific calcium influx, we discovered that MTs preferentially target spines that exhibit more frequent calcium influx. We also observed greater increases in the F-actin content of more active spines. These increases in F-actin were apparent both in the spine head and at the base of the spine, where the spine neck meets the dendrite. To directly test the link between spine F-actin and MT entry, we coimaged reporters of F-actin and MTs and found that MTs preferentially target spines that are undergoing large increases in F-actin following synaptic activation. To confirm a role for F-actin in regulating MT entry into spines, we treated neurons with actin-targeting drugs and found that depolymerization of the F-actin network inhibits MT entry, whereas stabilizing F-actin enhances MT entry. Finally, we tested whether the F-actin binding protein drebrin, which is known to interact with the MT plus end binding protein EB3 (Geraldo et al., 2008), contributes to MT entry into spines. Drebrin A overexpression induced an increase in the frequency of MT entry into spines, whereas drebrin knockdown resulted in reduced MT entry. Together these findings support a model in which calcium influx through NMDARs triggers actin polymerization in spines that can extend into the base of the spine and shaft of the dendrite, promoting MT capture and polymerization into the spine through a drebrin-dependent interaction between MTs and F-actin. This study is the first to identify specific intracellular mechanisms regulating MT entry into spines.
Materials and Methods
Cell culture and transfection.
All mouse procedures were approved by the University of Wisconsin Committee on Animal Care and were in accordance with National Institutes of Health guidelines. Embryonic day (E) 15.5 hippocampal neuron cultures were prepared from Swiss Webster mice of either sex (Taconic) essentially as described previously (Viesselmann et al., 2011). Except for siRNA experiments (see below), dissociated neurons were resuspended in Nucleofector solution (Mouse Neuron Kit, Lonza), transfected with fluorescent reporter plasmids, and plated at low density (5 × 10³ neurons/cm2) on 1.0 mg/ml poly-d-lysine-coated (Sigma-Aldrich) glass coverslips adhered to the bottom of 35 mm plastic culture dishes that had a 15 mm hole drilled through the bottom of the chamber. Astroglial cultures from postnatal day (P) 1–P3 Swiss Webster mice were plated on a separate coverslip and placed directly over the neuronal culture in an inverted “sandwich” configuration to maintain robust low-density neuronal cultures (Kaech and Banker, 2006). Except for siRNA experiments (see below), neurons were imaged at 19–29 DIV.
Plasmids and reagents.
The following plasmids were used: EGFP-α-tubulin (human; Dent et al., 2007), EGFP, and DsRed2 (Clontech) in pCAX vectors; EB3-EGFP (gift from Niels Galjart, Erasmus Medical Center, Netherlands), mRuby-Lifeact (gift from Roland Wedlich-Soldner, Max Planck Institute; subcloned into pCAGG vector), calcium reporter GCaMP3 (Tian et al., 2009; Addgene), F-tractin-tdTomato (gift from Michael Schell, Uniformed Services University; Johnson and Schell, 2009), drebrin A-EGFP (Ivanov et al., 2009a), and EB3-tdTomato in N1 vectors. EB3-tdTomato was constructed by removing EB3 from the EB3-EGFP vector with PCR and inserting it into a tdTomato-N1 vector (Clontech). The EB3-tdTomato construct was subsequently fully verified by sequencing. All drugs were purchased from Sigma-Aldrich unless otherwise noted.
Live-cell total internal reflection fluorescence imaging.
The total internal reflection fluorescence (TIRF) microscope consisted of a Nikon TE2000E base with TIRF illuminator (Nikon), a Nikon 100×/1.49 numerical aperture Plan Apo TIRF objective, a Nikon perfect focus system for continuous automatic focusing of the sample during time-lapse imaging, a Nikon z-motor, a motorized x-y stage (Prior Scientific), a Lumen Pro200 fluorescent illumination system consisting of a 200 W metal halide lamp, a six-position excitation filter wheel and a fiber optic illuminator (Prior Scientific), a 10-position emission filter wheel, and an Evolve EMCCD camera (Photometrics). For TIRF illumination, two lasers were used: a 40 mW argon laser for GFP illumination, and a 10 mW solid-state 561 nm laser for DsRed2, mRuby, and tdTomato illumination (both Melles Griot). Laser power was attenuated to 6.25–12.5% with neutral density filters. The microscope was equipped with a dual-wavelength (EGFP/mCherry) dichroic mirror (z488/561rdc, Chroma Technology) for both TIRF and wide-field illumination. Wide-field fluorescent illumination was accomplished with the aid of a Lumen Pro 200 (Prior Scientific) containing an excitation filter wheel with GFP and mCherry excitation filters, a metal halide illuminator, and a liquid light guide. This system enabled us to collect two-color TIRF images in quick succession. All images were collected in MetaMorph imaging software (Molecular Devices). During time-lapse microscopy, neurons were kept at 37°C in an incubation chamber (Solent) custom-fitted to the microscope. For all fluorescent live-cell imaging except in the case of drug perfusion experiments (described below), the chamber was closed with a glass ring and coverslip sealed with silicone grease.
Image analysis.
Drift artifacts were corrected using the Image Stabilizer macro for ImageJ (Kang Li, http://www.cs.cmu.edu/∼kangli/code/Image_Stabilizer.html). This algorithm corrects for drift while maintaining perfect registration of multiple imaging channels. Otherwise, all images were compiled and measured in MetaMorph imaging software (Molecular Devices). Spines were defined as dendritic protrusions having length <5 μm and head-width >neck-width for protrusions with length >2 μm, except in Drebrin A-GFP over-expressing neurons.
Analysis of MT dynamics.
Images of EGFP-α-tubulin were acquired at 10 s intervals. Images of EB3 reporters were acquired at 1.2 s intervals for fast EB3 tracking experiments (Fig. 1) and 3–5 s intervals for all other experiments. MT-spine invasions were identified in MetaMorph (Molecular Devices) by visual inspection of tubulin or EB3 time-lapse sequences. Kymographs were created from lines drawn along the length of invaded spines and used to manually log the exact timing of invasions and compute invasion frequencies in Excel (Microsoft). Kymographs were also created from lines drawn along ∼10 μm segments of dendrite shaft (4–5 segments/neuron) to quantify the frequency of MT polymerization events in the shaft (EB3 comets/μm/h). For fast EB3 tracking (Fig. 1), we followed spine-entering EB3 comets backwards from their moment of spine entry to their first appearance in the field of view. For comparison, comets were selected that passed the same spines but did not enter. These nonentering comets were also followed backwards from the moment they passed the entered spine to their first appearance in the field of view. No comets originating from outside the field of view were used for this analysis.
Figure 1.
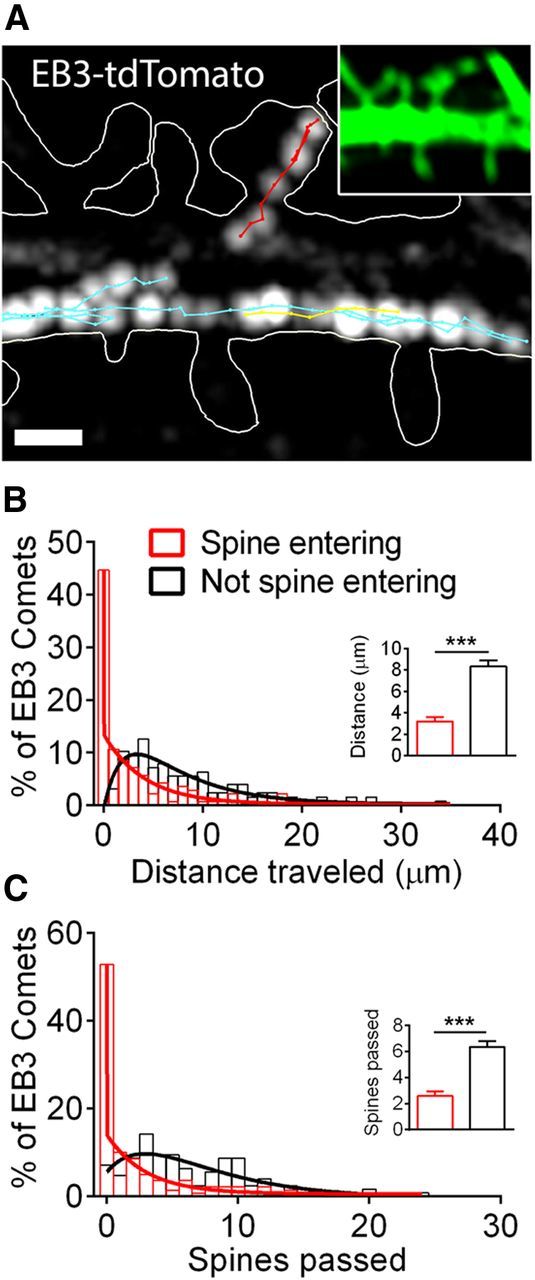
MTs polymerize into spines from local sites. A, Maximum projection of EB3-tdTomato comets across a period of 36 s. Images were acquired at 1.2 s intervals (2.4 s interval used for projection). White lines trace the neuron's shape in the TIRF plane (obtained with EGFP volume marker, shown in inset). Red lines track comets that entered a spine; blue and yellow lines track comets that remained in the dendrite shaft (blue, anterograde; yellow, retrograde movement). Lines were obtained by tracking comets at each frame (1.2 s intervals). Scale bar, 1 μm. B, C, Distribution of distances traversed (B) and numbers of spines passed (C) by EB3 comets that entered spines (red bars; n = 141 comets, 72 spines, 8 neurons from 2 preparations) versus comets that did not enter spines (black bars; n = 127 comets, 67 spines, 8 neurons from 2 preparations). Distributions for spine-entering EB3 comets were well described by a two-phase exponential decay function (red lines; R2 = 0.9898 for distance traversed, 0.9942 for number of spines passed). Distributions for EB3 comets that did not enter spines were well described by a biexponential (rise and decay) function (black lines; R2 = 0.8879 for distance traversed, 0.7346 for number of spines passed). Insets compare mean ± SEM of each distribution. t test, ***p < 0.001.
GCaMP3 imaging and analysis.
GCaMP3 images were acquired in streaming mode at 100–130 ms intervals for 10–13 s (100 frames/acquisition stream). GCaMP3 streams were acquired at a rate of one per minute and either F-tractin-tdTomato or EB3-tdTomato images were acquired during the 47–50 s gap between GCaMP3 stream acquisitions. Alternating between GCaMP3 and red fluorescent reporter acquisition in this way produced a record of calcium activity and either F-actin or MT dynamics across each 1 h experiment.
Spines targeted by EB3 were identified in MetaMorph by visual inspection of EB3-tdTomato time-lapse sequences and their maximum projections, and further confirmed with kymographs. To determine the frequency and amplitude of synaptic calcium events, a 12-pixel “+”-shaped ROI was placed (1) in the center of the head of the spine and (2) at or near the base of the spine in the adjacent dendrite. Background fluorescence was measured, as described above. The mean fluorescence intensity of all ROIs was obtained using the Region Measurements function in MetaMorph, and imported into Matlab for subsequent analysis. In Matlab, local background fluorescence was subtracted from the fluorescence intensity of each spine's ROI at every frame. Then, putative calcium transients were detected by identifying all frames in which the change in fluorescence from the previous frame (ΔF) was >3 SDs above the mean value of ΔF across all traces for that spine. Visual inspection confirmed that this criterion for detecting and confirming transients resulted in no false positives and few false negatives (i.e., few putative events were detected by eye that fell below the algorithm's detection threshold).
Analysis of F-actin dynamics.
For live-cell imaging of F-actin, neurons were transfected with either mRuby-Lifeact (Riedl et al., 2008) or F-tractin-tdTomato (Johnson and Schell, 2009). F-tractin consists of the minimal F-actin binding domain (amino acids 9–40) of rat inositol trisphosphate 3-kinase A. When overexpressed, F-tractin results in an abnormal spine elongation phenotype (Johnson and Schell, 2009). However, at low expression levels, F-tractin labels actin filaments effectively without inducing abnormal spine morphology (Schell and Dent laboratories, unpublished data). To quantify changes in F-actin content in the heads and at the bases of spines, a 12-pixel “+”-shaped ROI (0.3 μm2) was placed (1) in the center of the head of the spine and (2) at the base of the spine, where the spine neck meets the dendrite. To adjust for background fluorescence, 6–10 circular ROIs (48–78 μm2 each) were placed in background regions within the field of view. The mean fluorescence intensity of all ROIs was obtained using the Region Measurements function in MetaMorph, and imported into Matlab for subsequent analysis. In Matlab, local background fluorescence was subtracted from the fluorescence intensity of each spine's ROI at every frame, after which each spine's fluorescence intensity was normalized to its own baseline value (defined as the average value over the 10 min before NMDAR activation; see below). The coefficient of variation (CV) was determined by computing the mean and variance of fluorescence intensity signals before, during, and after drug application (latrunculin) or before and during (jasplakinolide) drug application and then dividing the variance by the mean (see Figs. 6G, 7G).
Figure 6.

Actin depolymerization inhibits MT entry into spines. A, Sequential frames from a neuron transfected with mCherry-Lifeact and EGFP-tubulin taken before (left), during (middle), and after (right) treatment with 10 μm latrunculin-A, including an example of MT entry into a spine during the baseline condition. Interframe interval, 10 s. Scale bar, 2 μm. B, Representative kymographs depicting MT spine invasions before, during, and after treatment with latrunculin-A, from a neuron shown in A. C, D, Representative traces of mCherry-lifeact fluorescence intensity (arbitrary units) in spine heads (C) and bases (D) at each frame of the time-lapse. Light-gray region indicates timing of latrunculin-A application. E, MT invasion frequency [percentage of baseline (Bsln)] observed before, during, and after treatment with latrunculin-A (Lat) (repeated-measures ANOVA with Tukey's post-test, *p < 0.05, ***p < 0.001; n = 37 spines, 4 neurons, 2 preparations). F, F-actin (mCherry-Lifeact or F-tractin-tdTomato) fluorescence intensity (percentage change from baseline) in spine heads (red) and bases (blue) before, during, and after treatment with latrunculin-A (2-way ANOVA with Bonferroni's post-test, *p < 0.05, **p < 0.01, ***p < 0.001; n = 63 spines, 4 neurons, 2 preparations). G, CV of F-actin fluorescence intensity (CVF-actin) in spine heads and bases before, during, and after treatment with latrunculin-A (2-way ANOVA with Bonferroni's post-test, ***p < 0.001; n = 63 spines, 4 neurons, 2 preparations).
Figure 7.

Increasing F-actin promotes MT entry into spines. A, Sequential frames from a neuron transfected with F-tractin-tdTomato and EGFP-tubulin taken before (left) and after (right) treatment with 10 μm jasplakinolide, including an example of MT entry in the presence of the drug. Interframe interval, 10 s; frame width, 2 μm. B, Representative kymographs depicting MT spine invasions before and after treatment with jasplakinolide. C, D, Representative traces of F-tractin-tdTomato fluorescence intensity (arbitrary units) in spine heads (C) and bases (D) before and after treatment with jasplakinolide. Light-gray region indicates timing of jasplakinolide application. E, MT invasion frequency [percentage of baseline (Bsln)] observed before and after treatment with jasplakinolide (Jas) (paired t test, ***p < 0.001; n = 74 spines, 3 neurons, 3 preparations). F, F-tractin-tdTomato fluorescence intensity (percentage change from baseline) in spine heads (red) and bases (blue) before, during, and after treatment with jasplakinolide (paired t test, ***p < 0.001; n = 124 spines, 3 neurons, 2 preparations). G, CV of F-actin fluorescence intensity (CVF-actin) in spine heads and bases before and after treatment with jasplakinolide (2-way ANOVA with Bonferroni's post-test, **p < 0.01, ***p < 0.001; n = 124 spines, 3 neurons, 2 preparations).
Calcium chelation experiments.
Neurons transfected with DsRed2 and EB3-EGFP were imaged for 15 min in extracellular solution [ECS; 140 mm NaCl, 5 mm KCl, 2 mm CaCl2, 2 mm MgCl2, 5 mm HEPES, and 20 mm glucose (315 mOsm)] to assess basal EB3 dynamics. Neurons were then incubated in 2 μm BAPTA-AM for 15 min followed by 15 min of recovery, and then imaged for 15 min again.
Experimental activation of synaptic NMDARs.
Less than 30 min before imaging, neurons were transferred from serum-free media (SFM; Viesselmann et al., 2011) to ECS additionally containing 500 nm TTX to block action potentials. ECS was perfused through Teflon tubing at a constant rate (1.1 ml/min) by syringe pumps (New Era Pump Systems, Kent Scientific). A custom silicone insert with inlet and outlet holes was placed in the culture dish to reduce volume and control flow through the dish. Activation of synaptic NMDARs was achieved by switching the perfusion input from ECS to modified ECS containing 200 μm glycine, 1 μm strychnine, 500 nm TTX, 0 mm MgCl2, and 4 mm CaCl2 (Gly-0Mg2+). This treatment has been shown to activate synaptic NMDARs and trigger LTP (Lu et al., 2001; Fortin et al., 2010). Following a 10 min exposure to Gly-0Mg2+ ECS, the perfusion input was switched back to normal ECS. In some of the GCaMP3 imaging experiments, neurons were pretreated with 200 μm dl-APV 16–24 h before imaging. No difference in the frequency or amplitude of calcium influx events was observed between APV-pretreated and nonpretreated experiments.
Latrunculin A and jasplakinolide experiments.
Latrunculin (10 μm) was diluted from DMSO stock aliquots into normal ECS (without TTX) and perfused in and out of the dish using the pump system described above. In initial experiments, jasplakinolide (10 μm) was diluted from DMSO stock aliquots and perfused in ECS as well, but its effects proved irreversible, making washout impossible. In subsequent experiments, time-lapse acquisition was briefly paused (<1 min) and jasplakinolide stock was dissolved into a sealed dish via pipette.
Drebrin siRNA and immunofluorescence.
Both drebrin-targeting (ON-TARGET plus SMART pool, Mouse DBN1) and nontargeting (ON-TARGET plus Nontargeting Pool) siRNAs were purchased from Dharmacon. Mouse anti-drebrin antibody was purchased from Abcam (ab12350). Neurons originally plated at E15.5 were transfected using Lipofectamine 2000 at 10 DIV with EGFP, EB3-tdTomato, and drebrin siRNA or nontargeting siRNA. EGFP and EB3-tdTomato were imaged in these neurons 3 d after transfection (13 DIV), after which the culture dishes were immediately fixed while maintained at 37°C. To assess siRNA-mediated drebrin knockdown in these culture dishes, we stained with mouse anti-drebrin primary antibody (1:100) and Alexa Fluor 647 anti-mouse secondary antibody (1:500). Drebrin immunofluorescence was measured in EGFP+ neurons using identical acquisition settings for all cells (wide-field illumination with a 100× objective, no neutral density filter, average of three 1 s exposures obtained at 1× gain, and 5 MHz digital gain with the Photometrics Evolve camera, no binning). Pixel intensities rarely saturated in any of the images taken using these settings, and no saturated data were used for analysis. Mean fluorescence intensities were obtained from fixed EGFP+ neurons using the Region Measurements function in MetaMorph. Neurons from each cell culture preparation were stained together. To account for potential variation in staining across preparations, drebrin immunofluorescence intensity values for each preparation were normalized to the mean drebrin immunofluorescence intensity value of neurons transfected with nontargeting siRNA in that preparation.
Statistics and graphing.
All statistical tests and graphing were performed with GraphPad Prism. Statistical tests used and test results are indicated in figures and figure legends (see Results). All of the error bars in the figures and the data in the text are ± SEM.
Results
MTs polymerize into spines from local sites
It is unclear whether MTs that enter spines typically polymerize long distances in the dendrite, or initiate at sites proximal to the spine neck. To address this question, we tracked the movement of polymerizing MT plus ends by imaging neurons cotransfected with EGFP (cytosolic volume marker) and EB3-tdTomato. EB3 is a MT plus end protein that labels only the growing tips of MTs (Stepanova et al., 2003). Imaging fluorescent EB3 enabled us to track MT polymerization events in both the dendrite shaft and into spines (Fig. 1A). Relatively fast (0.83 Hz) imaging of EB3 “comets” revealed that while MTs often polymerize relatively long distances in the shaft of the dendrite, those that enter spines typically originate from an immediately adjacent region of the shaft (Fig. 1A). To quantify this difference, we identified spines invaded by a comet during imaging (10 min time-lapse per neuron) and measured how far each spine-invading comet traveled before entering a spine (Fig. 1B, red bars), and counted how many spines the comets passed along their trajectory from the dendrite shaft into the spine (Fig. 1C, red bars). We also measured these parameters in comets that did not invade spines (Fig. 1B,C, black bars). Whereas the distance traversed by noninvading comets was distributed broadly and ranged from 1 to 34 μm (0–24 spines passed), most invading comets originated <2 μm from the spine they entered (0 spines passed). Comparison of the two distributions revealed that both distance traveled and number of spines passed were significantly less for invading comets than for noninvading comets (3.2 ± 0.4 vs 8.3 ± 0.6 μm and 2.6 ± 0.4 vs 6.4 ± 0.4 spines passed; mean ± SEM). Thus, while dynamic MTs are continually present throughout the dendrite, MTs that polymerize into spines typically do so from a proximal site, suggesting that these events may be locally regulated.
MT-spine invasions are regulated by local synaptic calcium signals
The intracellular signaling mechanisms responsible for MT entry into spines are unknown. In a previous study, we found that MT-spine invasions are promoted by activation of synaptic NMDARs; Merriam et al., 2011). Since NMDAR channel opening results in a large flux of calcium ions into the spine, we hypothesized that elevations in intracellular calcium may influence MT entry into spines. To test this possibility, we imaged neurons cotransfected with DsRed2 (volume fill) and EB3-EGFP before and after treatment with the membrane-permeable calcium chelator BAPTA-AM (Fig. 2A,B). When kymographs of EB3 dynamics were constructed by drawing lines through individual spines, EB3 comets appeared as dotted or continuous lines of positive slope as the MT advanced into the spine, followed by rapid dissociation of EB3 and loss of comets during pausing/retraction of MTs in the spine head (Fig. 2C). When kymographs were constructed by drawing lines along the dendritic shaft, EB3 comets appeared as straight lines of positive or negative slope (indicating anterograde or retrograde polymerization, respectively) that appear and disappear stochastically (Fig. 2D). After calcium chelation with 2 μm BAPTA-AM, MT entry into spines was reduced from 12.0 ± 1.5 to 4.9 ± 0.9 invasions/h (Fig. 2C,E). However, calcium chelation did not directly affect MT polymerization per se, as the number of polymerizing MTs in the dendrite shaft was indistinguishable before and after BAPTA-AM treatment (p = 0.17, paired t test comparing EB3 comets/μm/h in the dendrite before and after BAPTA-AM; Fig. 2D,F). These data suggest that a calcium-dependent signal originating in or near MT-targeted spines might regulate their entry.
Figure 2.
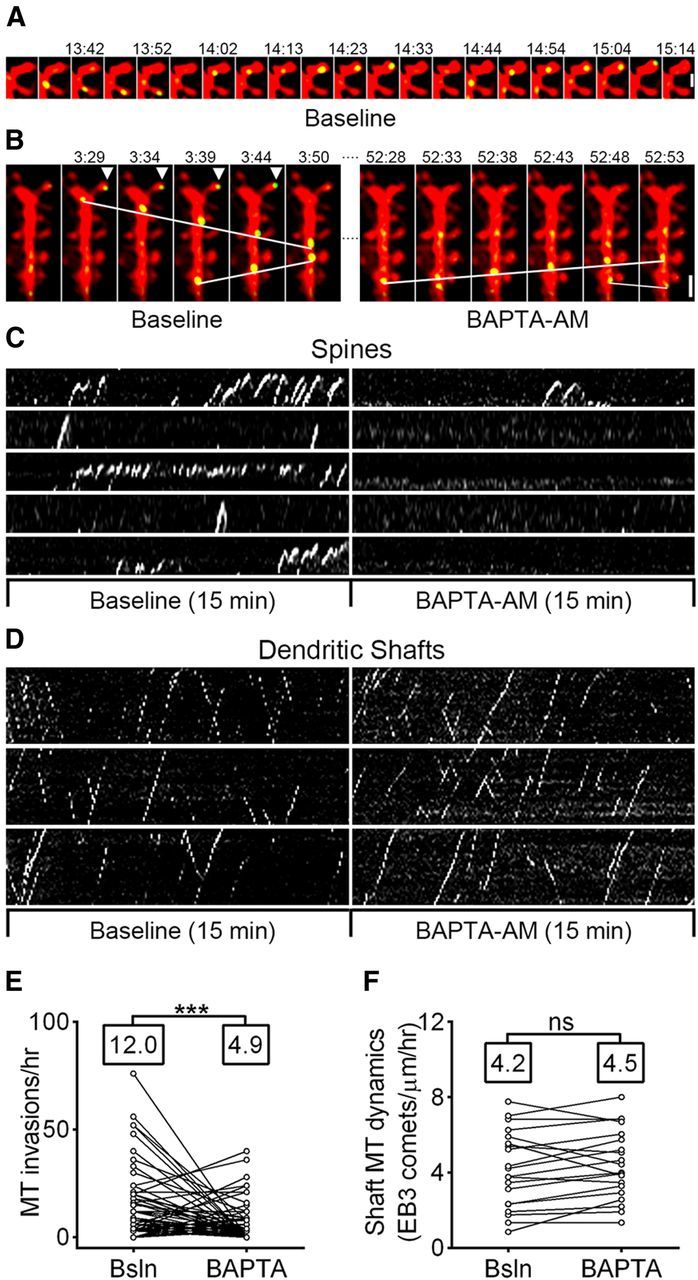
MT invasions are calcium-dependent. A, Sequential frames from a neuron transfected with DsRed2 and EB3-EGFP taken before calcium chelation (Baseline) showing EB3 puncta moving into spines. Scale bar, 1 μm. B, Sequential frames from the same neuron as in A taken before (left) and after (right) calcium chelation with BAPTA-AM. White lines indicate EB3 puncta moving in the dendritic shaft. Arrowheads indicate an EB3 punctum in a spine (the larger spine from A). Scale bar, 2 μm. C, Representative kymographs from spines invaded by EB3 puncta before (left) and after (right) incubation with BAPTA-AM. Same neuron as in A. D, Representative kymographs from 10 μm segments of dendrite shaft before (left) and after (right) incubation with BAPTA-AM. Same neuron as in A and B. E, Comparison of MT spine invasion frequency during baseline (Bsln) and after incubation with BAPTA-AM (n = 88 spines, 4 neurons, 3 preparations). Only spines invaded some time during imaging (before or after BAPTA-AM) are depicted (paired t test, ***p < 0.001). Population means are shown above plots. F, Comparison of MT polymerization event frequency in the dendrite shaft during baseline (Bsln) and after incubation with BAPTA-AM (n = 20 segments of 10 μm, 4 neurons, 3 preparations). A paired t test showed no significant change (p = 0.17). Population means are shown above plots.
To directly test this possibility, we imaged neurons cotransfected with EB3-tdTomato and the calcium reporter GCaMP3 (Tian et al., 2009) before, during, and after treatment with glycine in 0 mm Mg2+ solution (Gly-0Mg2+) (Lu et al., 2001; Fortin et al., 2010). To resolve small, local calcium events, we performed these experiments in the presence of 500 nm TTX. At this concentration of TTX, global calcium transients in dendrites were silenced, revealing localized calcium influx occurring in individual spines during NMDAR activation (Fig. 3A). These local calcium events occurred only during treatment with Gly-0Mg2+ (Fig. 3B). Furthermore, calcium events that occurred during NMDAR activation were localized to individual spines, being severely attenuated or absent in the dendrite shaft proximal to the active spine and absent from adjacent spines (Fig. 3B). For some experiments, neurons were pretreated with the NMDAR antagonist dl-APV (200 μm) 16–24 h before imaging, and APV was removed upon treatment with Gly-0Mg2+ (Fig. 3A–C). No difference in the frequency or amplitude of calcium influx events was observed between APV-pretreated and nonpretreated experiments, and therefore data from neurons with and without APV pretreatment were pooled. Neurons maintained in APV before, during, and after treatment with Gly-0Mg2+ did not exhibit calcium transients, confirming that these calcium events are NMDAR-dependent (data not shown).
Figure 3.

MTs target spines that exhibited calcium spikes during NMDAR activation. A, Sequential frames showing rapid synaptic calcium influx during treatment with Gly-0Mg2+. The elevation in GCaMP3 fluorescence is mostly restricted to Spine 2 (right) and is entirely absent from Spine 1 (left). Scale bar, 2 μm. B, Representative traces of GCaMP3 fluorescence intensity from the spines and dendrite shown in A, taken before (left), during (middle), and after (right) NMDAR activation. The event shown in A is denoted by a red asterisk over the second trace during treatment with Gly-0Mg2+ for Spine 2. Each trace consists of 100 frames acquired at 130 ms intervals (13 s/trace). C, Kymographs show invasion of Spine 2, but not Spine 1, by MT plus ends (EB3-tdTomato) following NMDAR activation. A schematic of the 1 h experimental paradigm is shown above the kymographs. Vertical red lines indicate the timing of the traces shown in B. D, Frequency of calcium events that occurred in invaded and noninvaded spines during treatment with Gly-0Mg2+ (t test, ***p < 0.001; n = 146 spines, 5 neurons, 3 preparations). Pie graphs indicate the proportion of spines that had some (white) versus no (black) events. E, Frequency of MT spine invasions that occurred in spines that did (+) or did not (−) exhibit calcium transients during treatment with Gly-0Mg2+ (t test, ***p < 0.001; n = 159 (+) and 129 (−) spines, 5 neurons, 3 preparations). Pie graphs indicate the proportion of spines that had some (white) versus no (black) invasions. F, Kymograph shows EB3 entry into a spine following treatment with Gly-0Mg2+ before incubation with BAPTA-AM, but not after. G, Frequency of MT spine invasions before, during, and after treatment with Gly-0Mg2+ under basal conditions and following incubation with BAPTA-AM [2-way repeated measures (both factors) ANOVA, with Sidak's post-test, **p < 0.01, ***p < 0.001; n = 70 spines, 4 cells, 1 preparation].
Consistent with the results of a previous study (Merriam et al., 2011), an increase in MT-spine invasions was observed in a subset of spines following NMDAR activation (Fig. 3C). The increase in MT invasion frequencies was modest during the 10 min period of treatment with Gly-0Mg2+ (p < 0.05) but became highly significant during the 10 min period immediately following NMDAR activation (p < 0.0001) and persisted for the rest of the 1 h imaging session (one-way ANOVA repeated measures with Dunnett's post-test). In total, 28% of spines were invaded during these sessions. We found no relationship between MT invasion frequency and several spine morphology parameters, such as length, head width, neck width, head width/length, or head-width/neck-width (data not shown), consistent with our previous findings (Hu et al., 2008). Importantly, in comparison with noninvaded spines, spines invaded by MTs were more likely to have exhibited calcium transients during NMDAR activation (Fig. 3A–C). Population analysis comparing calcium events in MT-invaded versus noninvaded spines confirmed that invaded spines experienced much more frequent events during the Gly-0Mg2+ treatment (0.40 ± 0.07 vs 1.77 ± 0.17 spikes/min; Fig. 3D). Indeed, we observed calcium events in only 30% of noninvaded spines, versus 80% of invaded spines. In the relatively few noninvaded spines that exhibited calcium transients, peak amplitudes were not different from those observed in invaded spines (ΔF/F = 1.05 ± 0.07 vs 1.10 ± 0.04, respectively). Comparing MT invasion frequencies in active spines (spines that exhibited calcium transients) with inactive spines revealed that the active spines were more likely to be invaded (62% of active spines vs 19% of inactive spines) and were invaded more frequently (5.01 ± 0.74 vs 1.05 ± 0.27 invasions/h; Fig. 3E). Thus, MTs preferentially target spines in which synaptic calcium influx has recently occurred.
To confirm that NMDAR-dependent increases in MT-spine invasions require intracellular calcium events, we imaged neurons before, during, and after stimulation with Gly-0Mg2+ as described above, and then incubated the cells in BAPTA-AM to chelate intracellular calcium before stimulating them a second time with Gly-0Mg2+. As before, Gly-0Mg2+ treatment before BAPTA-AM incubation triggered an increase in EB3 comet entry into spines, but following incubation with BAPTA-AM, MT-spine invasions were dramatically reduced and were not altered following a second stimulation with Gly-0Mg2+ (Fig. 3F,G).
Activity-dependent enhancement of spine F-actin predicts MT entry
Although MTs preferentially target spines that exhibit NMDAR-dependent calcium transients (Fig. 3C,D), increases in MT-spine invasions peak in the minutes following NMDAR activation and persist >30 min later (Fig. 3C; Merriam et al., 2011). Furthermore, although MTs enter spines from the neighboring dendrite (Fig. 1), the synaptic calcium transients evoked by treatment with Gly-0Mg2+ showed minimal spillover into the dendrite (Fig. 3A,B) and calcium chelation did not affect MT plus end dynamics in the dendritic shaft (Fig. 2D,F). It is therefore unlikely that calcium influx directly promotes MT entry into spines. Multiple studies have confirmed that calcium influx through NMDARs triggers actin-dependent spine structural plasticity that lasts minutes to hours (Matsuzaki et al., 2004; Okamoto et al., 2004), with spillover of F-actin from the spine head into the neck and base observed in some cases (Honkura et al., 2008). Interactions between actin and microtubules are well documented in other developmental stages of neurons (Dent and Kalil, 2001; Schaefer et al., 2002; Suter et al., 2004; Dent et al., 2007). We therefore sought to determine whether changes in the spine F-actin network contribute to MT entry into spines.
To assess the relationship between local synaptic NMDAR calcium influx and spine F-actin content, we treated neurons with Gly-0Mg2+ while imaging GCaMP3 and the F-actin reporter F-tractin-tdTomato (Johnson and Schell, 2009; see Materials and Methods) in the presence of TTX. Examination of individual spines suggested that F-actin content increased more in spine heads that exhibited frequent calcium transients (Fig. 4A,B). Population analysis of the correlation between calcium event frequency and changes in F-actin confirmed this observation (Pearson r = 0.2118, p < 0.001; n = 256 spines; Fig. 4C). Since MT plus ends that enter spines typically begin polymerizing at or near the base of spines (Fig. 1), we measured changes in F-actin in this region as well, and observed a similar correlation between synaptic activity and F-actin at the base of spines (Fig. 4A,B,D; Pearson r = 0.1525, p = 0.015; n = 256 spines). A direct comparison of active (>0 calcium events) versus inactive (0 calcium events) spines confirmed that F-actin changes were significantly greater in heads and bases of active spines (26.2 ± 4.7% vs 6.2 ± 3.4% in spine heads and 11.2 ± 2.6% vs 0.2 ± 2.8% in bases; Fig. 4E). Furthermore, only changes in F-actin in the heads and bases of active spines were significantly nonzero (one-sample t test). Thus, significant increases in spine F-actin occurred only in or near spines that experienced synaptic calcium influx.
Figure 4.
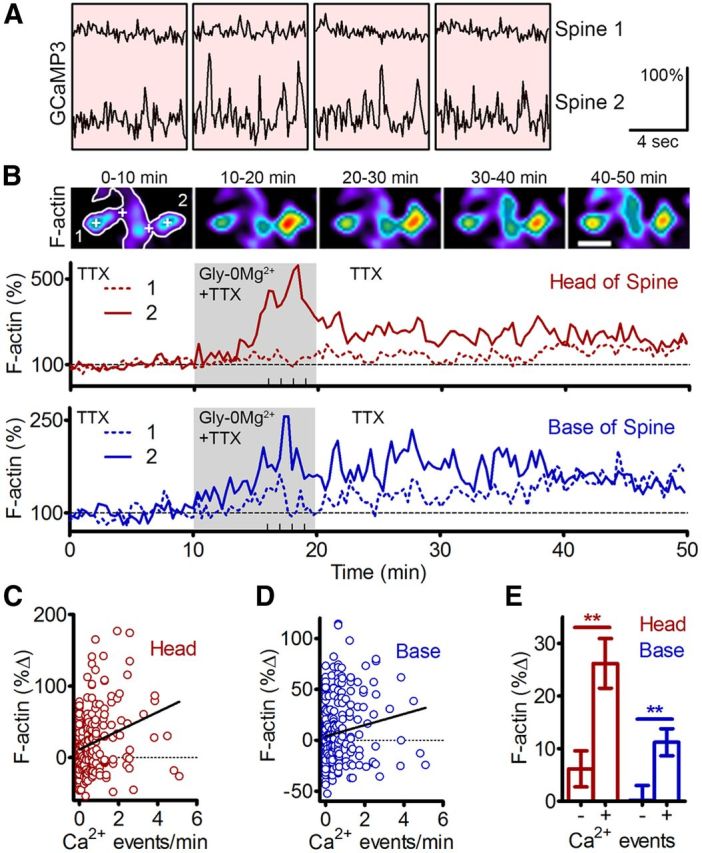
Synaptic calcium influx triggers an increase in F-actin content at the head and base of active spines. A, Representative traces of GCaMP3 fluorescence intensity from two spines during a 10 min treatment with Gly-0Mg2+. Each trace consists of 76 frames acquired at 105 ms intervals (8 s/trace). Individual traces were acquired at 1 min intervals, interleaved with imaging of F-tractin-tdTomato. B, Top, Pseudocolored images of F-tractin-tdTomato averaged over 10 min time intervals spanning the time-lapse (i.e., before, during, and after treatment with Gly-0Mg2+). Labels in left-most panel correspond to Spines 1 and 2 shown in A. “+” Signs indicate locations of ROIs used for traces depicted below. Scale bar, 1.5 μm. Middle, Bottom, Normalized fluorescence intensities for Spines 1 and 2 at each frame of the time-lapse [20 s intervals; dashed line, Spine 1; solid line, Spine 2; red lines (middle), heads of spines; blue lines (bottom), bases of spine]. Light-gray region from 10 to 20 min indicates the timing of the Gly-0Mg2+ treatment. Thick marks on x-axes indicate the timing of traces shown in A. C, D, Changes in F-actin fluorescence intensity in spine heads (C) and bases (D) during and after treatment with Gly-0Mg2+ as a function of calcium event frequency during the treatment (spine heads: Pearson r = 0.2118, p = 0.0006; spine bases: Pearson r = 0.1525; p = 0.0146; n = 256 spines, 6 neurons, 2 preparations). E, Changes in F-actin (F-tractin-tdTomato) fluorescence intensity in spines that did (+) or did not (−) exhibit calcium influx during treatment with Gly-0Mg2+ (t test, **p < 0.01; n = 171 (+) and 85 (−) spines, 6 neurons, 2 preparations).
To determine whether activity-dependent changes in spine F-actin content promote MT entry into spines, we next treated neurons with Gly-0Mg2+ while imaging F-actin and MTs (F-tractin-tdTomato and EGFP-tubulin) in the presence of TTX. Examination of individual spines revealed that MTs tended to enter spines that were undergoing large increases in F-actin content (Fig. 5A,B). To describe this at the population level, we compared changes in the F-actin content of MT-invaded spines versus noninvaded spines at multiple time-points during and after treatment with Gly-0Mg2+. On average, both the head and the base of spines that were invaded by MTs exhibited larger increases in F-actin content than was observed in noninvaded spines (Fig. 5B,C), indicating that MTs preferentially target spines in which large activity-dependent increases in F-actin are occurring.
Figure 5.

MTs target spines exhibiting large increases in F-actin. A, F-actin changes and MT invasions in a representative pair of spines. Top, Pseudocolored 10 min averages of the F-actin (F-tractin-tdTomato) signal across a 1 h time-lapse. Neurons were treated with Gly-0Mg2+ from 10 to 20 min. Spine 1 exhibited a larger increase in F-actin content compared with Spine 2. Bottom, Tubulin kymographs show repeated MT entry into Spine 1, but not Spine 2, at t = 40–45 min. B, C, Population analysis of changes in F-actin content in the heads (B) and bases (C) of MT-invaded spines (squares, solid lines) versus noninvaded spines (circles, dashed lines). Gray bars indicate timing of Gly-0Mg2+ (t test on percentage F-actin change pooled across the 50 min during and after treatment with Gly-0Mg2+, **p < 0.01; n = 56 spines, 3 neurons, 2 preparations).
F-actin is necessary and sufficient for MT entry into spines
The results of Figure 5 suggest that MT entry into spines is regulated by changes in local F-actin content. To establish whether F-actin is required for MTs to enter spines, we treated neurons with the actin depolymerizing drug latrunculin A (10 μm) while imaging MTs and an F-actin reporter (mRuby-lifeact or F-tractin-tdTomato). While spines did not collapse or disappear in the presence of latrunculin, the drug did cause substantial loss of F-actin in the spine head, which recovered following washout (n = 63 spines; Fig. 6A,C,F). Latrunculin also caused a decrease in F-actin dynamics in the spine head, reflected as a decrease in the CV (variance/mean of fluorescence intensity) compared with baseline (Fig. 6G). F-actin dynamics partially recovered following latrunculin washout (Fig. 6G). At the base of spines, latrunculin caused a slight increase in fluorescence intensity of the F-actin reporter, which was most likely due to the presence of unbound fluorescent reporter (Fig. 6D,F). This interpretation is supported by the observation that F-actin dynamics showed a similar reduction at the base of spines as in spine heads, again with partial recovery of dynamics following washout (Fig. 6G). Interestingly, the loss of F-actin induced by latrunculin was accompanied by a nearly complete loss of MT-spine invasions (11.4 ± 3.9% of baseline), which also recovered partially following drug washout (54.6 ± 12.8% of baseline; n = 37 spines; Fig. 6B,E). Furthermore, latrunculin did not affect EB3 dynamics in the dendrite shaft (5.19 ± 0.21 EB3 comets/μm/h in the dendrite before latrunculin; 5.20 ± 0.29 EB3 comets/μm/h in the dendrite during latrunculin; and 5.07 ± 0.43 EB3 comets/μm/h in the dendrite after latrunculin; p = 0.92, one-way ANOVA with repeated measures). Thus, F-actin is required for MT entry into spines, even though it is dispensable for MT plus end dynamics in general.
To determine whether an increase in F-actin content alone is sufficient to promote MT entry into spines, we treated neurons with the F-actin stabilizing drug jasplakinolide (10 μm) while imaging MTs and an F-actin reporter. Jasplakinolide triggered an increase in the F-actin content at both the heads and bases of spines within ∼10 min of drug treatment (Fig. 7A,C,D,F). Jasplakinolide also reduced F-actin dynamics, as measured by CV (Fig. 7G). Unlike latrunculin, F-actin levels and dynamics did not recover after washout of jasplakinolide, as the effects of this drug proved to be irreversible (data not shown). Importantly, we observed a 94.7 ± 26.8% increase in the frequency of MT-spine invasions following jasplakinolide treatment (p = 0.0015; n = 74 spines; Fig. 7B,E), demonstrating that an increase in the concentration of stable actin filaments is sufficient to promote MT entry into spines. As with latrunculin, jasplakinolide did not affect EB3 dynamics in the dendrite shaft (4.19 ± 1.19 EB3 comets/μm/h in the dendrite under basal conditions and 3.81 ± 0.81 EB3 comets/μm/h in the dendrite in the presence of jasplakinolide; p = 0.42, paired t test).
Drebrin is necessary and sufficient for MT entry into spines
While the results of jasplakinolide and latrunculin experiments demonstrate a clear role for F-actin in MT entry into spines, the mechanisms mediating this MT–actin interaction remain unclear. Drebrin A is a neuron-specific F-actin binding protein that is highly enriched in dendritic spines (Kojima and Shirao, 2007; Ivanov et al., 2009b; Ferhat, 2012). Drebrin interacts directly with EB3 in vitro and in the transition zone of neuronal growth cones during embryonic development (Geraldo et al., 2008). To test whether synaptic NMDAR activation affects drebrin distribution, we treated neurons with Gly-0Mg2+ alone or following incubation with BAPTA-AM, and examined drebrin immunofluorescence (IF) intensities in spines and in the adjacent dendrites 10 min after NMDAR activation (Fig. 8A). Neurons treated with Gly-0Mg2+ alone showed an increase in drebrin in the spine relative to the adjacent shaft (FSpine/FDendrite = 2.01 ± 0.02 vs 2.39 ± 0.03; p < 0.0001), whereas neurons treated with both Gly-0Mg2+ and BAPTA-AM showed a decrease in drebrin (FSpine/FDendrite = 1.72 ± 0.02; p < 0.0001, one-way ANOVA with Tukey's post-test), suggesting that drebrin can translocate to spines following synaptic NMDAR activation (Fig. 8B).
Figure 8.
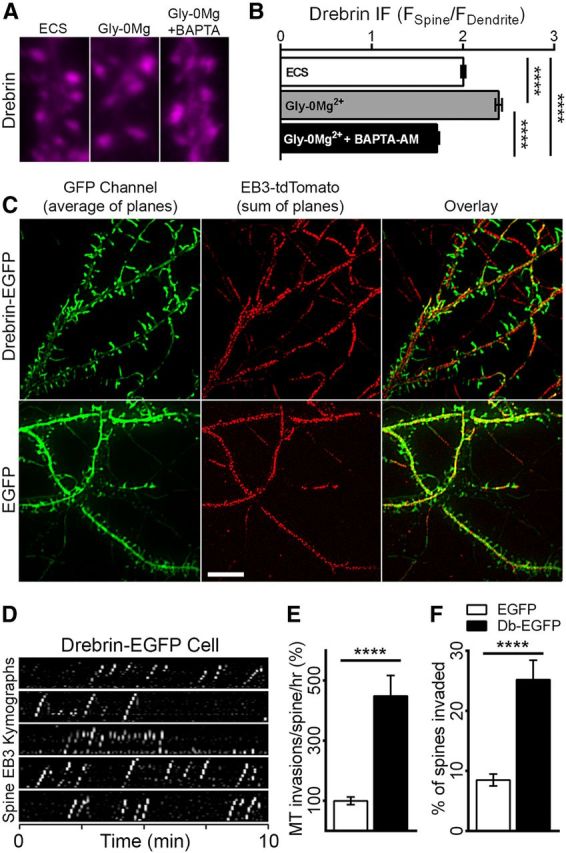
Overexpression of drebrin A promotes MT entry into spines. A, Drebrin IF images from neurons fixed 10 min after treatment with ECS (control), Gly-0Mg2+, or Gly-0Mg2+ following incubation with BAPTA-AM. B, Comparison of drebrin IF in spines normalized to drebrin IF in dendrites adjacent to the spines [1-way ANOVA, ****p < 0.0001; n = 825 spines, 27 neurons (ECS), 717 spines, 24 neurons (Gly-0Mg2+), 720 spines, 23 neurons (Gly-0Mg2+ plus BAPTA-AM) from 3 preparations]. C, Representative images from a drebrin A-EGFP-overexpressing neuron (top) and an EGFP-labeled control neuron (bottom). The GFP channel image is the average, and the EB3-tdTomato image is the sum of 121 planes captured over 10 min at 5 s intervals. Scale bar, 10 μm. D, Representative kymographs depict EB3 movement in spines from the drebrin A-EGFP neuron in A. E, Comparison of MT spine invasion frequencies in EGFP-expressing versus drebrin A-EGFP-expressing (Db-EGFP) neurons [t test, ****p < 0.0001; n = 28 (EGFP), and 22 (Db-EGFP) neurons from 5 preparations]. F, Comparison of percentage of spines invaded in EGFP-expressing versus drebrin A-EGFP-expressing neurons (t test, ****p < 0.0001; n = 28 (EGFP) and 22 (Db-EGFP) neurons from 5 preparations).
To determine whether drebrin contributes to MT entry into spines, we overexpressed drebrin A-EGFP in neurons cotransfected with EB3-tdTomato. Consistent with previously published findings, overexpression of drebrin resulted in elongated spines (Hayashi and Shirao, 1999; Ivanov et al., 2009a) and abnormally long protrusions (Mizui et al., 2005; Biou et al., 2008; Fig. 8C). In drebrin-overexpressing neurons, EB3 entry into spines occurred frequently (Fig. 8D,E) and in a higher percentage of spines (Fig. 8F). Indeed, comparison of MT-spine invasion frequencies in neurons transfected with EGFP versus drebrin A-EGFP revealed a 4.5-fold increase (449 ± 68.2%) in drebrin-overexpressing neurons (Fig. 8E). Moreover, the percentage of spines invaded by MTs increased from 8.49 ± 0.99% in EGFP transfected neurons to 25.20 ± 3.24% in drebrin-overexpressing neurons, a threefold increase (Fig. 8F). In contrast, EB3 dynamics in the dendrite shaft were not affected by drebrin overexpression (6.70 ± 1.11 vs 6.29 ± 0.98 EB3 comets/μm/h in the dendrites of neurons transfected with EGFP vs drebrin A-EGFP; p = 0.79, t test).
To test whether expression of endogenous drebrin is necessary for MTs to enter spines, we transfected neurons with EGFP, EB3-tdTomato, and either a drebrin-targeting siRNA pool or a nontargeting siRNA. To verify drebrin knockdown, we compared drebrin IF intensities across EGFP-expressing neurons from the two groups described above (see Materials and Methods). Neurons transfected with drebrin-targeting siRNA showed a significant reduction in drebrin IF relative to neurons transfected with nontargeting siRNA (53 ± 7% reduction; Fig. 9A,C). Drebrin knockdown did not significantly affect spine morphology or density [spine length, 1.46 ± 0.10 vs 1.70 ± 0.09 μm (p = 0.11, t test); spine head width, 0.68 ± 0.02 vs 0.67 ± 0.02 μm (p = 0.89, t test); spine neck width, 0.40 ± 0.01 vs 0.40 ± 0.02 μm (p = 0.85, t test); spine density, 0.29 ± 0.06 vs 0.38 ± 0.08/μm (p = 0.39, t test) for neurons transfected with nontargeting vs drebrin-targeting siRNA; Fig. 9B]. Despite having comparable spine morphologies, neurons transfected with drebrin-targeting siRNA showed dramatically fewer MT spine invasions than neurons transfected with nontargeting siRNA (86 ± 23% reduction; Fig. 9D). Furthermore, the percentage of spines invaded by MTs decreased from 11.14 ± 2.03 to 3.80 ± 1.07 in neurons transfected with drebrin-targeting siRNA (Fig. 9E). As with drebrin overexpression, EB3 dynamics in the dendrite shaft were not affected by drebrin knockdown (7.54 ± 0.29 vs 7.22 ± 0.47 EB3 comets/μm/h in the dendrites of neurons transfected with nontargeting vs drebrin-targeting siRNA; p = 0.59, t test). Together, these results indicate that drebrin A acts as a positive and specific regulator of MT entry into spines.
Figure 9.
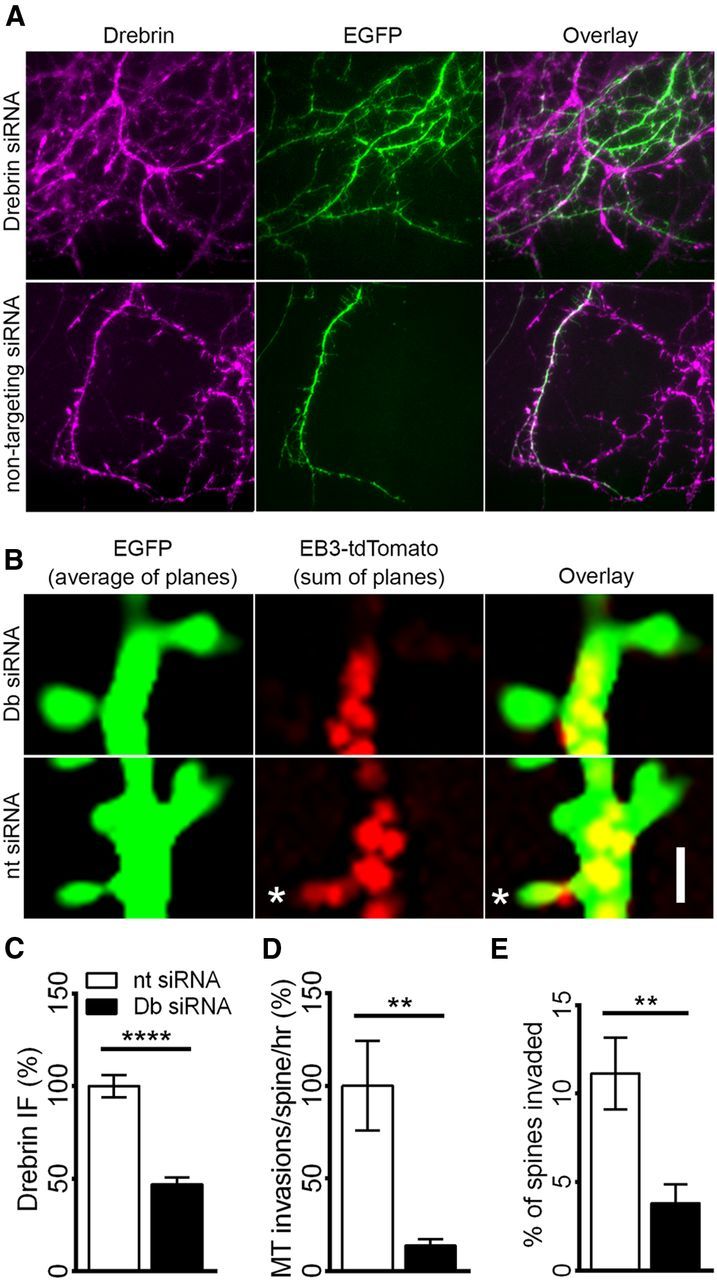
Drebrin A knockdown inhibits MT entry into spines. A, Representative drebrin immunofluorescent images from neurons transfected with EGFP, EB3-tdTomato (data not shown), and either drebrin siRNA (top) or nontargeting siRNA (bottom). B, Representative images of spines from neurons transfected with EGFP (green), EB3-tdTomato (red), and either drebrin siRNA (top, Db siRNA) or nontargeting siRNA (bottom, nt siRNA). Scale bar, 1 μm. C, Comparison of drebrin intensity in neurons transfected with EGFP, EB3-tdTomato, and either nontargeting siRNA or drebrin-targeting siRNAs [t test, ****p < 0.0001; n = 14 (nt), and 12 (Db) neurons from 3 preparations]. D, Comparison of MT spine invasion frequencies in neurons transfected with EGFP, EB3-tdTomato, and either nontargeting siRNA or drebrin-targeting siRNA [t test, **p < 0.005; n = 9 (nt), and 10 (Db) neurons from 3 preparations]. E, Comparison of percentage of spines invaded in neurons transfected with EGFP, EB3-tdTomato, and either nontargeting siRNA or drebrin-targeting siRNA [t test, **p < 0.005; n = 9 (nt), and 10 (Db) neurons from 3 preparations].
Discussion
Multiple studies have confirmed that MTs enter spines of hippocampal (Gu et al., 2008; Hu et al., 2008; Jaworski et al., 2009), cortical (Hu et al., 2008), and cerebellar Purkinje neurons (Wagner et al., 2011), and that MT entry is regulated by activity (Hu et al., 2008; Kapitein et al., 2011; Merriam et al., 2011). Dynamic MTs contribute to numerous processes related to synaptic function and plasticity, including activity-dependent spine enlargement (Merriam et al., 2011), LTP (Jaworski et al., 2009), BDNF-dependent increases in PSD-95 (Hu et al., 2011), and regulation of p140Cap (Jaworski et al., 2009). Despite the progress made by these studies, they have not provided direct experimental evidence for a mechanism mediating MT entry into spines. Here we have identified a mechanism by which synaptic activity locally regulates MT entry into spines. We found that MTs usually enter spines from very proximal sites of initiation in the neighboring dendritic shaft, and that MT-spine entry is calcium-dependent, with local NMDAR-dependent calcium influx specifically directing MTs into active spines. We also found that the F-actin network of spines is directly involved in MT entry. Spines that experienced calcium influx also exhibited increased F-actin both in the head and at the base of the spine, and these spines were preferentially targeted by MTs. Furthermore, depolymerization of F-actin inhibited MT entry into spines, whereas stabilization of F-actin promoted MT entry. Finally, we discovered that the F-actin-binding protein, drebrin A, is involved in regulation of MT entry into spines. Drebrin spine content increased following NMDAR activation, and decreased in the presence of BAPTA-AM. Furthermore, drebrin A overexpression produced a marked increase in MT entry into spines, whereas drebrin knockdown resulted in decreased MT entry into spines. Interestingly, none of these manipulations of actin or drebrin affected MT plus end dynamics in the dendrite shaft. Together these data support a model in which calcium-dependent increases in F-actin content occur in and near active spines, leading to a drebrin-dependent interaction between F-actin and MT plus ends that facilitates MT polymerization into the spine (Fig. 10).
Figure 10.

Model for NMDA-dependent MT invasion of dendritic spines. At baseline (t = 0–10 min), MTs and F-actin remain spatially separate, with F-actin prominent in spines and MTs in the dendritic shaft. Calcium influx occurs through NMDARs during treatment with Gly-0Mg2+ for 10 min (t = 10–20 min). This calcium influx, which occurs soon after addition of Gly-0Mg2+, results in increased actin polymerization in the spine head and neck after a slight delay (still during Gly-0Mg2+), resulting in increased spine size. The increased F-actin in the spine head and neck binds more drebrin, positioning drebrin to interact with EB3 on polymerizing MTs near the spine neck. The polymerizing MT is then guided into the spine head by F-actin, allowing the EB3-tipped MT to extend well into the spine, resulting in more spine enlargement.
Synaptic calcium influx and F-actin regulate MT entry into spines
To test whether synaptic activity correlates with MT entry at the level of individual spines, we developed a simple but novel method for detecting calcium influx events occurring locally in spines. We achieved this by imaging neurons transfected with the GFP-based calcium indicator GCaMP3 in the presence of low (500 nm) TTX before, during, and after treatment with Gly-0Mg2+ (Lu et al., 2001). This allowed for unambiguous visualization of isolated synaptic calcium influx events occurring at individual spines when NMDARs were activated. By coimaging GCaMP3 and EB3-tdTomato under these conditions, we discovered that MTs preferentially target “active” spines—i.e., spines that have recently experienced NMDAR-mediated calcium influx.
Since calcium influx through NMDARs has been shown to alter the actin cytoarchitecture of spines (Saneyoshi and Hayashi, 2012), we asked whether activity-dependent changes in spine F-actin might influence MT entry into spines. We found that synaptic calcium influx promotes increases in F-actin content in the head and at the base of spines. This observation is consistent with previous studies, in which spine F-actin was increased following local electrical stimulation (Fukazawa et al., 2003; Okamoto et al., 2004) or glutamate uncaging at individual spines (Honkura et al., 2008). We also demonstrated that MTs preferentially target spines undergoing large increases in F-actin, suggesting that activity-dependent changes in F-actin in the head and base of spines are key determinants of MT entry. To confirm an essential role for F-actin in the regulation of MT entry into spines, we treated neurons with drugs that either depolymerize or stabilize actin filaments. Whereas actin depolymerization resulted in a loss of MT entry into spines, increases in F-actin actually promoted MT entry into spines. Thus, increased F-actin within spines is both necessary and sufficient for MT entry into spines.
Drebrin acts as an important linker between F-actin and MT entry into spines
Activity-dependent changes in spine F-actin are well documented and depend largely on signaling through calcium-dependent kinases and subsequent activation of Rho GTPases (Saneyoshi and Hayashi, 2012). By comparison, much less is known about the mechanisms linking the actin and MT cytoskeletons in dendrites and spines. A recent study demonstrated, using platinum replica electron microscopy, that actin filaments are present in the base of dendritic spines and can interdigitate with perpendicular MTs in the dendritic shaft (Korobova and Svitkina, 2010). This raises the possibility that MTs may use actin filaments present in the spine neck as tracks for polymerization into dendritic spines. However, F-actin and MTs do not bind to each other directly but rather interact through a number of F-actin-associated and MT-associated proteins (Dent et al., 2011b). Many proteins expressed in dendrites may be involved in this interplay (Georges et al., 2008). However, drebrin is a particularly intriguing candidate since it is highly enriched in spines (Kojima and Shirao, 2007; Ivanov et al., 2009b; Ferhat, 2012), is enhanced in the hippocampus after LTP stimulation (Fukazawa et al., 2003), and interacts directly with EB3 both in vitro and in neuronal growth cones, where it contributes to axon outgrowth (Geraldo et al., 2008).
Consistent with previous studies, drebrin A overexpression resulted in abnormally long spines (Hayashi and Shirao, 1999; Ivanov et al., 2009a). Interestingly, drebrin overexpression also resulted in a dramatic increase in the frequency of MT spine invasions and the percentage of spines invaded by MTs. To determine whether drebrin expression is necessary for MTs to enter spines, we knocked down drebrin with siRNA. Drebrin knockdown caused a dramatic reduction in the frequency of MT spine invasions and the percentage of spines invaded by MTs, demonstrating that drebrin is an essential positive regulator of MT entry into spines. Unlike drebrin overexpression, the level of drebrin knockdown achieved in this study did not affect spine morphology, although previous studies have shown that more complete drebrin knockdown affects spine morphology (Takahashi et al., 2006) and synaptic activity (Ivanov et al., 2009a). Since our more modest knockdown still inhibited MT entry into spines, drebrin's role in this process appears to be specific and distinct from its important role in spine plasticity. Nonetheless, the precise nature of the interaction between drebrin and dynamic MTs remains unclear. It is possible that, following synaptic calcium influx, new F-actin is polymerized at the base of the spine and F-actin-bound drebrin interacts with EB3 to guide polymerizing MT plus ends into the spine along the actin filaments (Fig. 10).
Function of MTs in spines
The function of MTs in spines remains poorly understood, but there is evidence to suggest that EB3 itself acts as an upstream regulator of spine actin composition. For example, Hoogenraad and colleagues demonstrated that EB3 interacts directly with the Src binding protein p140Cap in spines, and that overexpression of either EB3 or p140Cap results in spine enlargement, whereas knockdown of either protein causes spines to revert to a thin, filopodial morphology (Jaworski et al., 2009). They proposed that when EB3 enters spines, it stabilizes p140Cap in the postsynaptic density, where it promotes spine stabilization and growth by inhibiting Src kinase activity. According to this model, in the absence of p140Cap, Src phosphorylates cortactin, resulting in a loss of Wiskott-Aldrich syndrome protein-mediated actin assembly (Hering and Sheng, 2003; Webb et al., 2007; Wegner et al., 2008; Jaworski et al., 2009). Given our finding that EB3 entry into spines is itself regulated by the local F-actin network, these results suggest that a complex, bidirectional regulatory interplay exists between the local F-actin network of spines and the MT plus ends that enter them.
The fact that MTs preferentially target spines undergoing calcium-dependent F-actin remodeling is intriguing given that learning and memory are thought to be instantiated at least in part by activity-dependent changes in synaptic strength (Hebb, 1949). This poses a challenging problem for individual neurons, since it requires tight spatial and temporal regulation of protein expression and function (Martin and Kosik, 2002; Redondo and Morris, 2011). Dynamic MTs may help circumvent this problem by shuttling molecular cargo into spines undergoing local activity-dependent plasticity, thereby functioning as part of a synaptic tagging mechanism. Future studies to identify the molecules trafficked into spines by invading MTs, and the conditions under which this trafficking occurs, will be necessary to determine whether MTs act as a substrate for spine-specific modification of “tagged” synapses.
Given the diversity of functions already attributed to MTs, it is likely that MTs serve numerous functions related to synaptic maintenance and plasticity. However, even after activation of synaptic NMDARs, MT entry into spines is still a rare event, occurring only transiently in a subset of spines. Here we have discovered that MTs actually enter a relatively large proportion of spines that have recently experienced NMDAR-mediated calcium influx, and in particular MTs appear to target spines that exhibit large calcium-dependent increases in F-actin content. Thus, rather than entering a tiny fraction of spines at random, MTs appear to target spines that are undergoing substantial activity-dependent change in a regulated manner.
Footnotes
This work was supported by grants from National Institutes of Health (NIH; F31-NS071816, T90-DK070079, and T01-GM07507) to E.B.M.; and the Dana Foundation, Whitehall Foundation, and NIH (R01-064014) to E.W.D. We thank the members of the Dent laboratory, Tim Gomez, Bill Bement, Matt Jones, and Justin Williams, for their critical comments on the experiments and the manuscript.
References
- Biou V, Brinkhaus H, Malenka RC, Matus A. Interactions between drebrin and Ras regulate dendritic spine plasticity. Eur J Neurosci. 2008;27:2847–2859. doi: 10.1111/j.1460-9568.2008.06269.x. [DOI] [PubMed] [Google Scholar]
- Dent EW, Kalil K. Axon branching requires interactions between dynamic microtubules and actin filaments. J Neurosci. 2001;21:9757–9769. doi: 10.1523/JNEUROSCI.21-24-09757.2001. [DOI] [PMC free article] [PubMed] [Google Scholar]
- Dent EW, Kwiatkowski AV, Mebane LM, Philippar U, Barzik M, Rubinson DA, Gupton S, Van Veen JE, Furman C, Zhang J, Alberts AS, Mori S, Gertler FB. Filopodia are required for cortical neurite initiation. Nat Cell Biol. 2007;9:1347–1359. doi: 10.1038/ncb1654. [DOI] [PubMed] [Google Scholar]
- Dent EW, Merriam EB, Hu X. The dynamic cytoskeleton: backbone of dendritic spine plasticity. Curr Opin Neurobiol. 2011a;21:175–181. doi: 10.1016/j.conb.2010.08.013. [DOI] [PMC free article] [PubMed] [Google Scholar]
- Dent EW, Gupton SL, Gertler FB. The growth cone cytoskeleton in axon outgrowth and guidance. Cold Spring Harb Perspect Biol. 2011b;3:a001800. doi: 10.1101/cshperspect.a001800. [DOI] [PMC free article] [PubMed] [Google Scholar]
- Ferhat L. Potential role of drebrin a, an F-actin binding protein, in reactive synaptic plasticity after pilocarpine-induced seizures: functional implications in epilepsy. Int J Cell Biol. 2012;2012:474351. doi: 10.1155/2012/474351. [DOI] [PMC free article] [PubMed] [Google Scholar]
- Fortin DA, Davare MA, Srivastava T, Brady JD, Nygaard S, Derkach VA, Soderling TR. Long-term potentiation-dependent spine enlargement requires synaptic Ca2+-permeable AMPA receptors recruited by CaM-kinase I. J Neurosci. 2010;30:11565–11575. doi: 10.1523/JNEUROSCI.1746-10.2010. [DOI] [PMC free article] [PubMed] [Google Scholar]
- Fukazawa Y, Saitoh Y, Ozawa F, Ohta Y, Mizuno K, Inokuchi K. Hippocampal LTP is accompanied by enhanced F-actin content within the dendritic spine that is essential for late LTP maintenance in vivo. Neuron. 2003;38:447–460. doi: 10.1016/S0896-6273(03)00206-X. [DOI] [PubMed] [Google Scholar]
- Georges PC, Hadzimichalis NM, Sweet ES, Firestein BL. The yin-yang of dendrite morphology: unity of actin and microtubules. Mol Neurobiol. 2008;38:270–284. doi: 10.1007/s12035-008-8046-8. [DOI] [PubMed] [Google Scholar]
- Geraldo S, Khanzada UK, Parsons M, Chilton JK, Gordon-Weeks PR. Targeting of the F-actin-binding protein drebrin by the microtubule plus-tip protein EB3 is required for neuritogenesis. Nat Cell Biol. 2008;10:1181–1189. doi: 10.1038/ncb1778. [DOI] [PubMed] [Google Scholar]
- Gu J, Firestein BL, Zheng JQ. Microtubules in dendritic spine development. J Neurosci. 2008;28:12120–12124. doi: 10.1523/JNEUROSCI.2509-08.2008. [DOI] [PMC free article] [PubMed] [Google Scholar]
- Hayashi K, Shirao T. Change in the shape of dendritic spines caused by overexpression of drebrin in cultured cortical neurons. J Neurosci. 1999;19:3918–3925. doi: 10.1523/JNEUROSCI.19-10-03918.1999. [DOI] [PMC free article] [PubMed] [Google Scholar]
- Hebb DO. The organization of behavior: a neuropsychological theory. New York: Wiley; 1949. [Google Scholar]
- Hering H, Sheng M. Activity-dependent redistribution and essential role of cortactin in dendritic spine morphogenesis. J Neurosci. 2003;23:11759–11769. doi: 10.1523/JNEUROSCI.23-37-11759.2003. [DOI] [PMC free article] [PubMed] [Google Scholar]
- Honkura N, Matsuzaki M, Noguchi J, Ellis-Davies GC, Kasai H. The subspine organization of actin fibers regulates the structure and plasticity of dendritic spines. Neuron. 2008;57:719–729. doi: 10.1016/j.neuron.2008.01.013. [DOI] [PubMed] [Google Scholar]
- Hu X, Viesselmann C, Nam S, Merriam E, Dent EW. Activity-dependent dynamic microtubule invasion of dendritic spines. J Neurosci. 2008;28:13094–13105. doi: 10.1523/JNEUROSCI.3074-08.2008. [DOI] [PMC free article] [PubMed] [Google Scholar]
- Hu X, Ballo L, Pietila L, Viesselmann C, Ballweg J, Lumbard D, Stevenson M, Merriam E, Dent EW. BDNF-induced increase of PSD-95 in dendritic spines requires dynamic microtubule invasions. J Neurosci. 2011;31:15597–15603. doi: 10.1523/JNEUROSCI.2445-11.2011. [DOI] [PMC free article] [PubMed] [Google Scholar]
- Ivanov A, Esclapez M, Pellegrino C, Shirao T, Ferhat L. Drebrin A regulates dendritic spine plasticity and synaptic function in mature cultured hippocampal neurons. J Cell Sci. 2009a;122:524–534. doi: 10.1242/jcs.033464. [DOI] [PubMed] [Google Scholar]
- Ivanov A, Esclapez M, Ferhat L. Role of drebrin A in dendritic spine plasticity and synaptic function: implications in neurological disorders. Commun Integr Biol. 2009b;2:268–270. doi: 10.4161/cib.2.3.8166. [DOI] [PMC free article] [PubMed] [Google Scholar]
- Jaworski J, Kapitein LC, Gouveia SM, Dortland BR, Wulf PS, Grigoriev I, Camera P, Spangler SA, Di Stefano P, Demmers J, Krugers H, Defilippi P, Akhmanova A, Hoogenraad CC. Dynamic microtubules regulate dendritic spine morphology and synaptic plasticity. Neuron. 2009;61:85–100. doi: 10.1016/j.neuron.2008.11.013. [DOI] [PubMed] [Google Scholar]
- Johnson HW, Schell MJ. Neuronal IP3 3-kinase is an F-actin-bundling protein: role in dendritic targeting and regulation of spine morphology. Mol Biol Cell. 2009;20:5166–5180. doi: 10.1091/mbc.E09-01-0083. [DOI] [PMC free article] [PubMed] [Google Scholar]
- Kaech S, Banker G. Culturing hippocampal neurons. Nat Protoc. 2006;1:2406–2415. doi: 10.1038/nprot.2006.356. [DOI] [PubMed] [Google Scholar]
- Kapitein LC, Yau KW, Gouveia SM, van der Zwan WA, Wulf PS, Keijzer N, Demmers J, Jaworski J, Akhmanova A, Hoogenraad CC. NMDA receptor activation suppresses microtubule growth and spine entry. J Neurosci. 2011;31:8194–8209. doi: 10.1523/JNEUROSCI.6215-10.2011. [DOI] [PMC free article] [PubMed] [Google Scholar]
- Kojima N, Shirao T. Synaptic dysfunction and disruption of postsynaptic drebrin-actin complex: a study of neurological disorders accompanied by cognitive deficits. Neurosci Res. 2007;58:1–5. doi: 10.1016/j.neures.2007.02.003. [DOI] [PubMed] [Google Scholar]
- Korobova F, Svitkina T. Molecular architecture of synaptic actin cytoskeleton in hippocampal neurons reveals a mechanism of dendritic spine morphogenesis. Mol Biol Cell. 2010;21:165–176. doi: 10.1091/mbc.E09-07-0596. [DOI] [PMC free article] [PubMed] [Google Scholar]
- Lu W, Man H, Ju W, Trimble WS, MacDonald JF, Wang YT. Activation of synaptic NMDA receptors induces membrane insertion of new AMPA receptors and LTP in cultured hippocampal neurons. Neuron. 2001;29:243–254. doi: 10.1016/S0896-6273(01)00194-5. [DOI] [PubMed] [Google Scholar]
- Martin KC, Kosik KS. Synaptic tagging—who's it? Nat Rev Neurosci. 2002;3:813–820. doi: 10.1038/nrn942. [DOI] [PubMed] [Google Scholar]
- Matsuzaki M, Honkura N, Ellis-Davies GC, Kasai H. Structural basis of long-term potentiation in single dendritic spines. Nature. 2004;429:761–766. doi: 10.1038/nature02617. [DOI] [PMC free article] [PubMed] [Google Scholar]
- Merriam EB, Lumbard DC, Viesselmann C, Ballweg J, Stevenson M, Pietila L, Hu X, Dent EW. Dynamic microtubules promote synaptic NMDA receptor-dependent spine enlargement. PLoS ONE. 2011;6:e27688. doi: 10.1371/journal.pone.0027688. [DOI] [PMC free article] [PubMed] [Google Scholar]
- Mizui T, Takahashi H, Sekino Y, Shirao T. Overexpression of drebrin A in immature neurons induces the accumulation of F-actin and PSD-95 into dendritic filopodia, and the formation of large abnormal protrusions. Mol Cell Neurosci. 2005;30:630–638. [PubMed] [Google Scholar]
- Okamoto K, Nagai T, Miyawaki A, Hayashi Y. Rapid and persistent modulation of actin dynamics regulates postsynaptic reorganization underlying bidirectional plasticity. Nat Neurosci. 2004;7:1104–1112. doi: 10.1038/nn1311. [DOI] [PubMed] [Google Scholar]
- Redondo RL, Morris RG. Making memories last: the synaptic tagging and capture hypothesis. Nat Rev Neurosci. 2011;12:17–30. doi: 10.1038/nrn2963. [DOI] [PubMed] [Google Scholar]
- Riedl J, Crevenna AH, Kessenbrock K, Yu JH, Neukirchen D, Bista M, Bradke F, Jenne D, Holak TA, Werb Z, Sixt M, Wedlich-Soldner R. Lifeact: a versatile marker to visualize F-actin. Nat Methods. 2008;5:605–607. doi: 10.1038/nmeth.1220. [DOI] [PMC free article] [PubMed] [Google Scholar]
- Saneyoshi T, Hayashi Y. The Ca2+ and Rho GTPase signaling pathways underlying activity-dependent actin remodeling at dendritic spines. Cytoskeleton (Hoboken) 2012;69:545–554. doi: 10.1002/cm.21037. [DOI] [PubMed] [Google Scholar]
- Schaefer AW, Kabir N, Forscher P. Filopodia and actin arcs guide the assembly and transport of two populations of microtubules with unique dynamic parameters in neuronal growth cones. J Cell Biol. 2002;158:139–152. doi: 10.1083/jcb.200203038. [DOI] [PMC free article] [PubMed] [Google Scholar]
- Schapitz IU, Behrend B, Pechmann Y, Lappe-Siefke C, Kneussel SJ, Wallace KE, Stempel AV, Buck F, Grant SG, Schweizer M, Schmitz D, Schwarz JR, Holzbaur EL, Kneussel M. Neuroligin 1 is dynamically exchanged at postsynaptic sites. J Neurosci. 2010;30:12733–12744. doi: 10.1523/JNEUROSCI.0896-10.2010. [DOI] [PMC free article] [PubMed] [Google Scholar]
- Stepanova T, Slemmer J, Hoogenraad CC, Lansbergen G, Dortland B, De Zeeuw CI, Grosveld F, van Cappellen G, Akhmanova A, Galjart N. Visualization of microtubule growth in cultured neurons via the use of EB3-GFP (end-binding protein 3-green fluorescent protein) J Neurosci. 2003;23:2655–2664. doi: 10.1523/JNEUROSCI.23-07-02655.2003. [DOI] [PMC free article] [PubMed] [Google Scholar]
- Suter DM, Schaefer AW, Forscher P. Microtubule dynamics are necessary for SRC family kinase-dependent growth cone steering. Curr Biol. 2004;14:1194–1199. doi: 10.1016/j.cub.2004.06.049. [DOI] [PubMed] [Google Scholar]
- Takahashi H, Mizui T, Shirao T. Downregulation of drebrin A expression suppresses synaptic targeting of NMDA receptors in developing hippocampal neurones. J Neurochem. 2006;97(Suppl 1):110–115. doi: 10.1111/j.1471-4159.2005.03536.x. [DOI] [PubMed] [Google Scholar]
- Tian L, Hires SA, Mao T, Huber D, Chiappe ME, Chalasani SH, Petreanu L, Akerboom J, McKinney SA, Schreiter ER, Bargmann CI, Jayaraman V, Svoboda K, Looger LL. Imaging neural activity in worms, flies and mice with improved GCaMP calcium indicators. Nat Methods. 2009;6:875–881. doi: 10.1038/nmeth.1398. [DOI] [PMC free article] [PubMed] [Google Scholar]
- Viesselmann C, Ballweg J, Lumbard D, Dent EW. Nucleofection and primary culture of embryonic mouse hippocampal and cortical neurons. J Vis Exp. 2011;47:2373. doi: 10.3791/2373. [DOI] [PMC free article] [PubMed] [Google Scholar]
- Wagner W, Brenowitz SD, Hammer JA., 3rd Myosin-Va transports the endoplasmic reticulum into the dendritic spines of Purkinje neurons. Nat Cell Biol. 2011;13:40–48. doi: 10.1038/ncb2132. [DOI] [PMC free article] [PubMed] [Google Scholar]
- Webb DJ, Zhang H, Majumdar D, Horwitz AF. Alpha5 integrin signaling regulates the formation of spines and synapses in hippocampal neurons. J Biol Chem. 2007;282:6929–6935. doi: 10.1074/jbc.M610981200. [DOI] [PMC free article] [PubMed] [Google Scholar]
- Wegner AM, Nebhan CA, Hu L, Majumdar D, Meier KM, Weaver AM, Webb DJ. N-wasp and the arp2/3 complex are critical regulators of actin in the development of dendritic spines and synapses. J Biol Chem. 2008;283:15912–15920. doi: 10.1074/jbc.M801555200. [DOI] [PMC free article] [PubMed] [Google Scholar]