

Abstract
The ocular motor system consists of three nerves which innervate six muscles to control eye movements. In humans, defective development of this system leads to eye movement disorders, such as Duane Retraction Syndrome, which can result from mutations in the α2-chimaerin signaling molecule. We have used the zebrafish to model the role of α2-chimaerin during development of the ocular motor system. We first mapped ocular motor spatiotemporal development, which occurs between 24 and 72 h postfertilization (hpf), with the oculomotor nerve following an invariant sequence of growth and branching to its muscle targets. We identified 52 hpf as a key axon guidance “transition,” when oculomotor axons reach the orbit and select their muscle targets. Live imaging and quantitation showed that, at 52 hpf, axons undergo a switch in behavior, with striking changes in the dynamics of filopodia. We tested the role of α2-chimaerin in this guidance process and found that axons expressing gain-of-function α2-chimaerin isoforms failed to undergo the 52 hpf transition in filopodial dynamics, leading to axon stalling. α2-chimaerin loss of function led to ecotopic and misguided branching and hypoplasia of oculomotor axons; embryos had defective eye movements as measured by the optokinetic reflex. Manipulation of chimaerin signaling in oculomotor neurons in vitro led to changes in microtubule stability. These findings demonstrate that a correct level of α2-chimaerin signaling is required for key oculomotor axon guidance decisions, and provide a zebrafish model for Duane Retraction Syndrome.
Introduction
The ocular motor system of vertebrates consists of three cranial nerves and six muscles, which control eye movements. This system is well conserved across species, including humans, chicks, and fish. The oculomotor nerve (OMN) innervates four extraocular muscles (EOMs), consisting of the inferior oblique (IO), inferior rectus (IR), medial rectus (MR), and superior rectus (SR). The abducens and trochlear nerves innervate one muscle each: the lateral rectus (LR) and the superior oblique (SO), respectively (Guthrie, 2007). The ocular motor system presents a promising model of axon guidance and is clinically important, as its aberrant development leads to human eye movement disorders, such as strabismus. Yet very little is known of the molecular mechanisms that underlie normal and abnormal ocular motor development.
We have previously mapped the development of the ocular motor system in the chick embryo and showed that ocular motor axon guidance is orchestrated by a combination of the chemoattractant/growth-promoting factors CXCL12 and HGF and the chemorepellent Sema3A (Chilton and Guthrie, 2004; Lerner et al., 2010; Ferrario et al., 2012). A pivotal factor in ocular motor development has recently transpired to be the signaling protein α2-chimaerin (α2-chn), a RacGAP with a key role in regulating the cytoskeleton (Yang and Kazanietz, 2007). Mutations in α2-chn cause the DURS2 variant of Duane Retraction Syndrome (DRS), a congenital form of strabismus. Neuroimaging studies of DURS2 patients reveal ocular motor axon guidance defects, including absence of the abducens nerve and ectopic branching and/or hypoplasia of the OMN (Demer et al., 2006, 2007).
Human DURS2 mutations are thought to confer gain of function on α2-chn (Colón-González et al., 2008; Miyake et al., 2008), leading to hyperactivation of downstream signaling pathways. We previously found that expression of α2-chn isoforms containing such identified human mutations or shRNA-mediated knockdown of α2-chn in the OMN of chick embryos led to axon guidance defects (Miyake et al., 2008; Ferrario et al., 2012). Moreover, we demonstrated that α2-chn is a required component of both chemoattractant (CXCL12 and HGF) and chemorepellent (Sema3A) signaling pathways in the ocular motor system (Miyake et al., 2008; Lerner et al., 2010; Ferrario et al., 2012).
To gain more extensive insights into the development of the ocular motor system and DRS, we exploited the unique advantages of the zebrafish embryo to investigate the dynamic behavior of ocular motor nerves. In this study, we describe and map the development of the ocular motor projection between 24 and 72 h postfertilization (hpf) and use live imaging to identify a key “transition” in axon guidance behavior. We also test the effects of manipulating α2-chn signaling in single axons and at the population level on the formation of ocular motor projections and on eye movements. The results of these experiments led us to propose that α2-chn transduces axon guidance signals to regulate cytoskeletal motility and produce ocular motor nerve–muscle topography. The zebrafish thus offers a promising system to study DRS with relation to humans.
Materials and Methods
Fish breeding and maintenance.
Zebrafish were maintained at 28.5°C with a 10/14 h light/dark cycle; embryos of either sex were collected after natural spawning and staged by hours postfertilization as previously described (Kimmel et al., 1995). Wild-type (wt), Isl1:GFP (Higashijima et al., 2000), and α-actin:RFP (Hollway et al., 2007; Elworthy et al., 2008) zebrafish strains were used in the present study.
Immunohistochemistry.
Whole-mount single or double antibody labeling of larvae of either sex was performed as previously described (Hunter et al., 2011). To label synaptic components, a permeabilization step was performed (4 × 1 h incubation in Triton 2%/DMSO, 1% in PBS). The following antibodies were used: anti-GFP (1:500; Abcam), anti-acetylated tubulin (1:1000; T7451; Sigma-Aldrich), anti-acetylated tubulin (1:1000; D20G3; Cell Signaling Technology), anti-SV2 (1:200; Developmental Studies Hybridoma Bank, University of Iowa), and anti-myosin heavy chain (1:250; A4.1025; Developmental Studies Hybridoma Bank). A tetramethylrhodamine-α-bungarotoxin conjugate (1:1000; Invitrogen) was used for staining of AChR postsynaptic components.
Constructs.
UAS-chimaerin constructs were generated by introducing a previously cloned 2.6 kb human α2-chimaerin cDNA (Miyake et al., 2008) fused to YFP into a 5′UAS-GFP expression vector (Ben Fredj et al., 2010) between the NheI and AflII restrictions sites. Zebrafish α2-chimaerin has 87% similarity to the human isoform at the amino acid level. In addition to wt α2-chimaerin (5′UAS-WT-α2-chn), a mutant form harboring the G228S substitution (5′UAS-G228S-α2-chn) was also generated by the same subcloning strategy. A 5′UAS-GFP construct was used as a control. To drive the expression of these, we used an α-tubulin-Gal4 construct (kind gift from Dr. Reinhard Köster, Helmholtz Zentrum München) (Köster and Fraser, 2001).
DNA microinjection.
Zebrafish larvae of either sex were microinjected with the above constructs diluted at 25 ng/ml each in 1× Danieau solution (58 mm NaCl, 0.7 mm KCl, 0.4 mm MgSO4, 0.6 mm Ca(NO3)2, and 5 mm HEPES, pH 7.6) and injected into one cell stage embryos with glass micropipettes.
Morpholino design and microinjection.
Two different morpholinos were used to suppress α2-chn expression, both obtained from Gene Tools. These were a previously published MO1 (Leskow et al., 2006), targeting the 5′UTR of α2-chn mRNA and MO2 targeting the first intron/exon boundary of the α2-chn noncoding sequence. For each of these, a 5 bp mismatch was used as control (mismatched nucleotides are shown in lowercase below). Sequences are as follows: MO1, 5′-GCCATTGCAGACAGTGATTCAGCCG-3′; mismatch MO1 control, 5′-GCgATTcCAGACAcTGATTgAGgCG-3′; MO2, 5′-GAGGACTCACCGAACACATGGATGG-3′; and mismatch MO2 control, 5′-GAcGACTgACCcAACAgATGGATcG-3′. A total of 3 ng of each of these morpholinos was injected into one cell stage embryos of either sex.
Morpholino RT-PCR controls.
Total RNA from morpholino-injected 48 hpf embryos of either sex was obtained by homogenizing 30–50 larvae in 1 ml of Trizol (Ambion). After homogenization, total RNA was extracted in chloroform and isopropanol. A total of 4 μl of the extracted total RNA was used to obtain first-strand cDNA in a reaction with Superscript III Reverse Transcriptase (Invitrogen) according to the manufacturer's instructions. Random primers (Promega) were used for this reaction. The cDNA obtained in this fashion was then used in a PCR to detect the presence of the presplicing and postsplicing forms of α2-chn mRNA with the following primers: exon 1, 5′-TCAGACACCGGGCAATTCTC-3′; intron 1 reverse, 5′-CTCCTGAGGGGAAAAACAAACA-3′; and exon 2 reverse, 5′-ACCGGGGGTCTGACTCATC-3′.
These primers were designed to amplify a 196 bp fragment when using exon 1 and exon 2 reverse and a 391 bp one when using exon 1 and intron 1 reverse, allowing for easy distinction between both PCR products.
Microscopy and image analysis.
After dechorionation, embryos of either sex were embedded in low-melting point agarose (Sigma) 1.5% in 1× Danieau solution and mounted on a SuperGlue (Henkel) lined glass slide. Imaging was performed using a 2-photon microscope (Prairie Technologies) with an upright FLUOVIEW FV1000 microscope (Olympus) and a 2-photon Mai-Tai HP laser (Spectra Physics) under excitation wavelengths of 920 or 780 nm, with 40× (NA 0.8) and 60× (NA 0.9) water-immersion objectives. When acquiring z-stacks, optical sections were spaced by 1 μm. Image processing was performed using Fiji (http://fiji.sc/wiki/index.php/Fiji). Single neurons were extracted from z-stacks using the Simple Neurite Tracer Plugin (Longair et al., 2011). Time-lapse imaging was performed by repeating predefined z-stacks with 512 × 512 pixel dimensions over a period of time every 2 or 5 min, depending on the experiment. For imaging of filopodial dynamics, a 2.15× optical zoom was applied before acquiring images. These z-stacks series were then converted to a movie with 7 frames/s using Fiji.
Analysis of filopodial dynamics.
Time-lapse movies were obtained as described above, with pixel dimensions 512 × 512 from embryos of either sex at 49 and 54 hpf, microinjected with the indicated constructs. Visible axons were traced back to the oculomotor nucleus by extraction using the Simple Neurite Tracer Fiji Plugin to determine the number of neurons visible. Before counting, γ correction and a median filter were applied to the whole movie. Individual filopodia were then counted using the Cell Counter Fiji plugin (Kurt de Vos, University of Sheffield). Only the filopodia appearing during the movie were counted. Individual frames of the time-lapse movies were separated by 2 min, and the filopodial appearance rate was quantitated from this.
The tips of the filopodia at maximum length were tracked and marked using the Cell Counter Fiji Plugin. The center of the growth cone (or weighted center if multiple growth cones) was also marked, and its coordinates served as origin. The coordinates of the filopodia tips were then calculated with respect to this origin. Filopodia were approximated to vectors from the origin to their tips. The length and angle of each vector were also calculated using the main axon bundle as a y-axis. These vectors were then plotted on a vector plot using SigmaPlot 12 (Systat Software). After binning the filopodia into 15° categories, these were also represented as a radar plot. Furthermore, the number of filopodia found in the 180° to 270° angle interval was quantitated.
Optokinetic response (OKR) assays.
At 4 d postfertilization (dpf), wt or morpholino-injected embryos of either sex were placed dorsal side up in a 35 mm Petri dish filled with 6% methylcellulose, and their OKR was assayed as previously described (Brockerhoff, 2006). The number of fish within each group exhibiting slow tracking movements was recorded. For those exhibiting such movements, the number of fast reset movements occurring within 30 s was recorded for both clockwise and counterclockwise rotation of the drum, corresponding to movements of the left and right eye, respectively.
Primary oculomotor neuron cultures and in vitro quantification.
Fertilized hens' eggs (Henry Stewart Farm) were incubated at 37°C for 5 d and then used for neuronal cultures as described below. Oculomotor nuclei were isolated by removal of the mesenchyme from the ventral midbrain of E5 chick embryos of either sex and dissection of the nuclei away from the floor plate and dorsal tissues. Nuclei were placed in prewarmed L15 medium (Invitrogen), washed in calcium and magnesium-free Hank's Balanced Salt Solution (Invitrogen), and incubated for 20 min at 37°C in trypsin solution. Trypsin was replaced by trypsin-inhibitor solution, and the tissue was triturated and resuspended in Neurobasal medium with B27 supplement (Invitrogen), chick embryo extract, and CNTF (10 ng/ml; R&D Systems). Cells were transfected with α2-chimaerin shRNA or control constructs as previously described (Ferrario et al., 2012) and plated at 120,000 per well on coverslips coated with poly-d-ornithine and laminin (Sigma). After 48 h in culture, coverslips were fixed in freshly made PHEM buffer (60 mm PIPES, 25 mm HEPES, 5 mm EGTA, 2 mm MgCl2, pH 6.9) and then immunostained using rabbit polyclonal anti-detyrosinated tubulin antibody (1:1000, AB3201, Millipore), rat monoclonal anti-tyrosinated tubulin (1:1000, ab6160, Abcam), and with secondary antibodies AlexaFluor-568 goat anti-rabbit and AlexaFluor-488 goat anti-rat (1:500; Invitrogen). Stable and unstable tubulin areas were calculated in the distal 20 μm of noncollapsed growth cones using Fiji. These areas where used to obtain a stable over unstable ratio in both control and transfected neurons.
Statistical analyses.
Statistical analyses were performed with SigmaPlot 12 (Systat Software). Data were analyzed using Kruskal–Wallis one-way ANOVA for OKR. Filopodia appearance rates were compared by two-way ANOVA with Holm–Sidak pairwise comparison. For filopodial dynamics, the percentage of filopodia present within the 180° to 270° quadrant for each movie analyzed and appearance rate were compared by two-way ANOVA with Holm–Sidak pairwise comparison. OKR data were analyzed with Kruskal–Wallis one-way ANOVA.
Results
Ocular motor development follows an invariant sequence from 24 to 72 hpf
In the zebrafish, the arrangement of the six EOMs is similar to that in the chick (Easter and Nicola, 1996; Chilton and Guthrie, 2004). There are three “ocular motor” nerves: the OMN innervates four muscles, whereas the abducens and trochlear nerves innervate one muscle each (see Fig. 2E). The positions of the muscles innervated by the OMN are as follows relative to the nerve origin: the IO lies distally, the SR lies proximally, with the IR and MR at intermediate positions. As in other species, the abducens nerve innervates the LR muscle, whereas the trochlear nerve innervates the SO muscle.
Figure 2.
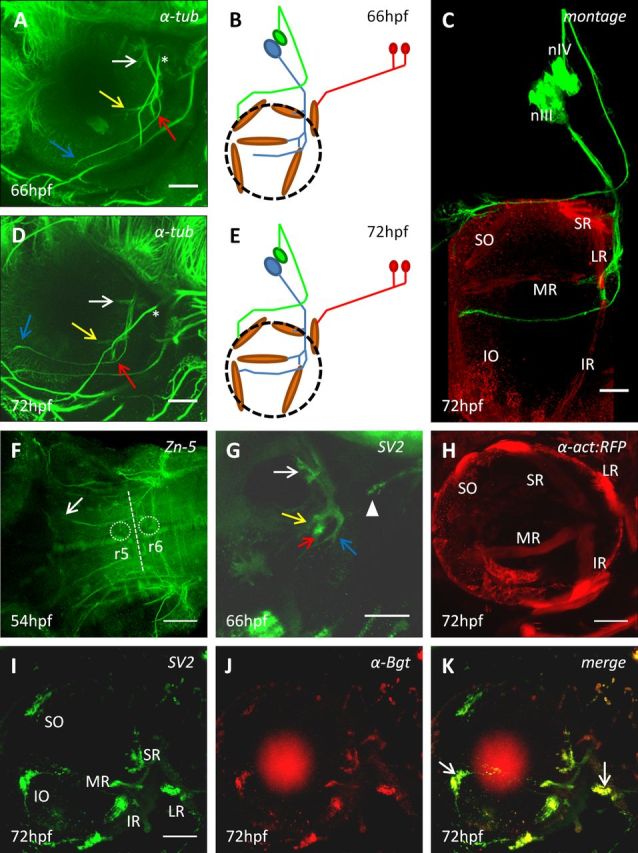
Later stages of development of the ocular motor system. Multiphoton imaging lateral views of wt embryos immunostained for α-tubulin (A, D), presynaptic vesicles (SV2) (G, I), or acetycholine receptors (αBgt) (J) at indicated stages. K, Merged image of both I and J (red circle in these images represents background staining from retina). Montage of live imaging of Isl1-GFP with α-tubulin and myosin heavy chain (myHC) immunostaining to display the pathway of the OMN and trochlear nerve at 72 hpf (C). Multiphoton ventral view of a wt embryo immunostained with Zn-5 antibody (F). r5,6, Rhombomere 5,6. Live multiphoton lateral view of a α-actin:RFP embryo at 72 hpf (H). Yellow and red arrows indicate nerve branches to the MR and IR muscles, respectively; blue arrow indicates the nerve branch toward the IO muscle; white arrow indicates the nerve branch to the SR muscle. A, B, *Branch of the trigeminal nerve. F, G, Arrow and arrowhead indicate abducens nerve. Schematics of ocular motor development at 66 hpf (B) and 72 hpf (E) displayed as in Figure 1. All panels, except F, are oriented with rostral left and dorsal to the top, as in Figure 1. Scale bars, 50 μm.
To map ocular motor development, we used live imaging and time-lapse of the Islet-1:GFP (Isl1:GFP) transgenic line (Higashijima et al., 2000) in which GFP is reported to be expressed in all oculomotor neurons, with the exception of those innervating the IO. Comparison of anti-GFP and anti-α-tubulin immunostaining of the OMN projection in Isl1:GFP embryos confirmed this. EOMs were visualized using an α-actin:RFP line in which RFP is expressed in mature muscle cells (Higashijima et al., 1997; Hollway et al., 2007). We combined this analysis with single and double immunofluorescent labeling using antibodies to α-tubulin or GFP (for Isl1:GFP embryos), for motor neurons and myosin heavy chain for muscles.
Live imaging first visualized the oculomotor nucleus (nIII) in the ventral midbrain at 24 hpf (Fig. 1A). Neural projections heading caudally and ventrally were visible from 30 hpf with small processes defasciculating from the nerve (Fig. 1B, arrowheads, C). Time-lapse movies revealed that these processes were numerous and motile and decreased in number until 35 hpf when the nerve formed a tight bundle. At 44–48 hpf, the nerve appeared compact with no visible defasciculation (Fig. 1D,E). During this time, the oculomotor nucleus (nIII) displayed two distinct subdivisions (Fig. 1D, arrows); and by 48 hpf, the nerve had reached the dorsal edge of the eye (Fig. 1E, arrow). The ciliary ganglion, which is Islet-1-positive and is a target for parasympathetic oculomotor axons, was visible at this stage lying close to the pathway of the nerve (Fig. 1E, dotted circle).
Figure 1.
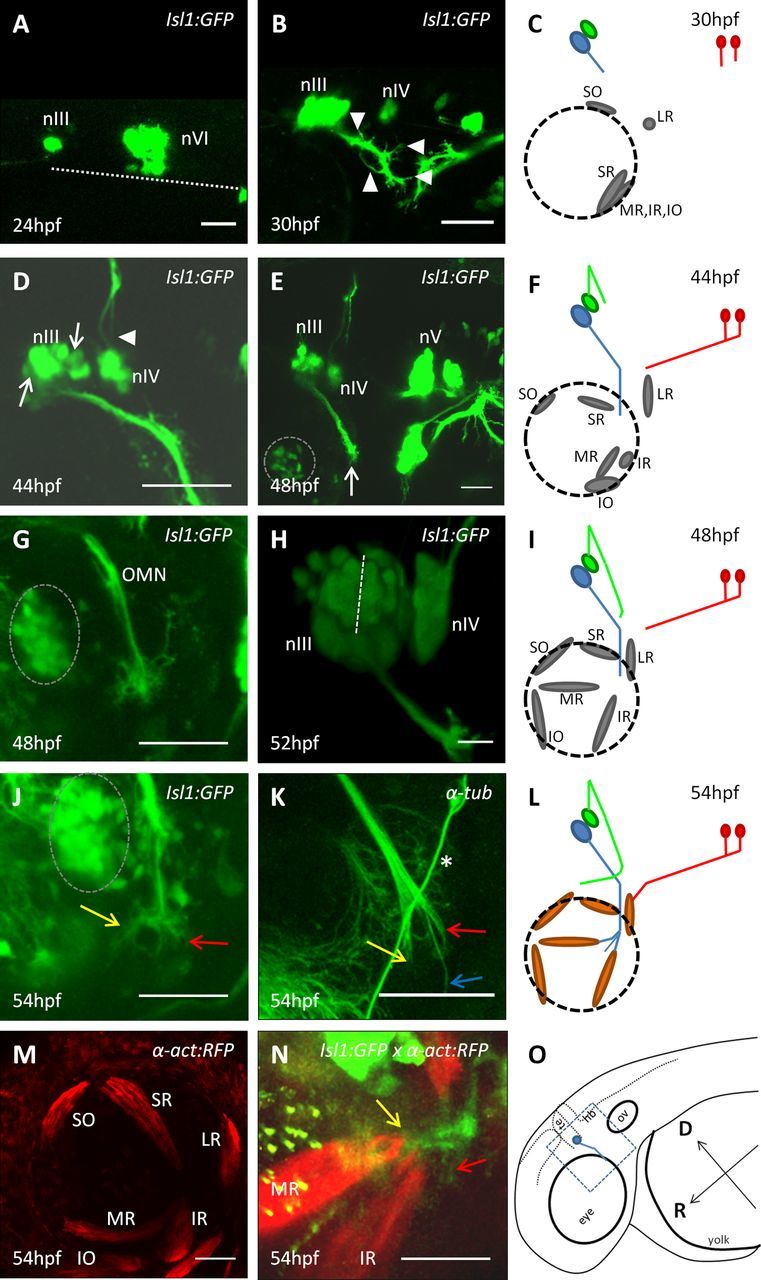
Early development of the ocular motor system. Multiphoton lateral views of live Isl1:GFP (A, B, D, E, G, H, J), α-act:RFP (M), and Isl1:GFP × α-act:RFP (N) embryos or wt embryos immunostained for α-tubulin (K) at indicated stages. nIII, oculomotor nucleus; nIV, trochlear nucleus; nV, trigeminal nucleus. Schematic diagrams of ocular motor development at 30 hpf (C), 44 hpf (F), 48 hpf (I), and 54 hpf (L). O, Schematic of the zebrafish head at 48 hpf, showing the OMN in blue, the area imaged (blue square), and the orientation. D, Dorsal; R, rostral; te, tectum; hb, hindbrain; ov, otic vesicle. Blue, green, and red represent the OMN, trochlear, and abducens nerves, respectively; gray represents muscle progenitors; orange represents myosin-positive muscles. All panels are oriented with rostral left and dorsal to the top. A, Dotted line indicates edge of neural tube. H, Dotted line indicates putative subdivision between oculomotor dorsal subnuclei. Dotted circles represent ciliary ganglion. K, *Branch of trigeminal nerve. Yellow and red arrows indicate nerve branches to the MR and IR muscles, respectively; blue arrow indicates the nerve branch toward the IO muscle. Scale bars, 50 μm.
The trochlear nucleus (nIV) was first detectable at 30 hpf, suggesting that these neurons become postmitotic slightly later than oculomotor neurons (Fig. 1B). The trochlear nerve is the only motor nerve to project dorsally and then cross the midline before exiting the neuroepithelium and reorienting ventrally to project to the contralateral SO muscle. Live imaging revealed that, at 44 hpf, the trochlear axons had extended dorsally and crossed the midline (Fig. 1D, arrowhead) and, at 48 hpf, had exited the neuroepithelium and changed direction to grow ventrally toward the eye (Fig. 1I). As the abducens nerve was not labeled in the Isl1:GFP line, we used whole-mount anti-Zn5 immunostaining to trace its development (Ott et al., 2001). At 30 hpf, imaging from the ventral aspect of the hindbrain showed that abducens axons had exited rhombomere 5 neuroepithelium ventrally and projected rostrally by 54 hpf (data not shown; see Fig. 2F). By 54 hpf, we could identify muscle locations in α-actin:RFP transgenic fish (Fig. 1M); and based on this, it is likely that the abducens nerve has reached its LR target by 54 hpf (Fig. 1L), whereas the trochlear nerve is still en route to the SO.
A key axon guidance transition of the OMN occurs at 52 hpf
Focusing on the further development of the OMN in the Isl1:GFP fish, between 48 and 54 hpf, a second phase of defasciculation occurred, and time-lapse imaging showed that this corresponded with a “stalling” period with little net growth (Fig. 1I). At this time, the nerve extended a corona of filopodia (Fig. 1G), which decreased over time until the projection hollowed out to create two branches to the MR and IR (Fig. 1J, yellow and red arrows, respectively). As the IO branch is not labeled in this line, α-tubulin immunostaining was also used and revealed three branches at 54 hpf (Fig. 1K, arrows). One branch was noticeably thinner and longer than the remaining two and corresponds with a forming branch to the IO muscle (Fig. 1K, blue arrow). The two remaining branches (Fig. 1K, yellow and red arrows) corresponded with those to the MR and IR muscles identified in the Isl1:GFP line. Time-lapse imaging of the whole nerve at 54 hpf in Isl1:GFPxα-actin:RFP embryos also suggested that nerve branches started to contact these two muscle targets, which derive from a paired anlagen (Noden et al., 1999) and appeared closely apposed at their dorsal side (Fig. 1N).
These observations suggest that, in the zebrafish, the first major oculomotor guidance event generates three branches. These branches are distinct by 54 hpf, so the transition itself likely occurs ∼52 hpf. As live imaging showed three possible subdivisions of the nucleus at 52 hpf (Fig. 1H; ventromedial, dorsorostral, and dorsocaudal divisions), this pattern may be generated by the outgrowth of topographically segregated subpopulations of OMN neurons. Immunohistochemical labeling showed that, at 66 hpf, a fourth oculomotor branch to the SR muscle had formed proximally (Fig. 2A, white arrow, B) and that, by 72 hpf, the IO branch had reached the location of its muscle target (Fig. 2D,E). Imaging of α-actin:RFP embryos showed that EOM positions remained the same between 54 and 72 hpf, confirming the inferred identity of the nerve branches and demonstrating that all three cranial nerve projections were complete by 72 hpf (Fig. 2C,H). Reports that zebrafish eye movements start at ∼72 hpf are consistent with this idea (Easter and Nicola, 1996).
Synaptogenesis occurs from 72 hpf
To investigate synaptogenesis, we double-immunostained embryos, using the SV2 antibody to a presynaptic vesicle protein (Buckley and Kelly, 1985) and fluorescently tagged α-bungarotoxin to label postsynaptic acetylcholine receptors. SV2 immunostaining was visible at 66 hpf throughout oculomotor axons, especially the leading edges of the branches to the three proximal muscle targets, suggesting that synaptic proteins were anterogradely transported along axons (Fig. 2G). No α-bungarotoxin labeling was observed before 72 hpf, but at this stage it formed patches in the muscles, which colocalized with SV2 (Fig. 2I–K), suggesting that synaptogenesis was underway by this stage but not earlier. Colocalization was confirmed using Pearson's colocalization coefficient, with the highest values found in the LR, IR, and IO muscles, suggesting that synaptogenesis is most advanced here (Fig. 2K, arrows). These data suggest that synaptogenesis begins at ∼66 hpf and is initiated in all muscles by 72 hpf.
Live imaging of single axons shows refinement of filopodia at the 52 hpf transition
To analyze single axon behavior, we coinjected α-tubulin-Gal4 and 5′UAS-GFP plasmids into one cell stage wt or α-actin:RFP transgenic embryos and acquired time-lapse movies in which individual axon trajectories were analyzed. At 49 hpf, single axons showed numerous filopodia, which were oriented in many directions and often extended over a wide area (Fig. 3A; Movie 1). By contrast, at 54 hpf, single axons extended in the direction of individual muscles and showed a rostral turn (Figs. 3E, F, yellow arrow; and 4A; MR muscle). Time-lapse movies showed that the central domain of the growth cone always progressed and did not show retraction, except on the level of single filopodia (Movie 2). Individual oculomotor axons, which were traced from their cell bodies, have trajectories suggesting that they extended to a single muscle and not to multiple muscle targets (Fig. 3C,D). In these cases, putative muscle positions were determined by comparison with α-actin:RFP transgenic fish at the same stages. Neurons with adjacent cell bodies often extended axons which arborized within the same muscle (data not shown), suggesting that a subnuclear organization may exist.
Figure 3.

Imaging of single OMN neurons. Live-imaging of single neurons within the OMN expressing GFP before (A) or after (B) the transition point. Arrowheads indicate filopodia. Live-imaging (C) and fluorescently-extracted (D) images of neurons within the OMN producing distinct branches at 63 hpf. Colored arrows indicate distinct neural projections. Single neurons expressing either GFP, WT-α2-chn-wt or the G228S-α2-chn mutant form before (E) or after (F) the 52 hpf transition point. The yellow arrow indicates branches growing into the muscle area. *Branching/stalling point. Arrowhead indicates a neural projection heading dorsally from the branching point. Schematic representation of the phenotype observed in these embryos after the transition point (G) with stalling in G228S-α2-chn-expressing neurons. Dotted lines indicate projections heading dorsally in some cases. All panels are oriented with rostral left and dorsal to the top. Scale bars, 25 μm.
Figure 4.
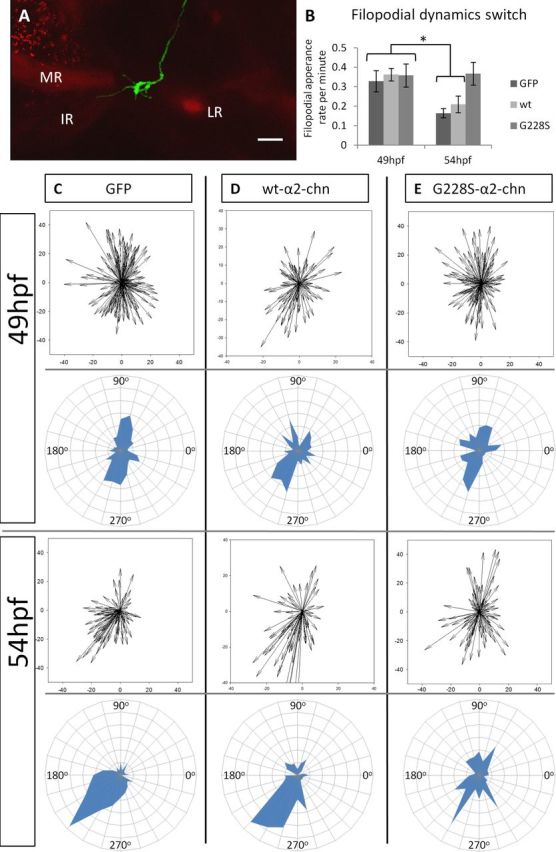
Filopodial dynamics during the 52 hpf transition. A, Illustrative image of a single GFP-expressing neuron within the OMN contacting the MR/IR progenitors in the alpha-actin-RFP line. B, Filopodial appearance rate in single neurons expressing either GFP, WT-α2-chn or the G228S-α2-chn mutant form both before and after the 52 hpf transition. *p <0.001. n = 9, n = 4, and n = 5 neurons, respectively, for 49 hpf. n = 10, n = 8, and n = 6 neurons, respectively, for 54 hpf. There is no significant difference between the rate of filopodial appearance in G228S-α2-chn-expressing neurons compared with GFP-expressing neurons either at 49 or 54 hpf (p = 0.869). C–E, Polar plots and radar plots showing the filopodial distribution before and after the 52 hpf transition in neurons expressing constructs as indicated. C, GFP-expressing neurons; the distribution at 49 and 54 hpf is different (p < 0.001). n = 173 and n = 93 filopodia, respectively. D, WT-α2-chn-expressing neurons; the distribution is different at 49 and 54 hpf (p = 0.037). n = 89 and n = 70 filopodia, respectively. The filopodial distributions for GFP and WT-α2-chn-expressing neurons are not significantly different either before or after (p = 0.417 and p = 0.445, respectively). E, G228S-α2-chn-expressing neurons; the distributions are similar (p = 0.985). n = 128 and n = 89 filopodia for before and after, respectively. The filopodial distributions for G228S-α2-chn-expressing neurons at 49 hpf or 54 hpf are not significantly different from those of either GFP or WT-α2-chn-expressing neurons at 49 hpf (p = 0.513 and p = 0.718, respectively).
Filopodial dynamics before the 52 hpf transition. Time-lapse movie of 3 oculomotor neurons expressing the 5′UAS-GFP construct at 49 hpf.
Filopodial dynamics after the 52 hpf transition. Time-lapse movie of 3 oculomotor neurons expressing the GFP construct at 54 hpf.
We analyzed the numbers and directionality of filopodia before and after this transition using vector plots to show lengths and directions of filopodia, and radar plots to show directions and numbers. The numbers of filopodia produced by growth cones showed a decrease between 49 and 54 hpf (Figs. 3A,B and 4B), and their directionality changed. At 49 hpf, there was no preferred orientation of filopodia, nor was there an increased frequency or length of filopodia in any particular direction (Fig. 4C). These data suggest that, at this time point, individual axons explore their environment without growing in an oriented way. At 54 hpf, however, a high proportion of filopodia (61%) lay within the rostral and ventral quadrant relative to the center of the growth cone (i.e., between 180° and 240°; Fig. 4C; Table 1). This distribution is significantly different between the two stages, based on the proportion of filopodia in the rostroventral quadrant (Fig. 4; Table 1). These data demonstrate that filopodia undergo refinement at the 52 hpf transition.
Table 1.
Quantitation of filopodial orientation from live imaging before and after the 52 hpf transitiona
|
GFP |
WT-α2-chn |
G228S-α2-chn |
|||
|---|---|---|---|---|---|
| Before | After | Before | After | Before | After |
| 25.97 | 61.14* | 36.93 | 54.90* | 34.01 | 33.86 |
aPercentage of filopodia oriented within the rostroventral quadrant (Fig. 4C) between 180° and 270°, before and after the 52 hpf transition point, in neurons expressing the GFP, WT-α2-chn, or G228S-α2-chn mutant constructs (based on movies of 9, 4, and 5 neurons, respectively, for before and 10, 8, and 6 neurons after; numbers of filopodia were in the range of 70–173 per condition). This quadrant represents the area where the MR and IR muscle targets lie. Distribution was compared by two-way ANOVA. There was a significant difference in filopodial orientation between “Before” and “After” in both GFP- or WT-α2-chn-expressing neurons (p < 0.001 in both cases). There was no difference in filopodial orientation “Before” in any situation; or between “Before” and “After” in G228S-α2-chn-expressing neurons (p > 0.05). Filopodial distribution of G228S-α2-chn-expressing neurons “After” was significantly different compared with that of GFP- or WT-α2-chn-expressing neurons “After,” however (p = 0.009 and p = 0.033, respectively).
*Significant distribution difference.
Hyperactivation of α2-chimaerin prevents the 52 hpf transition
To explore mechanisms involved in axon guidance in the zebrafish ocular motor system, we tested the role of the signaling protein α2-chn. α2-chn is highly expressed in the midbrain and oculomotor nucleus in the chick (Miyake et al., 2008), and a similar expression pattern is indicated in the zebrafish, where α2-chn expression is ubiquitous throughout the brain, including the midbrain between 24 and 72 hpf (Leskow et al., 2006). Mutations in α2-chn, which are causal in human DRS, are thought to be gain of function, leading to hyperactivation of downstream signaling pathways (Colón-González et al., 2008; Miyake et al., 2008). We previously showed that overexpression of these isoforms in the chick OMN led to nerve stalling just distal to the dorsal rectus muscle (SR equivalent). To investigate its function, we mosaically expressed either wt α2-chimaerin (WT-α2-chn) or the G228S mutant form (G228S-α2-chn) as above, using the Gal4-UAS system (Halpern et al., 2008). We chose to use mosaic expression in single axons because of the possible problems associated with global activation of α2-chn in the early embryo.
Live imaging of embryos expressing either α2-chn isoform showed that OMN axon projections at 48 hpf and before the transition point were normal and indistinguishable from those of GFP-expressing neurons (Fig. 3E). Quantitation of filopodial behavior from movies of WT-α2-chn-expressing neurons between 49 and 54 hpf showed that the filopodial production rate decreased significantly at 54 hpf, as for GFP axons (Fig. 4B). Vector-based analysis of the filopodial orientation of these neurons showed that these neurons also remodel their filopodia during transition. At 49 hpf, WT-α2-chn-expressing neurons showed a trend toward orientating their filopodia within the rostroventral quadrant based on the appearance of radar plots, but statistically this was not significantly different from the control. At 54 hpf, the preferred filopodial orientation (56%) was within the 180° to 240° quadrant (Fig. 4D; Table 1) similar to that of GFP-expressing neurons. Statistical analysis confirmed a significant difference between the “before” and “after” distributions for WT-α2-chn-expressing neurons, and no significant difference between these distributions and those of GFP-expressing neurons at either time point (Fig. 4C). WT-α2-chn-expressing neurons can thus grow normally into the MR, IR, or IO target domains (Figs. 3F, yellow arrow, and 4D). This indicates that overexpression of WT-α2-chn does not compromise OMN axons' ability to refine their filopodia and undergo a behavioral switch at the 52 hpf transition.
G228S-α2-chn-expressing axons behaved in the same way as GFP and WT-α2-chn-expressing axons up to the transition point (i.e., from 49 to 52 hpf; Fig. 3E). However, beyond the point in the pathway normally reached at 52 hpf, no further axon extension was observed, and axons stalled just distal to the SR muscle (Fig. 3F,G). Imaging up to 72 hpf showed that the axon leading edge remained in the same position, and no projections were formed into any muscle targets (data not shown). However, movies showed that the leading edge of the growth cone remained highly dynamic, continuing to extend and retract numerous filopodia. In some cases (n = 8 of 33 neurons), aberrant dorsally-directed extensions were noted (Movie 3; Fig. 3F, arrowhead). Quantitation of filopodia showed that the normal decline in the rate of filopodial appearance that occurs at 52 hpf failed to occur in these neurons, and instead remained high (Fig. 4B). The rate of filopodial production for G228S-α2-chn-expressing neurons at 54 hpf was not significantly different from that of any of the three groups at 49 hpf. Moreover, vector-based analysis showed that neurons expressing G228S-α2-chn do not refine their filopodia to a preferred direction, either before or after the decision point, with no restriction to the rostral and ventral quadrant (Fig. 4E; Table 1; 34% filopodia in 180° to 240° quadrant). The spatial distribution of filopodia for G228S-α2-chn-expressing axons was not significantly altered after the 52 hpf transition point relative to axons in any of the groups before the transition.
Filopodial dynamics in neurons expressing the G228S mutant form of α2-chn. Time-lapse movie of 2 oculomotor neurons expressing the α2-chn-G228S construct at 54 hpf, before the transition point. In addition to not showing any filopodial remodeling, these display aberrant dorsally heading projections.
Trochlear neurons were unaffected by the expression of G228S-α2-chn (data not shown). These data therefore show that expression of the G228S isoform of chimaerin disrupts oculomotor axons' ability to undergo a key guidance transition. This is reflected in aberrant dynamics of filopodia, which fail to be refined and remodeled, and so do not stabilize on a particular muscle, causing a stalling phenotype.
Morpholino-mediated knockdown of α2-chn leads to OMN axon guidance defects
To investigate the effects of knocking down α2-chn, we used a previously characterized morpholino (MO1), which is reported to target both the maternal and zygotic α2-chn mRNAs to produce some defects in epiboly progression (Leskow et al., 2006). To circumvent this possible issue, we also used a morpholino (MO2) targeting presplicing mRNA (i.e., zygotic) only (Bill et al., 2009). We used RT-PCR to validate this approach (Fig. 5K), showing that only the presplicing α2-chn mRNA is detected after MO2 microinjection at the one cell stage. The survivors were analyzed at 72 hpf for gross morphology and immunostained for α-tubulin to visualize the OMN pathway. Control morpholinos with a 5 bp mismatch for both MO1 and MO2 did not lead to any defects in OMN axon projections (Fig. 5O) compared with uninjected embryos (Fig. 2D).
Figure 5.
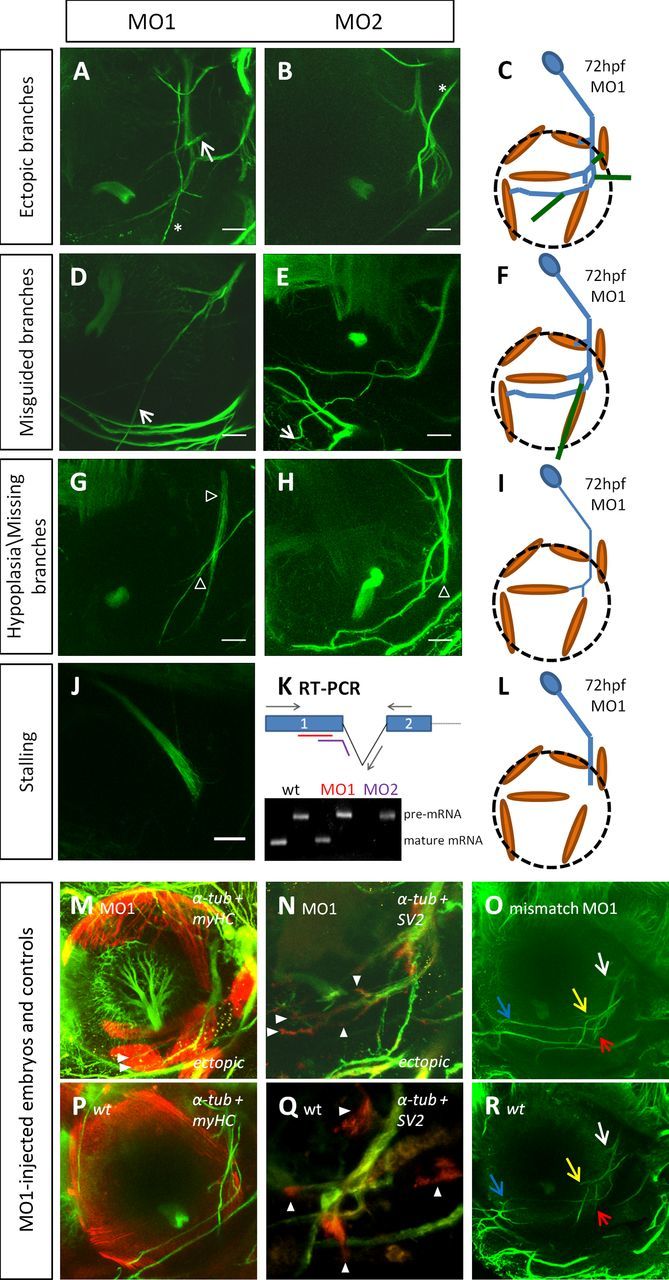
OMN phenotypes observed after morpholino microinjection. Multiphoton lateral views of MO1-injected (A, D, G, J) or MO2-injected (B, E, H) morphant embryos immunostained for α-tubulin at 72 hpf. Phenotypes observed are labeled to left, including ectopic branches (A, B), misguided branches (D, E), hypoplasia of the OMN or missing branches (G, H), or stalling of the whole OMN projection (J). Arrows indicate ectopic nerve branches; arrowheads indicate hypoplastic or truncated nerve projections. *Branch of the trigeminal nerve. OMN schematics (C, F, I, L) are as in Figure 1, with misguided and ectopic branches shown in dark green. K, RT-PCR of total RNAs extracted from 48 hpf morphant embryos. For both wt and MO1-microinjected embryos, both the presplicing and mature forms of mRNA are detected after amplification with both exon and intron primers. After MO2 microinjection, only the presplicing mRNA is detected. M, N, Multiphoton lateral views of MO1-injected embryos and MO1 mismatch controls immunostained for α-tubulin and myHC (M) or α-tubulin and presynaptic vesicles (N) at 72 hpf. M, Arrowheads indicate multiple nerve branches growing into the IO muscle. N, Arrowheads indicate synaptic staining. O, Multiphoton lateral view of a control “mismatch MO1”-injected embryo immunostained for α-tubulin at 72 hpf. Yellow and red arrows indicate nerve branches to the MR and IR muscles, respectively; blue arrow indicates the nerve branch toward the IO muscle; white arrow indicates the nerve branch to the SR muscle. P–R, Control images of wt embryos immunostained as M–O. Scale bars, 50 μm.
For embryos injected with MO1, gross phenotypes ranged from normal appearance to slight or severe curvature of the trunk as previously reported (Leskow et al., 2006). The gross organization of the nervous system did not show any obvious defects apart from those with severe curvature of the body axis (<25%). We therefore analyzed all embryos with the exception of this category.
MO1-injected embryos displayed a range of abnormal phenotypes of the OMN projection at 72 hpf whose frequencies are summarized in Table 2. The most frequent phenotype (48%) observed was ectopic branching (Fig. 5A,C), with extra branches often occurring just distal to the SR muscle, some of which were directed toward the LR (Fig. 5A, arrow), representing a DRS phenotype. The other phenotypes observed were hypoplasia (thinner caliber) of the nerve or missing branches, which were grouped together into the same category (35%; Fig. 5G, empty arrowheads, I). At lower frequency, we also observed misguided nerve branches (24%; Fig. 5D, arrow, F), or stalling of the whole OMN (28%; Fig. 5J). This stalling phenotype occurred at the same point in the pathway as that observed for G228S-α2-chn-expressing axons.
Table 2.
Distribution of phenotypes observed after morpholino-mediated knockdown of α2-chna
| Morpholino | Hypoplasia/missing branches | Stalling | Ectopic branches | Misguided | 2+ | Total |
|---|---|---|---|---|---|---|
| MO1 (n) | 24 | 19 | 33 | 17 | 24 | 69 |
| MO2 (n) | 4 | 0 | 13 | 7 | 7 | 17 |
| MO1 (%) | 34.78 | 27.54 | 47.83 | 24.6 | 34.8 | 100 |
| MO2 (%) | 23.53 | 0 | 76.47 | 41.18 | 41.18 | 100 |
| MO1 2 ng (n) | 11 | 0 | 10 | 7 | 10 | 19 |
| MO1 2 ng (%) | 57.89 | 0 | 52.63 | 36.84 | 52.63 | 100 |
aTwo different morpholinos (MO1, MO2); phenotypes are as described. The 2+ column indicates numbers of embryos showing two or more of the described phenotypes.
MO2-injected embryos showed a similar range of phenotypes. As for MO1, ectopic nerve branches were observed most frequently (76%; Fig. 5B), including some to the LR muscle. Misguided branches were observed more frequently for MO2 (41%; Fig. 5E, arrow) than for MO1, with hypoplasia/missing branches or nerve hypoplasia seen less frequently (24%; Fig. 5H, empty arrowheads; Table 2). However, by contrast with MO1, no embryo showed the stalling phenotype. Moreover, no embryos displayed any altered body curvature. As MO1 affects both maternal and zygotic transcripts whereas MO2 affects only zygotic transcripts, these data might be explained by quantitatively different degrees of α2-chn knockdown, with stalling resulting from a more extensive α2-chn knockdown. To confirm this, we injected a reduced quantity of MO1 (2 ng) and analyzed the resulting phenotypes as above. Similar to MO2-injected embryos, these morphants never displayed the stalling phenotype. Furthermore, there was a higher percentage of hypoplasia and missing branches, as well as ectopic branches. Overall, embryos injected with 2 ng of MO1 presented an array of phenotypes closely similar to those injected with 3 ng of MO2 (Table 2). This suggests that the prevalence of each individual phenotype is dependent on the magnitude of α2-chn knockdown, explaining the various phenotypes observed in DRS patients. Overall, however, the most common defect produced by both morpholinos was ectopic branching; in addition, 35% and 41% of embryos showed more than two defects after MO1- and MO2-mediated knockdown, respectively. Axon “overgrowth” phenotypes therefore predominated after α2-chn knockdown, compared with axon stalling for α2-chn gain of function.
We double-immunostained some morpholino-treated embryos for nerves and muscles and found that muscle positioning was normal and that, in some cases, nerves could be observed correctly targeting muscles (Fig. 5M, arrowheads). This demonstrates that knockdown of α2-chn activity does not alter EOM positioning, suggesting that OMN phenotypes were not caused by displacement of its targets. However, this also showed that, in some cases, oculomotor axons projected ectopic branches to muscle targets (e.g., two branches to IO; Fig. 5M), and overall only a minority of embryos had correct axon projections to a subset of the EOMs; for example, only 13% (9 of 69) of MO1-injected embryos displayed correct projections of the abducens and OMN to both the LR and the MR muscles, respectively. We therefore tested the possibility that α2-chn knockdown impairs synaptogenesis. The pattern of SV2 staining appeared normally localized to correct axon branches at 72 hpf as in wild-type embryos (Fig. 5N,Q); however, additional accumulations of SV2 were also seen in axon leading edges of ectopic branches (Fig. 5N, arrowheads). α2-chn therefore may play a role in coupling the localization of presynaptic components to targets.
Overall, these morpholino knockdown experiments suggest that reducing the level of α2-chn in OMN neurons impairs their ability to respond to guidance information, which specifies axon topographic targeting to muscles. The phenotypes shown here involve a spectrum of axon guidance defects, suggesting that responses to a range of guidance information may be disrupted.
Morpholino knockdown of α2-chn function impairs the OKR
Such axon guidance defects of the OMN would be expected to disrupt eye movements. Analysis of the OKR in MO1- and MO2-injected fish at 4 dpf showed that only a small fraction of morphants could perform slow tracking movements relative to both wt and mismatch morpholino control-injected embryos (Table 3). Among those embryos capable of these movements, the frequency of fast reset was significantly reduced. The frequency of unilateral OKR defects was similar for morphants, controls, and wt embryos, suggesting that manipulating α2-chn function affects the OKR bilaterally. Overall, these data indicate that α2-chimaerin knockdown has affected the coordinated function of the LR and MR muscles, which mediate horizontal eye movements and the OKR. The proportion of embryos with intact eye movements (∼11%) was similar to that of embryos displaying innervation to both the MR and LR muscles. These data indicate that manipulating α2-chmaerin signaling impairs the OKR and affects both eyes independently. This could be a result of a lack of coordination between the LR and MR muscles resulting from incorrect nerve branching.
Table 3.
Quantitation of optokinetic responsesa
| Fast reset (Hz) |
Unilaterality |
Slow tracking movements |
||||||||||||
|---|---|---|---|---|---|---|---|---|---|---|---|---|---|---|
| wt | miMO1 | MO1 | miMO2 | MO2 | wt | miMO1 | MO1 | miMO2 | MO2 | wt | miMO1 | MO1 | miMO2 | MO2 |
| 0.254 | 0.202 | 0.065 | 0.241 | 0.025 | 15/113 | 7/37 | 8/54 | 4/15 | 20/75 | 113/113 | 37/37 | 6/54 | 15/15 | 11/75 |
aQuantitation of OKR in wt, control morpholinos (miMO1, miMO2), and MO1- and MO2-injected fish (n = 113, n = 37, n = 54, n = 15, and n = 75, respectively) from three different experiments. Morpholino-injected fish display almost no OKR, as reflected by the number of fast reset movements observed, with a p < 0.0001 for MO1 and MO2 compared with wt, miMO1, and miMO2. The unilaterality of the response is not significantly affected, however, as a similar percentage of fish have a unilateral defect in all groups. Finally, although all wt, miMO1, and miMO2 fish are capable of slow tracking movements, only a fraction MO1- and MO2-injected fish can perform these.
α2-chn regulates microtubule stability
α2-chn regulates the cytoskeleton and regulates Rac to alter actin dynamics (Yang and Kazanietz, 2007). The axon overgrowth and ectopic branching phenotypes observed in vivo after α2-chn knockdown might suggest increased axon consolidation and growth that results from increasing microtubule stability (Stiess and Bradke, 2011). We therefore tested the effects on microtubules of knocking down α2-chn in primary oculomotor neurons. Chick oculomotor neurons were used for these experiments because of our published data on the biological function of α2-chn in this system (Ferrario et al., 2012). Immunocytochemistry was used to label stable and unstable microtubules in growth cones and to quantify the ratio between these forms (Fig. 6A,B). shRNA-mediated α2-chn knockdown led to an increase in microtubule stability relative to control neurons (Fig. 6C). These data suggest that a correct level of α2-chn signaling is required to maintain the dynamic instability of microtubules, which plays a role in axon guidance. α2-chn knockdown leads to increased microtubule stability in vitro, which might equate in vivo with causation of axon overgrowth and failure to terminate at targets.
Figure 6.

Cytoskeletal dynamics and α2-chn. Oculomotor growth cones stained for both stable (green) and unstable (red) tubulin transfected with a control scrambled shRNA (A) or with an α2-chn shRNA (B). Ratio of stable over unstable microtubule area in the distal 20 μm of these growth cones in both conditions (C). n = 39 and n = 71 neurons for control and shRNA, respectively. *p = 0.004.
Discussion
In this study, we have mapped ocular motor development in the zebrafish and demonstrated that the α2-chn signaling protein regulates filopodial dynamics during axon guidance. We find that ocular motor projections form between 30 and 72 hpf, when synaptogenesis ensues. Live imaging shows that developing oculomotor axons undergo several transitions in behavior, including a crucial 52 hpf transition when axons select muscle targets. This transition is accompanied by a reduction in the numbers of filopodia generated and a refinement of their direction.
Manipulations of α2-chn signaling produced striking defects of ocular motor axon guidance. Knockdown of α2-chn caused oculomotor axon ectopic branching, misguided and missing branches, and hypoplasia of the nerve. Some phenotypes were reminiscent of DRS in humans and the OKR was largely absent, reflecting a strong impairment of horizontal eye movements. Expression of hyperactive forms of α2-chn in single oculomotor axons prevented them from undergoing the 52 hpf transition; axons stalled and were unable to select muscle targets. A correct level of α2-chn signaling therefore appears crucial in oculomotor axons to allow them to transduce guidance information into precise patterns of neuromuscular connectivity. We propose that the effects of α2-chn are mediated, in part, via regulation of microtubule stability.
Ocular motor axon projections and subnuclei form according to a distinct pattern in the zebrafish
Here we describe a pattern of oculomotor development in which an early guidance decision at 52 hpf generates three nerve branches, two of which innervate the proximal IR and MR muscles. The third branch generated at the first guidance decision develops on a longer time scale and innervates the distal IO muscle last (by 72 hpf). During the time period when this third branch is extending to its target, a fourth branch to the most proximal SR muscle forms at 66 hpf. This contrasts with the pattern of development in the chick embryo, in which oculomotor axons first project unbranched to the distal ventral oblique muscle (IO equivalent), and other axon branches to more proximal muscles appear later (Chilton and Guthrie, 2004). This difference in timing does not appear to be related to a delay in differentiation of the IO/VO as in both species this muscle lacks differentiated myofibers at the time of axon extension (data not shown; Chilton and Guthrie, 2004). Rather, OMN navigation in the zebrafish seems to involve axonal contact with the putative “guidepost” muscles of the IR/MR. As innervation of the LR muscle by abducens also occurs early, this suggests that early connectivity to the LR and MR (by oculomotor) permits horizontal eye movements, which are required for early larval behavior. Live imaging in the zebrafish shows that early connectivity depends critically on a transition in axon guidance, from a mode of exploratory outgrowth of the OMN to fixation on muscle targets.
Our data provide circumstantial evidence that OMN guidance involves the outgrowth of cohorts of motor neurons, housed within distinct subnuclei, to particular muscle targets. This resembles the arrangement in the chick embryo, in which neurons within a subnucleus project to an individual EOM (Heaton and Wayne, 1983). Our study found no evidence that single axons branched to multiple targets, which might be consistent with early specification, although, at 54 hpf, the MR and IR muscles were contacted by axons while still connected to one another. Therefore, an intriguing possibility remains that stochastic mechanisms also play a role and that levels of α2-chn signaling might themselves dictate choice of muscle targets.
A key role for α2-chn is conserved in the zebrafish
Mutations in α2-chn cause ocular motor axon guidance disorders in humans and in the chick embryo (Miyake et al., 2008; Engle, 2010). Our findings in the zebrafish suggest a conservation of the role of α2-chn in ocular motor pathfinding, providing the potential to model the human eye movement disorder DRS. Indeed, screening of the OKR in mutagenized zebrafish has proved valuable in identifying components of the gene regulatory network that controls eye movements (Neuhauss et al., 1999; Maurer et al., 2011). Our study highlights the potential of live imaging of ocular motor projections in the zebrafish to gain insights into the effects of human mutations on axon dynamics.
Hyperactivation of α2-chn in the zebrafish OMN led to a stalling phenotype, whereas α2-chn knockdown caused a spectrum of effects, including ectopic and misguided branches (which sometimes overshot targets) but also missing branches and nerve hypoplasia. These effects are broadly similar to those previously observed in the chick embryo (Miyake et al., 2008), but the variety of defects resulting from loss of function was larger. In addition, the zebrafish system has allowed several important new insights into the role of α2-chn in the guidance process. First, whereas static imaging suggests that hyperactivating α2-chn leads to a cessation of growth, implying reduced cytoskeletal motility, live imaging suggests instead an enhanced production of filopodia and a failure in their directional refinement. These data implicate α2-chn as a “clutch” mechanism that engages guidance information to produce guidance decisions. Second, whereas anatomical analysis of α2-chn knockdown phenotypes gave the superficial impression that many axons reached their muscle targets, functional analysis showed an absence of OKR in these animals. This suggests that the LR and MR muscles are uncoordinated because of either a lack of synaptic function or cocontraction that might result from the aberrant innervation of LR by the OMN.
Together, the results of manipulating α2-chn signaling in the zebrafish suggest that a correct level of signaling is required for the fidelity of ocular motor axon pathfinding and that a variety of phenotypes result from too high or too low levels. In particular, we have shown that α2-chn is required at the 52 hpf transition to overcome the possibility of axon stalling along the pathway. There are a number of explanations for such a phenomenon, including the possibility that overexpression of hyperactive α2-chn isoforms might trigger proteasomal degradation, as occurs in the case of α1-chn (Marland et al., 2011). These phenotypes mirror, in some cases, the phenotypes revealed by neuroimaging of DRS patients, which include hypoplasia as well as ectopic branching of the OMN (Hotchkiss et al., 1980; Miller et al., 1982; Demer et al., 2006, 2007).
Signaling pathways via α2-chimaerin
We have previously shown that at least three diffusible guidance cues play a role during oculomotor wiring in the chick; CXCL12 and HGF have a chemoattractant and growth-promoting influence, whereas Sema3A acts as a chemorepellent (Lerner et al., 2010; Ferrario et al., 2012). All three cues are transduced via α2-chn (Ferrario et al., 2012), suggesting that the latter acts as an integrator of attractant and repellent guidance information. It is likely that some of these cues operate in the zebrafish system, but as yet these possibilities have not been tested. A nonexclusive possibility is that contact-mediated cues on muscle surfaces also play a role, as single axons extend long filopodia toward putative muscle targets, such as the IR muscle (Fig. 4A). α2-chn is capable of transducing contact-mediated ephrinB-EphA4 signaling (Dalva, 2007; Shi et al., 2007; Wegmeyer et al., 2007), so it is plausible that the 52 hpf transition depends on both diffusible and contact-mediated guidance information. The failure of growth cone advance and axon consolidation that occurs in neurons expressing an α2-chn gain-of-function isoform suggests a lack of anchorage to the substratum, a crucial step in axon growth (Myers et al., 2011). Such an anchorage might be provided by muscle targets, or alternatively, by matrix components of the periocular mesenchyme via integrins.
Despite α2-chn's key role as a cytoskeletal regulator, these signaling pathways largely remain to be characterized. Here we show that α2-chn regulates microtubule stability, a necessary aspect of its role in orchestrating the balance between axon consolidation during growth and axon pausing to arborize in muscles. As CRMP2 binds to α2-chn, acts downstream of Sema3A signaling, and regulates microtubules (Brown et al., 2004), a role for CRMP2 in ocular motor axon guidance is likely. In the future, it will be important to characterize in detail how human mutations in α2-chn affect these downstream signaling pathways. In the ocular motor system, α2-chn's role in transducing both attractant and repellent guidance information might involve its recruitment to several different signaling complexes as well as changes in its subcellular localization.
Footnotes
This work was supported by a Fight for Sight PhD studentship to C.C. and by the Wellcome Trust. We thank Martin Meyer, Robert Knight, Uwe Drescher, and Simon Hughes for their expertise and extensive discussions on the manuscript.
The authors declare no competing financial interests.
References
- Ben Fredj N, Hammond S, Otsuna H, Chien CB, Burrone J, Meyer MP. Synaptic activity and activity-dependent competition regulates axon arbor maturation, growth arrest, and territory in the retinotectal projection. J Neurosci. 2010;30:10939–10951. doi: 10.1523/JNEUROSCI.1556-10.2010. [DOI] [PMC free article] [PubMed] [Google Scholar]
- Bill BR, Petzold AM, Clark KJ, Schimmenti LA, Ekker SC. A primer for morpholino use in zebrafish. Zebrafish. 2009;6:69–77. doi: 10.1089/zeb.2008.0555. [DOI] [PMC free article] [PubMed] [Google Scholar]
- Brockerhoff SE. Measuring the optokinetic response of zebrafish larvae. Nat Protoc. 2006;1:2448–2451. doi: 10.1038/nprot.2006.255. [DOI] [PubMed] [Google Scholar]
- Brown M, Jacobs T, Eickholt B, Ferrari G, Teo M, Monfries C, Qi RZ, Leung T, Lim L, Hall C. α2-chimaerin, cyclin-dependent kinase 5/p35, and its target collapsin response mediator protein-2 are essential components in semaphorin 3A-induced growth-cone collapse. J Neurosci. 2004;24:8994–9004. doi: 10.1523/JNEUROSCI.3184-04.2004. [DOI] [PMC free article] [PubMed] [Google Scholar]
- Buckley K, Kelly RB. Identification of a transmembrane glycoprotein specific for secretory vesicles of neural and endocrine cells. J Cell Biol. 1985;100:1284–1294. doi: 10.1083/jcb.100.4.1284. [DOI] [PMC free article] [PubMed] [Google Scholar]
- Chilton JK, Guthrie S. Development of oculomotor axon projections in the chick embryo. J Comp Neurol. 2004;472:308–317. doi: 10.1002/cne.20071. [DOI] [PubMed] [Google Scholar]
- Colón-González F, Leskow FC, Kazanietz MG. Identification of an autoinhibitory mechanism that restricts C1 domain-mediated activation of the Rac-GAP α2-chimaerin. J Biol Chem. 2008;283:35247–35257. doi: 10.1074/jbc.M806264200. [DOI] [PMC free article] [PubMed] [Google Scholar]
- Dalva MB. There's more than one way to skin a chimaerin. Neuron. 2007;55:681–684. doi: 10.1016/j.neuron.2007.08.015. [DOI] [PMC free article] [PubMed] [Google Scholar]
- Demer JL, Ortube MC, Engle EC, Thacker N. High-resolution magnetic resonance imaging demonstrates abnormalities of motor nerves and extraocular muscles in patients with neuropathic strabismus. J AAPOS. 2006;10:135–142. doi: 10.1016/j.jaapos.2005.12.006. [DOI] [PMC free article] [PubMed] [Google Scholar]
- Demer JL, Clark RA, Lim KH, Engle EC. Magnetic resonance imaging evidence for widespread orbital dysinnervation in dominant Duane's retraction syndrome linked to the DURS2 locus. Invest Ophthalmol Vis Sci. 2007;48:194–202. doi: 10.1167/iovs.06-0632. [DOI] [PMC free article] [PubMed] [Google Scholar]
- Easter SS, Jr, Nicola GN. The development of vision in the zebrafish (Danio rerio) Dev Biol. 1996;180:646–663. doi: 10.1006/dbio.1996.0335. [DOI] [PubMed] [Google Scholar]
- Elworthy S, Hargrave M, Knight R, Mebus K, Ingham PW. Expression of multiple slow myosin heavy chain genes reveals a diversity of zebrafish slow twitch muscle fibres with differing requirements for Hedgehog and Prdm1 activity. Development. 2008;135:2115–2126. doi: 10.1242/dev.015719. [DOI] [PubMed] [Google Scholar]
- Engle EC. Human genetic disorders of axon guidance. Cold Spring Harb Perspect Biol. 2010;2:a001784. doi: 10.1101/cshperspect.a001784. [DOI] [PMC free article] [PubMed] [Google Scholar]
- Ferrario JE, Baskaran P, Clark C, Hendry A, Lerner O, Hintze M, Allen J, Chilton JK, Guthrie S. Axon guidance in the developing ocular motor system and Duane retraction syndrome depends on Semaphorin signaling via α2-chimaerin. Proc Natl Acad Sci U S A. 2012;109:14669–14674. doi: 10.1073/pnas.1116481109. [DOI] [PMC free article] [PubMed] [Google Scholar]
- Guthrie S. Patterning and axon guidance of cranial motor neurons. Nat Rev Neurosci. 2007;8:859–871. doi: 10.1038/nrn2254. [DOI] [PubMed] [Google Scholar]
- Halpern ME, Rhee J, Goll MG, Akitake CM, Parsons M, Leach SD. Gal4/UAS transgenic tools and their application to zebrafish. Zebrafish. 2008;5:97–110. doi: 10.1089/zeb.2008.0530. [DOI] [PMC free article] [PubMed] [Google Scholar]
- Heaton MB, Wayne DB. Patterns of extraocular innervation by the oculomotor complex in the chick. J Comp Neurol. 1983;216:245–252. doi: 10.1002/cne.902160303. [DOI] [PubMed] [Google Scholar]
- Higashijima S, Okamoto H, Ueno N, Hotta Y, Eguchi G. High-frequency generation of transgenic zebrafish which reliably express GFP in whole muscles or the whole body by using promoters of zebrafish origin. Dev Biol. 1997;192:289–299. doi: 10.1006/dbio.1997.8779. [DOI] [PubMed] [Google Scholar]
- Higashijima S, Hotta Y, Okamoto H. Visualization of cranial motor neurons in live transgenic zebrafish expressing green fluorescent protein under the control of the islet-1 promoter/enhancer. J Neurosci. 2000;20:206–218. doi: 10.1523/JNEUROSCI.20-01-00206.2000. [DOI] [PMC free article] [PubMed] [Google Scholar]
- Hollway GE, Bryson-Richardson RJ, Berger S, Cole NJ, Hall TE, Currie PD. Whole-somite rotation generates muscle progenitor cell compartments in the developing zebrafish embryo. Dev Cell. 2007;12:207–219. doi: 10.1016/j.devcel.2007.01.001. [DOI] [PubMed] [Google Scholar]
- Hotchkiss MG, Miller NR, Clark AW, Green WR. Bilateral Duane's retraction syndrome: a clinical-pathologic case report. Arch Ophthalmol. 1980;98:870–874. doi: 10.1001/archopht.1980.01020030864013. [DOI] [PubMed] [Google Scholar]
- Hunter PR, Nikolaou N, Odermatt B, Williams PR, Drescher U, Meyer MP. Localization of Cadm2a and Cadm3 proteins during development of the zebrafish nervous system. J Comp Neurol. 2011;519:2252–2270. doi: 10.1002/cne.22627. [DOI] [PubMed] [Google Scholar]
- Kimmel CB, Ballard WW, Kimmel SR, Ullmann B, Schilling TF. Stages of embryonic development of the zebrafish. Dev Dyn. 1995;203:253–310. doi: 10.1002/aja.1002030302. [DOI] [PubMed] [Google Scholar]
- Köster RW, Fraser SE. Tracing transgene expression in living zebrafish embryos. Dev Biol. 2001;233:329–346. doi: 10.1006/dbio.2001.0242. [DOI] [PubMed] [Google Scholar]
- Lerner O, Davenport D, Patel P, Psatha M, Lieberam I, Guthrie S. Stromal cell-derived factor-1 and hepatocyte growth factor guide axon projections to the extraocular muscles. Dev Neurobiol. 2010;70:549–564. doi: 10.1002/dneu.20796. [DOI] [PubMed] [Google Scholar]
- Leskow FC, Holloway BA, Wang H, Mullins MC, Kazanietz MG. The zebrafish homologue of mammalian chimerin Rac-GAPs is implicated in epiboly progression during development. Proc Natl Acad Sci U S A. 2006;103:5373–5378. doi: 10.1073/pnas.0508585103. [DOI] [PMC free article] [PubMed] [Google Scholar]
- Longair MH, Baker DA, Armstrong JD. Simple Neurite Tracer: open source software for reconstruction, visualization and analysis of neuronal processes. Bioinformatics. 2011;27:2453–2454. doi: 10.1093/bioinformatics/btr390. [DOI] [PubMed] [Google Scholar]
- Marland JR, Pan D, Buttery PC. Rac GTPase-activating protein (Rac GAP) α1-Chimaerin undergoes proteasomal degradation and is stabilized by diacylglycerol signaling in neurons. J Biol Chem. 2011;286:199–207. doi: 10.1074/jbc.M110.166728. [DOI] [PMC free article] [PubMed] [Google Scholar]
- Maurer CM, Huang YY, Neuhauss SC. Application of zebrafish oculomotor behavior to model human disorders. Rev Neurosci. 2011;22:5–16. doi: 10.1515/RNS.2011.003. [DOI] [PubMed] [Google Scholar]
- Miller NR, Kiel SM, Green WR, Clark AW. Unilateral Duane's retraction syndrome (Type 1) Arch Ophthalmol. 1982;100:1468–1472. doi: 10.1001/archopht.1982.01030040446016. [DOI] [PubMed] [Google Scholar]
- Miyake N, Chilton J, Psatha M, Cheng L, Andrews C, Chan WM, Law K, Crosier M, Lindsay S, Cheung M, Allen J, Gutowski NJ, Ellard S, Young E, Iannaccone A, Appukuttan B, Stout JT, Christiansen S, Ciccarelli ML, Baldi A, et al. Human CHN1 mutations hyperactivate α2-chimaerin and cause Duane's retraction syndrome. Science. 2008;321:839–843. doi: 10.1126/science.1156121. [DOI] [PMC free article] [PubMed] [Google Scholar]
- Myers JP, Santiago-Medina M, Gomez TM. Regulation of axonal outgrowth and pathfinding by integrin-ECM interactions. Dev Neurobiol. 2011;71:901–923. doi: 10.1002/dneu.20931. [DOI] [PMC free article] [PubMed] [Google Scholar]
- Neuhauss SC, Biehlmaier O, Seeliger MW, Das T, Kohler K, Harris WA, Baier H. Genetic disorders of vision revealed by a behavioral screen of 400 essential loci in zebrafish. J Neurosci. 1999;19:8603–8615. doi: 10.1523/JNEUROSCI.19-19-08603.1999. [DOI] [PMC free article] [PubMed] [Google Scholar]
- Noden DM, Marcucio R, Borycki AG, Emerson CP., Jr Differentiation of avian craniofacial muscles: I. Patterns of early regulatory gene expression and myosin heavy chain synthesis. Dev Dyn. 1999;216:96–112. doi: 10.1002/(SICI)1097-0177(199910)216:2<96::AID-DVDY2>3.0.CO%3B2-6. [DOI] [PubMed] [Google Scholar]
- Ott H, Diekmann H, Stuermer CA, Bastmeyer M. Function of Neurolin (DM-GRASP/SC-1) in guidance of motor axons during zebrafish development. Dev Biol. 2001;235:86–97. doi: 10.1006/dbio.2001.0278. [DOI] [PubMed] [Google Scholar]
- Shi L, Fu WY, Hung KW, Porchetta C, Hall C, Fu AK, Ip NY. α2-chimaerin interacts with EphA4 and regulates EphA4-dependent growth cone collapse. Proc Natl Acad Sci U S A. 2007;104:16347–16352. doi: 10.1073/pnas.0706626104. [DOI] [PMC free article] [PubMed] [Google Scholar]
- Stiess M, Bradke F. Neuronal transport: myosins pull the ER. Nat Cell Biol. 2011;13:10–11. doi: 10.1038/ncb2147. [DOI] [PubMed] [Google Scholar]
- Wegmeyer H, Egea J, Rabe N, Gezelius H, Filosa A, Enjin A, Varoqueaux F, Deininger K, Schnütgen F, Brose N, Klein R, Kullander K, Betz A. EphA4-dependent axon guidance is mediated by the RacGAP α2-chimaerin. Neuron. 2007;55:756–767. doi: 10.1016/j.neuron.2007.07.038. [DOI] [PubMed] [Google Scholar]
- Yang C, Kazanietz MG. Chimaerins: GAPs that bridge diacylglycerol signalling and the small G-protein Rac. Biochem J. 2007;403:1–12. doi: 10.1042/BJ20061750. [DOI] [PubMed] [Google Scholar]
Associated Data
This section collects any data citations, data availability statements, or supplementary materials included in this article.
Supplementary Materials
Filopodial dynamics before the 52 hpf transition. Time-lapse movie of 3 oculomotor neurons expressing the 5′UAS-GFP construct at 49 hpf.
Filopodial dynamics after the 52 hpf transition. Time-lapse movie of 3 oculomotor neurons expressing the GFP construct at 54 hpf.
Filopodial dynamics in neurons expressing the G228S mutant form of α2-chn. Time-lapse movie of 2 oculomotor neurons expressing the α2-chn-G228S construct at 54 hpf, before the transition point. In addition to not showing any filopodial remodeling, these display aberrant dorsally heading projections.