

Abstract
Resting-state functional MRI is a powerful tool that is increasingly used as a noninvasive method for investigating whole-brain circuitry and holds great potential as a possible diagnostic for disease. Despite this potential, few resting-state studies have used animal models (of which nonhuman primates represent our best opportunity of understanding complex human neuropsychiatric disease), and no work has characterized networks in awake, truly resting animals. Here we present results from a small New World monkey that allows for the characterization of resting-state networks in the awake state. Six adult common marmosets (Callithrix jacchus) were acclimated to light, comfortable restraint using individualized helmets. Following behavioral training, resting BOLD data were acquired during eight consecutive 10 min scans for each conscious subject. Group independent component analysis revealed 12 brain networks that overlap substantially with known anatomically constrained circuits seen in the awake human. Specifically, we found eight sensory and “lower-order” networks (four visual, two somatomotor, one cerebellar, and one caudate–putamen network), and four “higher-order” association networks (one default mode-like network, one orbitofrontal, one frontopolar, and one network resembling the human salience network). In addition to their functional relevance, these network patterns bear great correspondence to those previously described in awake humans. This first-of-its-kind report in an awake New World nonhuman primate provides a platform for mechanistic neurobiological examination for existing disease models established in the marmoset.
Introduction
A large body of research now suggests that, even when not performing a specific task, the “resting” brain is continuously adjusting circuits and networks to respond to a changing environment (Deco et al., 2011). Thus, at rest, the brain maintains connections within widely distributed networks that subsequently can be activated during task performance (Hampson et al., 2006; Tambini et al., 2010; Baldassarre et al., 2012) and can be enhanced with cognitive training (Lewis et al., 2009; Mackey et al., 2013). Several resting-state networks have been consistently identified (Smith et al., 2009; Snyder and Raichle, 2012) and are consistent with MRI-based measures of structural connectivity and with nonhuman primate (NHP) neuroanatomical tract-tracing work (Damoiseaux and Greicius, 2009; Greicius et al., 2009; Margulies et al., 2009; Kelly et al., 2010). Among the most studied resting-state networks are the salience network (SN), executive control network, and default mode network (DMN). These networks are thought to be involved in orientation to salient internal or external stimuli, the allocation of cognitive resources toward such stimuli, and reciprocally from self-referential, introspective thinking, respectively. Importantly, these large-scale networks, and their interactions, are disrupted in a wide variety of neuropsychiatric conditions including Alzheimer's disease (Lustig et al., 2003), autism (Kennedy et al., 2006), depression (Anand et al., 2005), multiple sclerosis (Lowe et al., 2002), and, more recently, drug addiction (Gu et al., 2010; Camchong et al., 2011; for review, see Menon, 2011, Sutherland et al., 2012; Lerman et al., 2013).
Although it is possible to approach many facets of neuropsychiatric disease with rodent models, phylogenetic proximity to humans, similar brain architecture, and behavioral repertoire are among the most compelling reasons that nonhuman primates provide the ideal animal model for complex neuropsychiatric disorders. The common marmoset (Callithrix jacchus) is a small, New World NHP that is native to South America. Weighing merely 350–500 g as adults, the marmoset is increasingly being used in preclinical behavioral, pharmacological, human disease, and, recently, imaging studies (Mansfield, 2003; Galvão-Coelho et al., 2008; Bock et al., 2009; Newman et al., 2009; Carrion and Patterson, 2012). Among its favorable characteristics, this docile monkey is easily handled, and, using standard behavioral training techniques, it has recently been used in conscious imaging preparations exploring BOLD responses to somatosensory stimulation of the forearm (Liu et al., 2013).
In addition to more closely approximating the conditions under which human resting-state studies are conducted, awake marmoset imaging circumvents many of the problems and inconsistencies presented using anesthesia in BOLD fMRI. For example, brain regions that respond to sensory stimulation in the awake preparation have either an attenuated response or no response under anesthesia (Boveroux et al., 2010; Liu et al., 2013). Here we used this conscious NHP model to explore resting-state network patterns and demonstrate that the awake marmoset brain shows functionally relevant networks that are spatially consistent with those found in humans. These data make a strong case for the use of this species and the awake imaging model for subsequent exploration of the neurobiological mechanistic bases of neuropsychiatric disorders.
Materials and Methods
All procedures were approved by the Animal Care and Use Committees of the National Institute of Neurological Disorders and Stroke and the National Institute on Deafness and Other Communication Disorders. Adult male, common marmosets (N = 6) aged 2–4 years and weighing 350–500 g at the time of the studies were housed in same-gender pairs in cages with a 12 h light/dark cycle. They were fed twice daily with a diet of Zupreem canned marmoset food (Zupreem), LabDiet 5040 biscuits (Purina), PRANG oral rehydrator (BioServ), unfiltered water, and various fresh fruits and vegetables.
Awake training.
Training and awake imaging restraint procedures (as well as a description of the materials used to impose the restraint) are fully described in Silva et al. (2011) and Liu et al. (2013). Briefly, the animals were exposed to 3 weeks of daily progressive training to acclimate them to the scanning procedures. During the first week of training, the monkeys were placed in a prone (sphinx) position in a mock scanner environment (Fig. 1) and were habituated to the atraumatic restraint device, which consisted of a vest and plastic backplate attached to a hemi-cylindrical tube. In week 2, the monkeys were exposed to this condition for increasingly longer periods of time (up to 2 h), and a recording of sounds from the MRI scanner was played (∼80 dB) to more completely mimic the scanner environment. On the third and final week of training, in addition to the back restraint, the animals heads were restrained using individualized plastic helmets that were constructed based on 3D anatomical images acquired for each animal and submitted to solid ink printing. On each of the training days, a behavioral rating scale was used to assess individual animals' tolerance to the acclimatization procedures (Silva et al., 2011). All animals successfully completed the training, achieving a behavioral rating score of ≤4 (for a more thorough description of how the behavioral rating score is related to stress, the reader is referred to the studies of Schultz-Darken et al., 2004 and Silva et al., 2011). Thereafter, all animals proceeded to the imaging phase of the study.
Figure 1.

Illustration of a restrained marmoset in the MRI-compatible bed. A surface receive-only coil is placed directly on top of the customized helmet. Modified from Silva et al. (2011).
BOLD data acquisition.
Resting data were acquired using a 7T/30 cm USR horizontal Bruker magnet interfaced to an AVANCE AVIII MRI spectrometer (Bruker) and equipped with a 15-cm-gradient set capable of 450 mT/m in 120 μs (Resonance Research). A custom-built birdcage volume coil (inner diameter, 10.2 cm) was used for radio frequency excitation, and a custom-built, 4 cm, double-circular-loop surface coil was positioned on top of the helmet for signal reception. Local magnetic field inhomogeneity estimation and shimming were performed based on field map measurements. Single-shot gradient-echo EPI data were acquired from 15 coronal slices (slice thickness, 2 mm; FOV, 45 mm; matrix, 80 × 80; TE, 25 ms; TR, 1500 ms; 400 repetitions). A T2-weighted structural scan was acquired for each animal with the same geometric parameters as the EPI, but with a matrix of 160 × 160 (four averages; TE, 72ms; TR, 6000 ms). Each 10 min resting-state scan was repeated eight times in a single session to assure sufficient data collection in the event of animal movement.
Preprocessing and analysis.
Preprocessing of the fMRI data was performed within the AFNI framework (National Institute of Mental Health/National Institutes of Health; Cox, 1996), and included 3D volume registration, detrending, slice timing correction, and Gaussian blurring (FWHM = 1.125 mm). Anatomical (T2-weighted) scans were registered to individual EPI sessions, with manual gross and fine adjustments made to the aligned datasets, and data from individual animals were then coregistered to a common space using a high-resolution tissue-segmented and population-averaged standard template brain atlas of a standard marmoset brain (Hikishima et al., 2011). For visualization and display purposes, we used a high-resolution T2 scan of a single marmoset brain (150 μm isotropic voxels; TE, 500 ms; TR, 40 ms), and registered it to the group-averaged and registered data.
Because of the potential for head motion to produce systematic errors in a resting-state dataset (Power et al., 2012), we motion censored the time course data using 1d_tool.py (http://afni.nimh.nih.gov/pub/dist/doc/program_help/1d_tool.py.html). We estimated the displacement of each brain volume relative to the previous volume from the translational (x, y, z) and rotational (α, β, γ) rigid-body motion correction parameters. Specifically, displacement was calculated as the Euclidian norm of these six realignment parameters (displacement = square root of [(Δx)2 + (Δy)2 + (Δz)2 + (Δα)2 + (Δβ)2 + (Δγ)2], where the rotational displacements were converted from radians to millimeters by calculating displacement on the surface of a sphere of radium 58 mm, which is about the mean distance from the cerebral cortex to the center of the head). For each continuous 10 min EPI run, we first applied a threshold of 0.3 mm for the relative displacement between consecutive TRs. Under this threshold, the maximum number of time points to be censored for the dataset with the worst motion was 40 volumes. We then varied the relative displacement threshold and applied it to the other datasets so that the 40 volumes associated with the largest displacement values were censored from each dataset. This procedure yielded datasets that, once censored, were of equal length, a requirement for the FSL independent-components analysis toolbox.
Resting-state fMRI data were analyzed using group-level independent component analysis (gICA; Melodic, FSL), with a model specified by 30 components (Lu et al., 2012). To evaluate the robustness of the ICA-identified maps, we performed exploratory analyses with models specified by 20, 25, 35, and 40 components. The determination of putative physiologically relevant components was based on visual identification consistent with network patterns approximating those previously described in humans, rhesus monkeys, and rodents by our group and others (Beckmann et al., 2005; Hutchison et al., 2011; Lu et al., 2012; Shirer et al., 2012; Mantini et al., 2013). Extracted component maps were overlaid onto the averaged group anatomical scan and visualized in AFNI. Visual identification of marmoset anatomy and brain regional definitions is based on a marmoset brain atlas (Paxinos et al., 2012). All results are displayed either as overlays onto the averaged group anatomical data or as overlays onto the high-resolution T2 obtained from a single marmoset. To evaluate subject and session robustness of the network maps, we performed two separate sets of ICA analyses, all specified with 30 components, one set that explored intersubject variability of the networks (six ICA runs, one for each subject across all eight sessions), and a separate set that explored the intersession variability of the networks (eight ICA runs, one for each session across all six subjects). As with the group-level data, the determination of anatomically relevant networks was based on visual identification.
Results
Of the 30 components specified in the group ICA analysis, 18 components appeared to represent CSF or white matter, or otherwise appeared to be related to physiological noise and were excluded from further consideration. The 12 remaining components demonstrated bilateral correlation patterns that appeared consistent with known neurobiological systems (Fig. 2). These identified components accounted for 43% of the variance within the data, are thresholded at z = 13.5 for visualization purposes, and are described as follows: Component 1 (C1; Fig. 2A), high-order visual network, including V3, V4, and A19 and A19DI; Component 2 (C2; Fig. 2B), basal ganglia network, including caudate and putamen; Component 3 (C3; Fig. 2C), primary visual network, centering on primary visual cortex (V1); Component 4 (C4; Fig. 2D), dorsal (medial) somatomotor network, centered on primary (A3a, A3b, A1/2) and secondary (S2I, S2E) somatosensory areas, primary motor area A4ab, and anterior and posterior cingulate cortices, incorporating cortical areas A24a–d, A23/31, and A29/30; Component 5 (C5; Fig. 2E), high-order visual network, centered on V4, V5, V6, FST, and TE3; Component 6 (C6; Fig. 2F), high-order midline visual network, incorporating V2, A19M, and V6(DM); Component 7 (C7; Fig. 2G), retrosplenial and posterior cingulate cortex (A23/31 and A29/30), medial parietal area PG (PGM), premotor areas A6DR, A6DC, and A8C, posterior parietal areas PE, PFG, PG, and cortical areas surrounding the intraparietal sulcus [left intraparietal sulcus (LIP) and middle intraparietal sulcus (MIP)]; Component 8 (C8; Fig. 2H), network incorporating anterior cingulate (A24), anterior insula, auditory cortex, and parts of the thalamus; Component 9 (C9; Fig. 2I), orbitofrontal network, incorporating A13M, A13L, orbital periallocortex, and orbital proisocortex; Component 11 (C11; Fig. 2J), cerebellum network; Component 19 (C19; Fig. 2K), ventral (lateral) somatomotor component, encompassing primary motor cortex A4c (head representation), and primary (A3a and A3b) and secondary (A1/2 and S2PV) somatosensory cortices; and Component 20 (C20; Fig. 2L), frontal pole, covering A10, A9, A32, and more caudally, Area A8.
Figure 2.
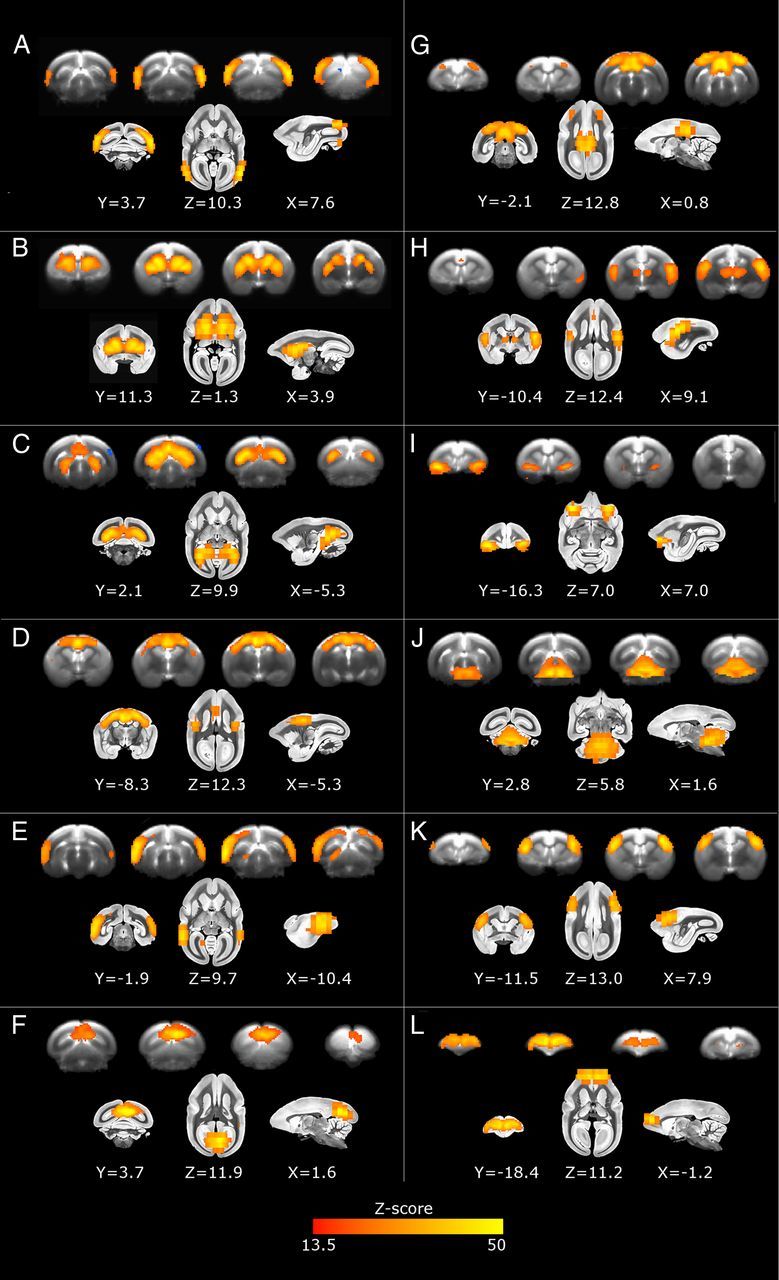
Twelve components identified as resting-state networks in the marmoset monkey (n = 6) using melodic group ICA. A–L, These networks (presented in the order in which they explain the signal variance) are labeled as follows: C1, a higher order visual network centered on V3, V4, A19 and A19DI (A); C2, basal ganglia (B); C3, primary visual (C); C4, dorsal (medial) somatomotor (D); C5, a higher-order visual network centered on V4, V5, V6, FST, and TE3 (E); C6, a higher-order midline visual network centered on V2, A19M, and V6(DM) (F); C7, retrosplenial and posterior cingulate cortex, medial parietal area PG, premotor and posterior parietal areas, and areas surrounding the intraparietal sulcus (G); C8, anterior cingulate, anterior insula, auditory cortex and thalamus (H); C9, orbitofrontal (I); C11, cerebellum (J); and C19, ventral somatomotor (K); and C20, frontal pole (L). Networks are shown in the four coronal slices deemed most representative of the correlation patterns on which network identification was based (top row, image generated as the average of the six monkeys' anatomical scans), and in coronal, axial, and sagittal planes on a high-resolution T2 marmoset anatomical image acquired in-house (bottom row). The color bar represents the z-score of these correlation patterns at a threshold of 13.5.
Of the 12 identified components, 4 components (designated C1, C3, C5, and C6) overlapped substantially with primary and higher-order visual cortical areas as defined in the marmoset brain (Paxinos et al., 2012). Several human and NHP resting-state fMRI reports have also identified visual networks in resting-state data, and, although there is significant overlap in the anatomical patterns of temporal coherence, the methods used to identify these networks and the nomenclature to label them differ (Beckmann et al., 2005; Damoiseaux et al., 2006; Vincent et al., 2007; Mantini et al., 2013). For example, Vincent et al. (2007) placed seeds in regions of striate cortex representing either foveal or peripheral vision, and found distinct correlation maps, which they named, appropriately, “foveal” and “peripheral.” Christian Beckmann's group has identified the following two visual functional networks in humans: one that corresponds to primary visual areas (medial visual cortical areas); and another encompassing nonprimary regions of visual cortex that are generally activated during higher-order visual attention tasks (Beckmann et al., 2005; Shirer et al., 2012; lateral visual cortical areas). Hutchison et al. (2011) also disambiguated the following two visual networks in anesthetized macaques that look strikingly similar to the human visual networks previously described (Beckmann et al., 2005): a primary visual pattern (parieto-occipital; Beckmann et al., 2005, see their Fig. 1I), and a higher-order visual map (Beckmann et al., 2005, their Fig. 1D). Finally, Mantini et al. (2013) report two visual components extracted from awake (but constantly rewarded) rhesus monkeys: a midline-centered peripheral visual component, and a more lateralized, parafoveal visual component.
Our data suggest the existence of four discernible visual networks with two levels of hierarchical grouping: one (C3) centered on primary visual cortical areas, and three (C1, C5, and C6) mostly containing higher-order visual cortical regions (Fig. 2A,C,E,F). The C3 network almost completely overlaps with the borders of primary visual cortex (V1), which resides within the bank of the calcarine sulcus (Paxinos et al., 2012). Primary visual cortex is the largest recipient of direct inputs from the lateral geniculate nucleus and is the largest area of the marmoset brain, occupying nearly one-fifth of the entire cerebral cortex (Rosa and Tweedale, 2005). Components C1 and C5 had very similar spatial distributions, with the exception that C5 is more prominently anterior, whereas the local maxima for C1 is centered on lateral V5 and V6, more posteriorly. The third higher-order visual component, C6, is centered on the posterior midline of the occipital cortex and corresponds very well with a medial visual component previously described in humans (Damoiseaux et al., 2006; Shirer et al., 2012). Our identification of two distinct, hierarchically separable visual networks (primary and higher-order visual) corresponds well with the human resting-state data that describe visual networks based on hierarchical grounds (Beckmann et al., 2005; Damoiseaux et al., 2006; Shirer et al., 2012).
Our gICA analysis also identified two sensorimotor networks, defined in components C4 (Fig. 2D) and C19 (Fig. 2K). Component C4 centered on somatomotor cortical areas. This network features prominently in both human and previous monkey resting-state investigations (Beckmann et al., 2005; Vincent et al., 2007; Hutchison et al., 2011; Mantini et al., 2013). A second, more lateralized somatomotor network was captured in component C19, encompassing primary and secondary motor and somatosensory cortical representations of the head and face. Primary and secondary motor and somatosensory topography are among the most well characterized regions in the marmoset, and, in fact, it is in this species that Krubitzer and Kaas, 1990 conducted pioneering work of NHP somatomotor architecture.
Additionally, we found a single component that very precisely matched the anatomical boundaries of the basal ganglia caudate and putamen (C2; Fig. 2B). This ICA-identified network is not frequently reported in human resting-state studies (which tend to focus on cortical networks); but when it is, it comprises, bilaterally, the pallidum, putamen, substantia nigra, and subthalamic nucleus (Damoiseaux et al., 2008; Robinson et al., 2009; Shirer et al., 2012). This same network was reported by Mantini et al. (2012), who identified a network encompassing the caudate and putamen in monkeys that were awake but constantly rewarded. Finally, we identified a component that significantly bilaterally overlaps the cerebellum (C11; Fig. 2J).
In addition to these sensory and subcortical networks, we identified four networks (C7, C8, C9, and C20; Fig. 2G,H,I,L, respectively) overlapping substantially with a higher-order cognitive-processing function and bearing significant correspondence with previously described cognitive performance networks found in humans and monkeys. Specifically, C7 encompassed several mostly posterior midline cortical structures, including the posterior cingulate cortex, retrosplenial cortex, and several posterior parietal areas, including those flanking the intraparietal sulcus (LIP and MIP; Fig. 2G). Additionally, more rostral frontal cortical areas of premotor cortex featured prominently in this component. Several reports have surrounded the identification in humans of a component that is highly similar to this one, incorporating all or most of these structures, and extending into dorsal medial prefrontal cortex (Buckner et al., 2008). Termed the “default mode network,” this network is engaged when individuals are left to think to themselves (Raichle et al., 2001). The DMN has been postulated as a system of brain regions that is most active when the brain is in an “idle” mode and is particularly identifiable in humans (and is maximally engaged) during between-trial periods of directed task behavior. The DMN may relate to spontaneous rumination, planning, or remembering the past (Buckner et al., 2008). Interestingly, regions spatially consistent with this network have been reported in anesthetized monkeys (Hutchison et al., 2011; Mantini et al., 2011, 2013) and rats (Upadhyay et al., 2011; Lu et al., 2012), suggesting that although its function may have evolved in humans, its core features and participating regions are also identifiable in lower-order species.
A second higher-order network identified in our data, C8, largely incorporated the insula, anterior cingulate cortex, and thalamus (Fig. 2H), and represents a network that is frequently reported in resting-state network investigations in humans. The insula is a functionally heterogeneous brain area that participates in a wide variety of behaviors involving interoceptive awareness and the mediation of emotion (Craig, 2009), functions that have placed this structure at the center of a “salience network” described by Seeley et al. (2007). This network, and the insula in particular, has been proposed to serve as a sentinel, detecting salience from a vast array of constant streams of stimuli, and, perhaps, serving as a signal to initiate engagement of various cognitive control networks, with concomitant disengagement of the DMN (Menon and Uddin, 2010). Such a network, if present in other species, might mediate physiologically and ecologically relevant attentional switches; for example, initiating a switch in behavior from food foraging to paying attention to the sound of a potentially hazardous hawk circling above the trees. Although Hutchison et al. (2011, their Fig. 1G) also found a cinguloinsular component in anesthetized macaques, Mantini et al. (2013) identified a salience-like network in humans (a “cinguloinsular” component; Mantini et al., 2013, their Fig. 9c) that had no correspondence in their monkey results. The absence of a salience-like network in rhesus monkeys reported by Mantini et al. (2013) could be related to the conditions under which the resting-state experiments were conducted: the monkeys received liquid reinforcement when they paid attention to the stimuli on a screen in front of them. Because of this important methodological difference between their human and monkey acquisition paradigms, it is perhaps not surprising that they reported differences in network patterns within and between the species. The fact that we identified a salience-like network in our marmoset data suggests that monkeys may in fact possess such a network and highlights the need to be mindful of conditions under which resting-state data are evaluated.
Finally, our analyses identified two higher-order networks within the marmoset frontal cortex: one that encompassed bilateral orbitofrontal cortex (OFC; C9; Fig. 2I); and another that encompassed much of the frontal pole (C20; Fig. 2L). Occupying the ventral surface of the primate prefrontal cortex, the OFC is generally considered to be crucial for the flexible alteration of reward-related responses (Fellows, 2011), and has connectivity patterns in humans that closely mirror the connectivity patterns identified in NHPs using histological tracing techniques (Kahnt et al., 2012). The more dorsal aspects of the marmoset frontal cortex, encompassed in C20, mediate various aspects of working memory and cognitive flexibility (Ridley et al., 1993; Rygula et al., 2010; Agustín-Pavón et al., 2012). The OFC and dorsal frontal cortical connectivity has been described in detail in the marmoset with the elegant histological work of Roberts et al. (2007).
These components were very consistent, and were readily identifiable both at an individual subject and session level. Table 1 summarizes all 12 network components, and the number of animals (of a possible total of six animals) that possessed those ICA-identified components. We were very stringent in our assessment of individual network identification. Networks that arose at an individual level that did not incorporate all of the structures identified at the group level were not counted, as we required complete anatomical correspondence between the individual networks and the group data for an individual subject network to be considered a recapitulation of the grand map data. Figure 3 demonstrates a representative network (the basal ganglia component) in an individual animal's dataset and clearly demonstrates the reproducibility of the networks at a single-subject level.
Table 1.
Resting-state networks in awake marmoset monkeys (in Fig. 2)
| ICA network map component | Functional network description | Reproducibility |
|---|---|---|
| C1 (Fig. 2A) | Higher-order visual | 6/6 |
| C2 (Fig. 2B) | Basal ganglia | 6/6 |
| C3 (Fig. 2C) | Primary visual | 6/6 |
| C4 (Fig. 2D) | Dorsal (medial) somatomotor | 6/6 |
| C5 (Fig. 2E) | Higher-order visual | 6/6 |
| C6 (Fig. 2F) | Higher-order midline visual | 5/6 |
| C7 (Fig. 2G) | Default Mode | 5/6 |
| C8 (Fig. 2H) | Salience | 6/6 |
| C9 (Fig. 2I) | Orbitofrontal | 5/6 |
| C11 (Fig. 2J) | Cerebellar | 4/6 |
| C19 (Fig. 2K) | Ventral (lateral) somatomotor | 3/6 |
| C20 (Fig. 2L) | Frontal pole | 4/6 |
Figure 3.

A basal ganglia component from an individual monkey's ICA, calculated from eight EPI sessions. The BOLD data are overlaid onto this individual monkey's own high-resolution T2 scan (top row), and onto a high-resolution T2 marmoset anatomical image acquired in-house (bottom row). For visualization purposes, the color bar represents the z-score of these correlation patterns at a threshold of 3.0.
Table 2 demonstrates the intersession robustness of these 12 components. The average spatial overlap of the grand total maps with the individual 10 min fMRI sessions was assessed using a voxelwise spatial correlation method (3ddot in the AFNI framework). The last column shows the average of those correlations across the sessions, with R values ranging from 0.73 to 0.92.
Table 2.
Within-session robustness of the ICA components (in Fig. 2) identified from the grand map data
| ICA grand network map component | Run 1 | Run 2 | Run 3 | Run 4 | Run 5 | Run 6 | Run 7 | Run 8 | Average spatial correlation coefficient |
|---|---|---|---|---|---|---|---|---|---|
| C1 (Fig. 2A) | 0.874 | 0.927 | 0.939 | 0.925 | 0.941 | 0.890 | 0.950 | 0.927 | 0.921625 |
| C2 (Fig. 2B) | 0.834 | 0.920 | 0.879 | 0.910 | 0.901 | 0.928 | 0.879 | 0.945 | 0.8995 |
| C3 (Fig. 2C) | 0.834 | 0.726 | 0.931 | 0.708 | 0.923 | 0.841 | 0.871 | 0.851 | 0.835625 |
| C4 (Fig. 2D) | 0.898 | 0.894 | 0.940 | 0.962 | 0.944 | 0.918 | 0.946 | 0.883 | 0.923125 |
| C5 (Fig. 2E) | 0.920 | 0.856 | 0.914 | 0.868 | 0.803 | 0.871 | 0.903 | 0.870 | 0.875625 |
| C6 (Fig. 2F) | 0.881 | 0.901 | 0.922 | NA | 0.920 | 0.829 | 0.922 | 0.812 | 0.883857 |
| C7 (Fig. 2G) | 0.810 | 0.882 | 0.588 | NA | 0.911 | 0.806 | 0.912 | 0.763 | 0.810286 |
| C8 (Fig. 2H) | 0.883 | 0.913 | 0.764 | 0.926 | 0.902 | 0.833 | 0.860 | 0.862 | 0.867875 |
| C9 (Fig. 2I) | 0.851 | 0.733 | 0.825 | 0.818 | 0.840 | 0.816 | 0.842 | 0.595 | 0.79 |
| C11 (Fig. 2J) | 0.782 | 0.930 | 0.462 | 0.652 | 0.705 | 0.874 | 0.718 | 0.735 | 0.73225 |
| C19 (Fig. 2K) | NA | NA | 0.731 | 0.888 | 0.873 | 0.877 | 0.865 | 0.832 | 0.844333 |
| C20 (Fig. 2L) | 0.884 | 0.860 | 0.863 | 0.880 | NA | NA | 0.749 | 0.823 | 0.843167 |
Spatial correlation coefficients are demonstrated for the voxels contained within identified components and in individual 10 min resting-state fMRI sessions. NA, Components that were not detected in individual datasets and could not be given a correlation coefficient.
Discussion
Magnetic resonance imaging arguably affords the best neuroscience cross-species translational power, as findings with human subjects can be directly tested in preclinical models. The past decade has witnessed a precipitous rise in the number of studies of correlated activity in the resting human brain (Snyder and Raichle, 2012), an unabating trend that increasingly commands a need for appropriate animal models. These spatially restricted and temporally correlated spontaneous signals are seen in humans during periods of rest. Snyder and Raichle (2012) have operationally defined the resting state thus:
“. . a constant condition without imposed stimuli or other behaviorally salient events. The eyes may be closed or open, with or without visual fixation. . The objective of resting-state experiments is to capture the statistical properties of endogenously generated neural activity.”
In the strictest sense, the ideal animal model for exploring resting state should involve a subject that is quiet and still without being stressed, anesthetized, or engaged in any particular task-related activity. To our knowledge, no published studies using animal models would adhere to these requirements. Animal models exploring resting-state correlations often use anesthesia to ensure a motionless subject (Lu et al., 2007; Vincent et al., 2007; Hutchison et al., 2011). With little exception (Upadhyay et al., 2011), the very few studies that do use awake models involve delivery of some type of reward and often require the subjects to perform low-level tasks of sustained attention, such as viewing movie clips (Moeller et al., 2009; Mantini et al., 2013). Here we report the application of a neuroimaging model with conscious marmosets that does not require anesthesia or invasive surgical procedures, or use within-scan session reinforcement or task demands. Marmosets in our laboratory that are trained for awake scanning are not required to perform tasks, do not receive rewards, and in general, are unperturbed by the loud scanner noises. Using a data-driven approach that statistically separates signals into independent components (Beckmann et al., 2005; Calhoun et al., 2005), we found 12 anatomically constrained and neurobiologically relevant networks in conscious marmoset monkeys (Fig. 2). These 12 networks bear correspondence to networks previously described in humans (Beckmann et al., 2005; Damoiseaux et al., 2006; Seeley et al., 2007; Robinson et al., 2009; Kahnt et al., 2012; Shirer et al., 2012), and represent several low-order, sensory, and higher-order cognitive networks. Further, these networks are very robust, being largely observable at an individual subject and session level (Tables 1, 2, Fig. 3). Specifically, we found four visual networks (C1, C3, C5, and C6) that are frequently reported in humans and monkeys (Beckmann et al., 2005; Damoiseaux et al., 2006; Vincent et al., 2007; Shirer et al., 2012; Mantini et al., 2013). We also found two sensorimotor networks, defined in components C4 and C19, also bearing high correspondence to previously described human and monkey networks (Beckmann et al., 2005; Vincent et al., 2007; Hutchison et al., 2011; Mantini et al., 2013). Additionally, we found a basal ganglia network (C2) that looks remarkably similar to the basal ganglia network identified by Mantini et al. (2012), and a component that significantly bilaterally overlaps the cerebellum (C11). Finally, we identified four networks (C7, C8, C9, and C20) overlapping substantially with higher-order cognitive processing function, and bearing significant correspondence to previously described cognitive performance networks found in humans and monkeys (Seeley et al., 2007; Buckner et al., 2008; Hutchison et al., 2011; Mantini et al., 2011, 2013): a default-mode network, a salience-like network, an orbitofrontal network, and a network map that covered the frontal pole of the marmoset.
The work of Burish et al. (2008) provide key evidence for a functional significance in at least one of these resting-state networks, the somatomotor (C2) component. In an elegant cortical mapping study of frontoparietal cortex, they showed that microstimulation of primary motor cortex, adjacent primary and secondary somatosensory areas, as well as premotor cortex evoked movements in the marmoset (Burish et al., 2008). Although several of our higher-order circuits (the DMN and SN, specifically) would be more difficult to engage in task-based paradigms using our restraint procedures, the overlap in participating regions between our study and Burish et al. (2008) suggests that these networks define functionally relevant circuits.
The value of the marmoset
As research models, NHPs offer the greatest translational utility, chiefly due to their evolutionary proximity to humans. A New World monkey, the common marmoset, is a member of the Callitrichidae family and, along with Old World primates, diverged from a common anthropoid ancestor ∼35–40 million years ago (Goodman, 1999). The marmoset affords many experimental benefits, several of which relate to its small size and tractability (Abbott et al., 2003), the ability to live well in captivity, early sexual maturity, and fecundity (Abbott et al., 2003). These animals are not an endangered species, pose little to no biohazard threat to humans, and can be trained in a variety of complex cognitive tasks (Clarke et al., 2008; Walker et al., 2009). The recent successful germline transmission of a transgene (GFP; Sasaki et al., 2009) further enhances the marmoset's position of prominence as a valuable NHP model, offering not just an alternative to research with Old World monkeys, but justification for its exclusive use in many neurobiological disease models.
Arguably, New World monkeys are a phylogenetically less complex species, with lower specialization of brain function, and a more restricted repertoire of behaviors than Old World monkeys (Cyranoski, 2009). However, the relative neurobiological simplicity of this species may also have its advantages: for example, the smooth, lissencephalic cortex of the marmoset brain lends itself nicely to electrophysiological and optical imaging approaches. And yet, the New World monkey is evolutionarily superior to rats as a model of human brain structure and function. As stated by Rosa and Tweedale (2005, p. 669) “If one proposes that the organization of the New World monkey brain is less representative of the type of information needed to understand the human because of an additional 10 million years of evolution, one must also be prepared to accept that much larger differences could have arisen in the 25 million years separating humans and macaques.”
Limitations
Despite generally successful efforts to minimize head motion in our awake marmoset model with the implementation of extensive behavioral training (to acclimate the animals to the atraumatic head and body restraint and to the noisy scanning environment), the monkeys do retain a very small degree of freedom of movement within the helmets. It is now appreciated that even small amounts of subject motion can produce correlations in resting-state time courses (Power et al., 2012). For this reason, we adopted a rigorous approach to removing motion-related confounds in our time series data—an approach that we believe has yielded spatially consistent resting-state networks in the marmoset.
A further limitation of our study is that we did not control or interfere with the subjects' arousal level. Anecdotally, the subjects' eyes tended to remain closed during scan sessions, opening intermittently and at pulse sequence onsets. Shifting levels of arousal could perhaps have varying effects on ICA results, as patterns of cortical connectivity, although identifiable (Fransson et al., 2007; Vincent et al., 2007), are attenuated during sleep and light anesthesia (Massimini et al., 2007; Greicius et al., 2008).
It should also be noted that, although the ICA approach is considered to have several advantages over other methods of data analysis, blind-source separation is not without caveats. Although free of the constraints of hypothetically driven significance testing, the definition of independence is defined by the a priori specification of the number of components, which may modify the networks identified (Margulies et al., 2010). In an attempt to maintain objectivity, we performed identical gICA analysis specifying between 20 and 40 components. Our decision to include 30 components in the final model specification was based on its unique ability to robustly identify components on an individual subject basis (i.e., a basal ganglia and somatomotor component could be identified at both the group and individual level). Thus, while we believe for the current data that 30 components optimally identified large-scale brain networks, other datasets and other component prescriptions might yield somewhat disparate results from those presented herein. Clearly, replication would enhance the confidence of network identity.
Conclusions
In summary, we provide initial evidence of distinct large-scale networks derived from resting BOLD data in the brains of conscious marmoset monkeys corresponding to those frequently reported in humans and anesthetized Old World monkeys and chimpanzees. These networks are spatially robust across subjects and across fMRI sessions. Importantly, using this model, in addition to more closely approximating the conditions under which human resting-state networks are obtained, we offer convincing evidence that some of the higher-order networks not previously identified in animal models are present in the NHP brain. These findings provide additional validation of the model for exploring the basis of resting-state networks using behavioral, pharmacological, and lesion manipulations. Future directions might include examination of neuropsychiatric disease models in this species and their causative consequences to large-scale resting brain networks.
Footnotes
This work was supported by the Intramural Research Programs of the National Institute on Drug Abuse and the National Institute of Neurological Disorders and Stroke. We thank Julie B. Mackel (behavioral training and helmet manufacturing), Xianfeng Lisa Zhang (animal preparation), Dr. Hellmut Merkle (coil design and fabrication), Daniel C. Papoti (coil fabrication), and Lucia Notardonato, for their valuable contributions to this project.
The authors declare no competing financial interests.
References
- Abbott DH, Barnett DK, Colman RJ, Yamamoto ME, Schultz-Darken NJ. Aspects of common marmoset basic biology and life history important for biomedical research. Comp Med. 2003;53:339–350. [PubMed] [Google Scholar]
- Agustín-Pavón C, Braesicke K, Shiba Y, Santangelo AM, Mikheenko Y, Cockroft G, Asma F, Clarke H, Man MS, Roberts AC. Lesions of ventrolateral prefrontal or anterior orbitofrontal cortex in primates heighten negative emotion. Biol Psychiatry. 2012;72:266–272. doi: 10.1016/j.biopsych.2012.03.007. [DOI] [PubMed] [Google Scholar]
- Anand A, Li Y, Wang Y, Wu J, Gao S, Bukhari L, Mathews VP, Kalnin A, Lowe MJ. Activity and connectivity of brain mood regulating circuit in depression: a functional magnetic resonance study. Biol Psychiatry. 2005;57:1079–1088. doi: 10.1016/j.biopsych.2005.02.021. [DOI] [PubMed] [Google Scholar]
- Baldassarre A, Lewis CM, Committeri G, Snyder AZ, Romani GL, Corbetta M. Individual variability in functional connectivity predicts performance of a perceptual task. Proc Natl Acad Sci U S A. 2012;109:3516–3521. doi: 10.1073/pnas.1113148109. [DOI] [PMC free article] [PubMed] [Google Scholar]
- Beckmann CF, DeLuca M, Devlin JT, Smith SM. Investigations into resting-state connectivity using independent component analysis. Philos Trans R Soc Lond B Biol Sci. 2005;360:1001–1013. doi: 10.1098/rstb.2005.1634. [DOI] [PMC free article] [PubMed] [Google Scholar]
- Bock NA, Kocharyan A, Liu JV, Silva AC. Visualizing the entire cortical myelination pattern in marmosets with magnetic resonance imaging. J Neurosci Methods. 2009;185:15–22. doi: 10.1016/j.jneumeth.2009.08.022. [DOI] [PMC free article] [PubMed] [Google Scholar]
- Boveroux P, Vanhaudenhuyse A, Bruno MA, Noirhomme Q, Lauwick S, Luxen A, Degueldre C, Plenevaux A, Schnakers C, Phillips C, Brichant JF, Bonhomme V, Maquet P, Greicius MD, Laureys S, Boly M. Breakdown of within- and between-network resting state functional magnetic resonance imaging connectivity during propofol-induced loss of consciousness. Anesthesiology. 2010;113:1038–1053. doi: 10.1097/ALN.0b013e3181f697f5. [DOI] [PubMed] [Google Scholar]
- Buckner RL, Andrews-Hanna JR, Schacter DL. The brain's default network: anatomy, function, and relevance to disease. Ann N Y Acad Sci. 2008;1124:1–38. doi: 10.1196/annals.1440.011. [DOI] [PubMed] [Google Scholar]
- Burish MJ, Stepniewska I, Kaas JH. Microstimulation and architectonics of frontoparietal cortex in common marmosets (Callithrix jacchus) J Comp Neurol. 2008;507:1151–1168. doi: 10.1002/cne.21596. [DOI] [PubMed] [Google Scholar]
- Calhoun VD, Adali T, Stevens MC, Kiehl KA, Pekar JJ. Semi-blind ICA of fMRI: a method for utilizing hypothesis-derived time courses in a spatial ICA analysis. Neuroimage. 2005;25:527–538. doi: 10.1016/j.neuroimage.2004.12.012. [DOI] [PubMed] [Google Scholar]
- Camchong J, MacDonald AW, 3rd, Nelson B, Bell C, Mueller BA, Specker S, Lim KO. Frontal hyperconnectivity related to discounting and reversal learning in cocaine subjects. Biol Psychiatry. 2011;69:1117–11123. doi: 10.1016/j.biopsych.2011.01.008. [DOI] [PMC free article] [PubMed] [Google Scholar]
- Carrion R, Jr, Patterson JL. An animal model that reflects human disease: the common marmoset (Callithrix jacchus) Curr Opin Virol. 2012;2:357–362. doi: 10.1016/j.coviro.2012.02.007. [DOI] [PMC free article] [PubMed] [Google Scholar]
- Clarke HF, Robbins TW, Roberts AC. Lesions of the medial striatum in monkeys produce perseverative impairments during reversal learning similar to those produced by lesions of the orbitofrontal cortex. J Neurosci. 2008;28:10972–10982. doi: 10.1523/JNEUROSCI.1521-08.2008. [DOI] [PMC free article] [PubMed] [Google Scholar]
- Cox RW. AFNI: software for analysis and visualization of functional magnetic resonance neuroimages. Comput Biomed Res. 1996;29:162–173. doi: 10.1006/cbmr.1996.0014. [DOI] [PubMed] [Google Scholar]
- Craig AD. How do you feel—now? The anterior insula and human awareness. Nat Rev Neurosci. 2009;10:59–70. doi: 10.1038/nrn2555. [DOI] [PubMed] [Google Scholar]
- Cyranoski D. Marmoset model takes centre stage. Nature. 2009;459:492. doi: 10.1038/459492a. [DOI] [PubMed] [Google Scholar]
- Damoiseaux JS, Greicius MD. Greater than the sum of its parts: a review of studies combining structural connectivity and resting-state functional connectivity. Brain Struct Funct. 2009;213:525–533. doi: 10.1007/s00429-009-0208-6. [DOI] [PubMed] [Google Scholar]
- Damoiseaux JS, Rombouts SA, Barkhof F, Scheltens P, Stam CJ, Smith SM, Beckmann CF. Consistent resting-state networks across healthy subjects. Proc Natl Acad Sci U S A. 2006;103:13848–13853. doi: 10.1073/pnas.0601417103. [DOI] [PMC free article] [PubMed] [Google Scholar]
- Damoiseaux JS, Beckmann CF, Arigita EJ, Barkhof F, Scheltens P, Stam CJ, Smith SM, Rombouts SA. Reduced resting-state brain activity in the “default network” in normal aging. Cereb Cortex. 2008;18:1856–1864. doi: 10.1093/cercor/bhm207. [DOI] [PubMed] [Google Scholar]
- Deco G, Jirsa VK, McIntosh AR. Emerging concepts for the dynamical organization of resting-state activity in the brain. Nat Rev Neurosci. 2011;12:43–56. doi: 10.1038/nrn2961. [DOI] [PubMed] [Google Scholar]
- Fellows LK. Orbitofrontal contributions to value-based decision making: evidence from humans with frontal lobe damage. Ann N Y Acad Sci. 2011;1239:51–58. doi: 10.1111/j.1749-6632.2011.06229.x. [DOI] [PubMed] [Google Scholar]
- Fransson P, Skiöld B, Horsch S, Nordell A, Blennow M, Lagercrantz H, Aden U. Resting-state networks in the infant brain. Proc Natl Acad Sci U S A. 2007;104:15531–15536. doi: 10.1073/pnas.0704380104. [DOI] [PMC free article] [PubMed] [Google Scholar]
- Galvão-Coelho NL, Silva HP, Leão Ade C, de Sousa MB. Common marmosets (Callithrix jacchus) as a potential animal model for studying psychological disorders associated with high and low responsiveness of the hypothalamic-pituitary-adrenal axis. Rev Neurosci. 2008;19:187–201. doi: 10.1515/REVNEURO.2008.19.2-3.187. [DOI] [PubMed] [Google Scholar]
- Goodman M. The genomic record of humankind's evolutionary roots. Am J Hum Genet. 1999;64:31–39. doi: 10.1086/302218. [DOI] [PMC free article] [PubMed] [Google Scholar]
- Greicius MD, Kiviniemi V, Tervonen O, Vainionpää V, Alahuhta S, Reiss AL, Menon V. Persistent default-mode network connectivity during light sedation. Hum Brain Mapp. 2008;29:839–847. doi: 10.1002/hbm.20537. [DOI] [PMC free article] [PubMed] [Google Scholar]
- Greicius MD, Supekar K, Menon V, Dougherty RF. Resting-state functional connectivity reflects structural connectivity in the default mode network. Cereb Cortex. 2009;19:72–78. doi: 10.1093/cercor/bhn059. [DOI] [PMC free article] [PubMed] [Google Scholar]
- Gu H, Salmeron BJ, Ross TJ, Geng X, Zhan W, Stein EA, Yang Y. Mesocorticolimbic circuits are impaired in chronic cocaine users as demonstrated by resting-state functional connectivity. Neuroimage. 2010;53:593–601. doi: 10.1016/j.neuroimage.2010.06.066. [DOI] [PMC free article] [PubMed] [Google Scholar]
- Hampson M, Driesen NR, Skudlarski P, Gore JC, Constable RT. Brain connectivity related to working memory performance. J Neurosci. 2006;26:13338–13343. doi: 10.1523/JNEUROSCI.3408-06.2006. [DOI] [PMC free article] [PubMed] [Google Scholar]
- Hikishima K, Quallo MM, Komaki Y, Yamada M, Kawai K, Momoshima S, Okano HJ, Sasaki E, Tamaoki N, Lemon RN, Iriki A, Okano H. Population-averaged standard template brain atlas for the common marmoset (Callithrix jacchus) Neuroimage. 2011;54:2741–2749. doi: 10.1016/j.neuroimage.2010.10.061. [DOI] [PubMed] [Google Scholar]
- Hutchison RM, Leung LS, Mirsattari SM, Gati JS, Menon RS, Everling S. Resting-state networks in the macaque at 7 T. Neuroimage. 2011;56:1546–1555. doi: 10.1016/j.neuroimage.2011.02.063. [DOI] [PubMed] [Google Scholar]
- Kahnt T, Chang LJ, Park SQ, Heinzle J, Haynes JD. Connectivity-based parcellation of the human orbitofrontal cortex. J Neurosci. 2012;32:6240–6250. doi: 10.1523/JNEUROSCI.0257-12.2012. [DOI] [PMC free article] [PubMed] [Google Scholar]
- Kelly C, Uddin LQ, Shehzad Z, Margulies DS, Castellanos FX, Milham MP, Petrides M. Broca's region: linking human brain functional connectivity data and non-human primate tracing anatomy studies. Eur J Neurosci. 2010;32:383–398. doi: 10.1111/j.1460-9568.2010.07279.x. [DOI] [PMC free article] [PubMed] [Google Scholar]
- Kennedy DP, Redcay E, Courchesne E. Failing to deactivate: resting functional abnormalities in autism. Proc Natl Acad Sci U S A. 2006;103:8275–8280. doi: 10.1073/pnas.0600674103. [DOI] [PMC free article] [PubMed] [Google Scholar]
- Krubitzer LA, Kaas JH. The organization and connections of somatosensory cortex in marmosets. J Neurosci. 1990;10:952–974. doi: 10.1523/JNEUROSCI.10-03-00952.1990. [DOI] [PMC free article] [PubMed] [Google Scholar]
- Lerman C, Gu H, Loughead J, Ruparel K, Yang Y, Stein EA. Large scale brain network coupling predicts acute nicotine abstinence effects on craving and cognitive function. JAMA Psych. 2013 doi: 10.1001/jamapsychiatry.2013.4091. In press. [DOI] [PMC free article] [PubMed] [Google Scholar]
- Lewis CM, Baldassarre A, Committeri G, Romani GL, Corbetta M. Learning sculpts the spontaneous activity of the resting human brain. Proc Natl Acad Sci U S A. 2009;106:17558–17563. doi: 10.1073/pnas.0902455106. [DOI] [PMC free article] [PubMed] [Google Scholar]
- Liu JV, Hirano Y, Nascimento GC, Stefanovic B, Leopold DA, Silva AC. FMRI in the awake marmoset: somatosensory-evoked responses, functional connectivity, and comparison with propofol anesthesia. Neuroimage. 2013 doi: 10.1016/j.Neuroimage.2013.03.038. doi: 10.1016/j.Neuroimage.2013.03.038. Advance online publication. Retrieved September 18, 2013. [DOI] [PMC free article] [PubMed] [Google Scholar]
- Lowe MJ, Phillips MD, Lurito JT, Mattson D, Dzemidzic M, Mathews VP. Multiple sclerosis: low-frequency temporal blood oxygen level-dependent fluctuations indicate reduced functional connectivity initial results. Radiology. 2002;224:184–192. doi: 10.1148/radiol.2241011005. [DOI] [PubMed] [Google Scholar]
- Lu H, Zuo Y, Gu H, Waltz JA, Zhan W, Scholl CA, Rea W, Yang Y, Stein EA. Synchronized delta oscillations correlate with the resting-state functional MRI signal. Proc Natl Acad Sci U S A. 2007;104:18265–18269. doi: 10.1073/pnas.0705791104. [DOI] [PMC free article] [PubMed] [Google Scholar]
- Lu H, Zou Q, Gu H, Raichle ME, Stein EA, Yang Y. Rat brains also have a default mode network. Proc Natl Acad Sci U S A. 2012;109:3979–3984. doi: 10.1073/pnas.1200506109. [DOI] [PMC free article] [PubMed] [Google Scholar]
- Lustig C, Snyder AZ, Bhakta M, O'Brien KC, McAvoy M, Raichle ME, Morris JC, Buckner RL. Functional deactivations: change with age and dementia of the Alzheimer type. Proc Natl Acad Sci U S A. 2003;100:14504–14509. doi: 10.1073/pnas.2235925100. [DOI] [PMC free article] [PubMed] [Google Scholar]
- Mackey AP, Miller Singley AT, Bunge SA. Intensive reasoning training alters patterns of brain connectivity at rest. J Neurosci. 2013;33:4796–4803. doi: 10.1523/JNEUROSCI.4141-12.2013. [DOI] [PMC free article] [PubMed] [Google Scholar]
- Mansfield K. Marmoset models commonly used in biomedical research. Comp Med. 2003;53:383–392. [PubMed] [Google Scholar]
- Mantini D, Gerits A, Nelissen K, Durand JB, Joly O, Simone L, Sawamura H, Wardak C, Orban GA, Buckner RL, Vanduffel W. Default mode of brain function in monkeys. J Neurosci. 2011;31:12954–12962. doi: 10.1523/JNEUROSCI.2318-11.2011. [DOI] [PMC free article] [PubMed] [Google Scholar]
- Mantini D, Corbetta M, Romani GL, Orban GA, Vanduffel W. Data-driven analysis of analogous brain networks in monkeys and humans during natural vision. Neuroimage. 2012;63:1107–1118. doi: 10.1016/j.neuroimage.2012.08.042. [DOI] [PMC free article] [PubMed] [Google Scholar]
- Mantini D, Corbetta M, Romani GL, Orban GA, Vanduffel W. Evolutionarily novel functional networks in the human brain? J Neurosci. 2013;33:3259–3275. doi: 10.1523/JNEUROSCI.4392-12.2013. [DOI] [PMC free article] [PubMed] [Google Scholar]
- Margulies DS, Vincent JL, Kelly C, Lohmann G, Uddin LQ, Biswal BB, Villringer A, Castellanos FX, Milham MP, Petrides M. Precuneus shares intrinsic functional architecture in humans and monkeys. Proc Natl Acad Sci U S A. 2009;106:20069–20074. doi: 10.1073/pnas.0905314106. [DOI] [PMC free article] [PubMed] [Google Scholar]
- Margulies DS, Böttger J, Long X, Lv Y, Kelly C, Schäfer A, Goldhahn D, Abbushi A, Milham MP, Lohmann G, Villringer A. Resting developments: a review of fMRI post-processing methodologies for spontaneous brain activity. MAGMA. 2010;23:289–307. doi: 10.1007/s10334-010-0228-5. [DOI] [PubMed] [Google Scholar]
- Massimini M, Ferrarelli F, Esser SK, Riedner BA, Huber R, Murphy M, Peterson MJ, Tononi G. Triggering sleep slow waves by transcranial magnetic stimulation. Proc Natl Acad Sci U S A. 2007;104:8496–8501. doi: 10.1073/pnas.0702495104. [DOI] [PMC free article] [PubMed] [Google Scholar]
- Menon V. Large-scale brain networks and psychopathology: a unifying triple network model. Trends Cogn Sci. 2011;15:483–506. doi: 10.1016/j.tics.2011.08.003. [DOI] [PubMed] [Google Scholar]
- Menon V, Uddin LQ. Saliency, switching, attention and control: a network model of insula function. Brain Struct Funct. 2010;214:655–667. doi: 10.1007/s00429-010-0262-0. [DOI] [PMC free article] [PubMed] [Google Scholar]
- Moeller S, Nallasamy N, Tsao DY, Freiwald WA. Functional connectivity of the macaque brain across stimulus and arousal states. J Neurosci. 2009;29:5897–5909. doi: 10.1523/JNEUROSCI.0220-09.2009. [DOI] [PMC free article] [PubMed] [Google Scholar]
- Newman JD, Kenkel WM, Aronoff EC, Bock NA, Zametkin MR, Silva AC. A combined histological and MRI brain atlas of the common marmoset monkey, Callithrix jacchus. Brain Res Rev. 2009;62:1–18. doi: 10.1016/j.brainresrev.2009.09.001. [DOI] [PMC free article] [PubMed] [Google Scholar]
- Paxinos G, Watson C, Petrides M, Rosa M, Tokuno H. The marmoset brain in stereotaxic coordinates. Oxford, UK: Elsevier; 2012. [Google Scholar]
- Power JD, Barnes KA, Snyder AZ, Schlaggar BL, Petersen SE. Spurious but systematic correlations in functional connectivity MRI networks arise from subject motion. Neuroimage. 2012;59:2142–2154. doi: 10.1016/j.neuroimage.2011.10.018. [DOI] [PMC free article] [PubMed] [Google Scholar]
- Raichle ME, MacLeod AM, Snyder AZ, Powers WJ, Gusnard DA, Shulman GL. A default mode of brain function. Proc Natl Acad Sci U S A. 2001;98:676–682. doi: 10.1073/pnas.98.2.676. [DOI] [PMC free article] [PubMed] [Google Scholar]
- Ridley RM, Clark BA, Durnford LJ, Baker HF. Stimulus-bound perseveration after frontal ablations in marmosets. Neuroscience. 1993;52:595–604. doi: 10.1016/0306-4522(93)90409-9. [DOI] [PubMed] [Google Scholar]
- Roberts AC, Tomic DL, Parkinson CH, Roeling TA, Cutter DJ, Robbins TW, Everitt BJ. Forebrain connectivity of the prefrontal cortex in the marmoset monkey (Callithrix jacchus): an anterograde and retrograde tract-tracing study. J Comp Neurol. 2007;502:86–112. doi: 10.1002/cne.21300. [DOI] [PubMed] [Google Scholar]
- Robinson S, Basso G, Soldati N, Sailer U, Jovicich J, Bruzzone L, Kryspin-Exner I, Bauer H, Moser E. A resting state network in the motor control circuit of the basal ganglia. BMC Neurosci. 2009;10:137. doi: 10.1186/1471-2202-10-137. [DOI] [PMC free article] [PubMed] [Google Scholar]
- Rosa MG, Tweedale R. Brain maps, great and small: lessons from comparative studies of primate visual cortical organization. Philos Trans R Soc Lond B Biol Sci. 2005;360:665–691. doi: 10.1098/rstb.2005.1626. [DOI] [PMC free article] [PubMed] [Google Scholar]
- Rygula R, Walker SC, Clarke HF, Robbins TW, Roberts AC. Differential contributions of the primate ventrolateral prefrontal and orbitofrontal cortex to serial reversal learning. J Neurosci. 2010;30:14552–14559. doi: 10.1523/JNEUROSCI.2631-10.2010. [DOI] [PMC free article] [PubMed] [Google Scholar]
- Sasaki E, Suemizu H, Shimada A, Hanazawa K, Oiwa R, Kamioka M, Tomioka I, Sotomaru Y, Hirakawa R, Eto T, Shiozawa S, Maeda T, Ito M, Ito R, Kito C, Yagihashi C, Kawai K, Miyoshi H, Tanioka Y, Tamaoki N, et al. Generation of transgenic non-human primates with germline transmission. Nature. 2009;459:523–527. doi: 10.1038/nature08090. [DOI] [PubMed] [Google Scholar]
- Schultz-Darken NJ, Pape RM, Tannenbaum PL, Saltzman W, Abbott DH. Novel restraint system for neuroendocrine studies of socially living common marmoset monkeys. Lab Anim. 2004;38:393–405. doi: 10.1258/0023677041958918. [DOI] [PubMed] [Google Scholar]
- Seeley WW, Menon V, Schatzberg AF, Keller J, Glover GH, Kenna H, Reiss AL, Greicius MD. Dissociable intrinsic connectivity networks for salience processing and executive control. J Neurosci. 2007;27:2349–2356. doi: 10.1523/JNEUROSCI.5587-06.2007. [DOI] [PMC free article] [PubMed] [Google Scholar]
- Shirer WR, Ryali S, Rykhlevskaia E, Menon V, Greicius MD. Decoding subject-driven cognitive states with whole-brain connectivity patterns. Cereb Cortex. 2012;22:158–165. doi: 10.1093/cercor/bhr099. [DOI] [PMC free article] [PubMed] [Google Scholar]
- Silva AC, Liu JV, Hirano Y, Leoni RF, Merkle H, Mackel JB, Zhang XF, Nascimento GC, Stefanovic B. Longitudinal functional magnetic resonance imaging in animal models. Methods Mol Biol. 2011;711:281–302. doi: 10.1007/978-1-61737-992-5_14. [DOI] [PMC free article] [PubMed] [Google Scholar]
- Smith SM, Fox PT, Miller KL, Glahn DC, Fox PM, Mackay CE, Filippini N, Watkins KE, Toro R, Laird AR, Beckmann CF. Correspondence of the brain's functional architecture during activation and rest. Proc Natl Acad Sci U S A. 2009;106:13040–13045. doi: 10.1073/pnas.0905267106. [DOI] [PMC free article] [PubMed] [Google Scholar]
- Snyder AZ, Raichle ME. A brief history of the resting state: the Washington University perspective. Neuroimage. 2012;62:902–910. doi: 10.1016/j.neuroimage.2012.01.044. [DOI] [PMC free article] [PubMed] [Google Scholar]
- Sutherland MT, McHugh MJ, Pariyadath V, Stein EA. Resting state functional connectivity in addiction: lessons learned and a road ahead. Neuroimage. 2012;62:2281–2295. doi: 10.1016/j.neuroimage.2012.01.117. [DOI] [PMC free article] [PubMed] [Google Scholar]
- Tambini A, Ketz N, Davachi L. Enhanced brain correlations during rest are related to memory for recent experiences. Neuron. 2010;65:280–290. doi: 10.1016/j.neuron.2010.01.001. [DOI] [PMC free article] [PubMed] [Google Scholar]
- Upadhyay J, Baker SJ, Chandran P, Miller L, Lee Y, Marek GJ, Sakoglu U, Chin CL, Luo F, Fox GB, Day M. Default-mode-like network activation in awake rodents. PLoS One. 2011;6:e27839. doi: 10.1371/journal.pone.0027839. [DOI] [PMC free article] [PubMed] [Google Scholar]
- Vincent JL, Patel GH, Fox MD, Snyder AZ, Baker JT, Van Essen DC, Zempel JM, Snyder LH, Corbetta M, Raichle ME. Intrinsic functional architecture in the anaesthetized monkey brain. Nature. 2007;447:83–86. doi: 10.1038/nature05758. [DOI] [PubMed] [Google Scholar]
- Walker SC, Robbins TW, Roberts AC. Response disengagement on a spatial self-ordered sequencing task: effects of regionally selective excitotoxic lesions and serotonin depletion within the prefrontal cortex. J Neurosci. 2009;29:6033–6041. doi: 10.1523/JNEUROSCI.0312-09.2009. [DOI] [PMC free article] [PubMed] [Google Scholar]