

Abstract
The Ca2+-activated channel of intermediate-conductance (KCa3.1) is a target for antisickling and immunosuppressant agents. Many small peptides isolated from animal venoms inhibit KCa3.1 with nanomolar affinities and are promising drug scaffolds. Although the inhibitory effect of peptide toxins on KCa3.1 has been examined extensively, the structural basis of toxin-channel recognition has not been understood in detail. Here, the binding modes of two selected scorpion toxins, charybdotoxin (ChTx) and OSK1, to human KCa3.1 are examined in atomic detail using molecular dynamics (MD) simulations. Employing a homology model of KCa3.1, we first determine conduction properties of the channel using Brownian dynamics and ascertain that the simulated results are in accord with experiment. The model structures of ChTx-KCa3.1 and OSK1-KCa3.1 complexes are then constructed using MD simulations biased with distance restraints. The ChTx-KCa3.1 complex predicted from biased MD is consistent with the crystal structure of ChTx bound to a voltage-gated K+ channel. The dissociation constants (Kd) for the binding of both ChTx and OSK1 to KCa3.1 determined experimentally are reproduced within fivefold using potential of mean force calculations. Making use of the knowledge we gained by studying the ChTx-KCa3.1 complex, we attempt to enhance the binding affinity of the toxin by carrying out a theoretical mutagenesis. A mutant toxin, in which the positions of two amino acid residues are interchanged, exhibits a 35-fold lower Kd value for KCa3.1 than that of the wild-type. This study provides insight into the key molecular determinants for the high-affinity binding of peptide toxins to KCa3.1, and demonstrates the power of computational methods in the design of novel toxins.
Introduction
Ca2+-activated potassium (KCa) channels are activated by low concentrations of intracellular Ca2+ (1). They play important physiological roles and are implicated in a number of neurological, cardiovascular, and psychiatric disorders (2). Furthermore, the KCa channel of intermediate-conductance (KCa3.1) is a promising target for the treatment of sickle cell anemia (3,4). Specific inhibitors of KCa3.1 thus may be developed as antisickling and immunosuppressant agents (3,5–7).
Many peptide toxins isolated from venoms of animals such as scorpions and sea anemone block KCa3.1 potently with dissociation constants (Kd) in the nanomolar range (1). Among the most widely studied are maurotoxin (MTx, Kd = 1 nM), charybdotoxin (ChTx, Kd = 5 nM), ShK (Kd = 30 nM), and OSK1 (Kd = 225 nM) (8,9). These toxins are short polypeptides containing 30–40 amino acids, whose backbones typically consist of one α-helix and two/three β-sheets. Between three and four disulfide bridges forming the inhibitor cysteine knot stabilize the backbones of the toxins (10). Although these toxins inhibit KCa3.1 with high potency, their pharmacological application is limited by poor specificity. For example, MTx blocks the voltage-gated potassium (Kv) channel Kv1.2 with a Kd of 0.7 nM (11), whereas ChTx inhibits Kv1.2 with a Kd of 14 nM (12). On the other hand, OSK1 blocks Kv1.3 with a Kd of 0.01 nM (9).
Computational approaches such as molecular dynamics (MD) simulations have been widely used to study the binding of toxins to biological ion channels at an atomic level (13,14). Such studies provide insight into the interactions between the toxin and the channel that are otherwise difficult to probe by using available experimental techniques. MD simulations performed on Kv channels demonstrate that pore blocker toxins physically occlude the ion conduit of the channel with the side chain of a lysine residue (13). This lysine is frequently located in the β-strand immediately preceded by the α-helix. The key lysine forms a hydrogen bond with the carbonyl groups of a ring of four tyrosine residues lining the channel filter. The toxin-channel complex is further stabilized by one or more hydrogen bonds and salt bridges between the toxin and the outer vestibule of the channel (13). The longest principal axis of the toxin is perpendicular and the shortest principal axis approximately parallel to the channel axis on the binding of the toxin to the channel (15). In this way the area of contact interface between the toxin and the channel is maximized. A computational study performed on MTx and KCa3.1 suggests that the general principles of toxin-channel interactions observed for Kv channels may also be applicable to KCa3.1 (16).
Here, the binding modes of ChTx and OSK1 to KCa3.1 are examined in atomic detail using computational methods. MD simulations with distance restraints are used to predict the structures of toxin-channel complexes. The Kd value for the dissociation of each complex is derived from potential of mean force (PMF) calculations and compared to experiment. Analysis of interacting residue pairs in ChTx-KCa3.1 and OSK1-KCa3.1 complexes suggest that Asp-239 of the channel is important for high affinity toxin-channel association. Finally, a mutant ChTx, the affinity of which for KCa3.1 is predicted to be 35-fold higher than that of the wild-type (WT), is designed based on the model of ChTx-KCa3.1 predicted.
Methods
Homology modeling
The sequence of the human KCa3.1 channel is retrieved from the protein database of the National Center for Biotechnology Information (entry NP_002241.1). A model of the KCa3.1 pore domain is constructed using SWISS-MODEL (17–19), using the crystal structure of the Kv1.2 channel in the open state as a template (20). A sequence alignment between the pore domain of KCa3.1 and Kv1.2 is given in Fig. 1 A. The intracellular half of the S5 helix of KCa3.1 (residues 200 to 211) is not modeled due to the low sequence identity between KCa3.1 and Kv1.2 in this region. This truncation should not affect toxin binding significantly, because the S5 helix does not interact with toxins directly and the resulting model is stable in a lipid bilayer. The maximum root mean-square deviation of the channel backbone with reference to the initial model is 3 Å to 4 Å in all subsequent simulations.
Figure 1.
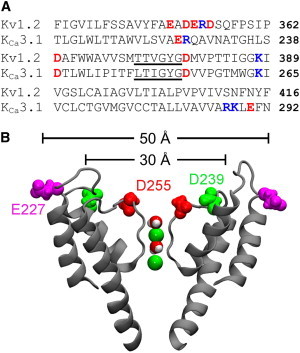
Sequence and structure of KCa3.1. (A) Primary structure of the pore domain of KCa3.1 aligned with that of Kv1.2. The selectivity filter region is highlighted with an underscore. (B) Structure of KCa3.1 model viewed perpendicular to the channel axis. Two K+ ions and water molecules in the selectivity filter are displayed. Only two channel subunits are shown as gray ribbons for clarity. To see this figure in color, go online.
The structure of the pore domain is well conserved in K+ channels. For example, crystal structures of the bacterial KCa channel MthK show that high structural similarity exists between KCa channels and voltage-gated K+ channels (21–23). Therefore, the KCa3.1 structure modeled on Kv1.2 is expected to be of reasonable quality, although the sequence identity between KCa3.1 and Kv1.2 is under 30%, which is required for high-quality homology modeling in many cases (24). We show that using the model of KCa3.1 both the conduction properties of the channel and the experimentally determined Kd values for the block of two toxins is reproduced, suggesting that the model is reliable. In several previous studies the structure of the KcsA channel was successfully used as a template for the homology modeling of KCa channels including KCa3.1 (16,25).
Brownian dynamics
To validate the homology model of KCa3.1, three-dimensional Brownian dynamics simulations are carried out to deduce the conductance of ions through the channel (26). In these simulations, 14 K+ and 14 Cl− ions are placed in each of the two cylindrical reservoirs of 30 Å in radius connected to the channel. The ion concentration is 0.14 M in both reservoirs. The position and velocity of each ion evolves according to a stochastic dynamical system. The electrostatic forces experienced by the ions are derived from precalculated lookup tables containing the solutions to Poisson’s equation (27). The adaptive Poisson-Boltzmann Solver (28) is used to derive the electric field generated by the partial charges in the channel protein. A time step of 100 fs is used in the reservoirs and 2 fs in the channel. Each simulation is run for 10 μs. The current is computed from the number of ions that pass through an imaginary plane near the end of the channel during a simulation period. For further technical details see Chung et al. (26,29).
MD simulations
The model structure of KCa3.1 is embedded in a 1-palmitoyl-2-oleoyl-sn-glycero-3-phosphocholine bilayer of 67 lipids per leaflet and a box of explicit water (14,301 water molecules), and then 54 K+ and Cl− ions each are added, corresponding to a salt concentration of 0.2 M. Two K+ ions are moved to the S2 and S4 binding sites of the selectivity filter, with the S1 and S3 ion binding sites occupied by two water molecules (Fig. 1 B). The system is equilibrated for 5 ns, and the simulation box evolves to ∼77 × 77 × 106 Å3 in size. A view of the simulation box is given in Fig. S1 A of the Supporting Material. During the equilibrium, the side chain of one of the four aspartate residues at position 255 changes from a downward to an upward orientation. No significant conformational changes to the filter are observed in all subsequent simulations without restraints.
After the equilibration, each toxin molecule is added into the simulation box 15 Å above the position where the toxin is fully bound. The NMR structures 2A9H (30) and 1SCO (31) are used for ChTx and OSK1, respectively. In both toxins Lys-27 is believed to be the key residue that occludes the selectivity filter of a channel on block (30,32). Gly-252 of KCa3.1 is located inside the filter, just below Tyr-253, which forms hydrogen bonds with the toxin. Thus, a flat-bottom harmonic distance restraint (1 kcal mol−1 Å−2) is applied to the side-chain nitrogen atom of Lys-27 and the carbonyl group of Gly-252. The upper boundary of the distance restraint is progressively reduced from 15 Å to 3 Å over a simulation period of 5 ns, such that the side chain of Lys-27 is gradually drawn into the filter. The backbone of the toxin is maintained rigid. The simulation is extended for a further 25 ns with the distance restraint removed, allowing the toxin-channel complex to stabilize.
All MD simulations are performed under periodic boundary conditions using NAMD 2.9 (33). The CHARMM36 force fields for lipids (34) and proteins (35) and the TIP3P model for water (36) are used to describe the interatomic interactions in the system. The switch and cutoff distances for short-range interactions are set to 8.0 Å and 12.0 Å, respectively. The long-range electrostatic interactions are accounted for using the particle mesh Ewald method, with a maximum grid spacing of 1.0 Å. Bond lengths are maintained rigid with the SHAKE (37) and SETTLE (38) algorithms. A time step of 2 fs is used. The temperature and pressure are maintained constant at 300 K on average by using the Langevin dynamics (damping coefficient 1 ps−1), and an average of 1 atm by using the Nosé-Hoover Langevin Piston method (39), respectively. The barostat oscillation and damping timescale are set to 200 and 100 ps, respectively. The pressure coupling is semiisotropic. Trajectories are saved every 20 ps for analysis.
Umbrella sampling
The PMF profile for the dissociation of each toxin from the KCa3.1 channel along the channel axis is constructed using the umbrella sampling method, and the corresponding Kd value is derived according to Eq. 1. Using the same method the Kd value for the binding of μ-conotoxin PIIIA to the bacterial sodium channel NaVAb was predicted to be 30 pM (40), in close proximity to the value of 5 pM determined in subsequent experiments (41).
A constant force of 10–20 kcal mol−1 Å−1 is applied to pull the toxin out from the binding site, allowing the starting structures of the umbrella windows spaced at 0.5 Å intervals to be generated. The backbones of both the toxin and the channel are maintained rigid during the pulling. The center of mass (COM) of the toxin backbone is restrained to the center of each umbrella window using a harmonic force constant of 30 kcal mol−1 Å−2 in subsequent umbrella sampling simulations. The COM of the channel is at z = 0 Å. A flat-bottom harmonic restraint is applied to maintain the COM of the toxin backbone within a cylinder of 8 Å in radius centered on the channel axis. The radius of the cylinder is large enough such that the restraining potential is always zero when the toxin is bound. Each umbrella window is simulated for up to 8 ns until the depth of the PMF profile changes by <0.3 kT over the last 2 ns. The first 1 ns of each window is removed from data analysis. The z coordinate of the toxin COM is saved every 1 ps for analysis.
Data analysis
A salt bridge is considered to be formed if the distance is <4 Å between a side-chain oxygen atom from an acidic residue and a side-chain nitrogen atom from a basic residue (42). A hydrogen bond is considered to be formed if the donor and acceptor atoms are within 3.0 Å of each other and the donor-hydrogen-acceptor angle is ≥150° (43). The length of a salt bridge is defined as the distance between the COM of the oxygen atoms in the side chain of the acidic residue and COM of the nitrogen atoms in the side chain of the basic residue. Both hydrogen and heavy atoms are considered in the calculations of interresidue distances. The weighted histogram analysis method is used to construct the PMF profile (44). The Kd value is derived using the following equation, the derivation of which is given by Allen et al. (45) and Gordon et al. (13):
| (1) |
where R is the radius of the cylinder (8 Å), NA is Avogadro’s number, zmin and zmax are the boundaries of the binding site along the channel axis (z), and W(z) is the PMF.
Results and Discussion
Outer vestibule of KCa3.1
The outer vestibule of KCa3.1 carries three rings of acidic residues as illustrated in Fig. 1 B and Fig. S1 B. The inner ring, formed by four aspartates at position 255, is located just outside the selectivity filter. The middle ring, also formed by four aspartates at position 239, is located further from the filter. The distance between each Asp-239 and the channel axis is ∼15 Å. The outer ring, formed by four glutamate residues at position 227 of the P-loop turret, is ∼25 Å in radius. In several Kv channels such as Kv1.1, Kv1.2, and Kv1.3, residues at positions corresponding to 239 and 255 of KCa3.1 are also aspartates. These aspartates have been shown to play important roles in the binding of peptide toxins to Kv channels (15,46). Thus, the model of KCa3.1 is consistent with many potent toxins of Kv channels also being highly effective for KCa3.1 as discussed in the Introduction section.
Ion conduction of KCa3.1
We first ascertain that the homology model of KCa3.1 we use for studying toxin binding correctly replicates the experimentally determined conduction properties of the channel. Brownian dynamics simulations reveal that there are three predominant ion binding sites in the channel during conduction (Fig. 2 A). These three sites correspond closely to S0, S2, and S4 ion binding sites of KcsA (47). The channel is inwardly rectifying, with the outward conductance at 50 mV of 9.3 pS and the inward conductance at −100 mV of 28.3 pS. The current-voltage curve of the model channel determined from Brownian dynamics simulations are displayed in Fig. 2 B. The corresponding experimental data of Ishii et al. (48) and Jensen et al. (49) are also displayed in the figure. The current-voltage curve deduced from the model is in accord with experiment, indicating that the model structure of KCa3.1 is of reasonable quality.
Figure 2.
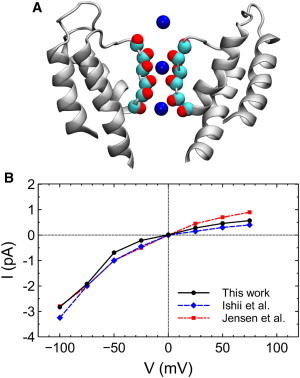
(A) Three most favorable binding sites of K+ ions in the selectivity filter of KCa3.1 identified from Brownian dynamics simulations. (B) The current-voltage (I/V) curve of KCa3.1. Experimental data of Ishii et al. (48) and Jensen et al. (49) are also shown in the figure. To see this figure in color, go online.
Binding of ChTx
With rapid advances in the MD simulation technique, it has become possible to simulate the pore block of K+ channels by simple molecules such as a variant of spermine realistically (50). However, spontaneous block of a peptide toxin to a K+ channel is still challenging due to the limited timescale accessible to atomistic MD simulations. Molecular docking programs and MD simulations biased with distance restraints have been widely used to predict the structure of a toxin in complex with a channel (13,14). In particular, biased MD has been shown to be an efficient and reliable method for the prediction of toxin-channel complex structures (46,52,53). Here, we apply this method to examine the binding of ChTx, which is one of the most potent blockers of KCa3.1.
A distance restraint is applied to steer the binding of ChTx to KCa3.1 during the first 5 ns of the simulation, as described in the Methods section. The toxin is observed to bind firmly to the outer vestibule of the channel at 5 ns. To verify the stability of the complex, the simulation is extended to 30 ns. The lengths of the Arg-25-Asp-239 and Arg-34-Asp-255 salt bridges in the complex are observed to fluctuate minimally around 3.4 Å and 4.5 Å, respectively (Fig. 3 A), with the side chain of Lys-27 persistently occluding the filter. These observations suggest that the complex structure is stable and does not evolve substantially over the last 25 ns.
Figure 3.
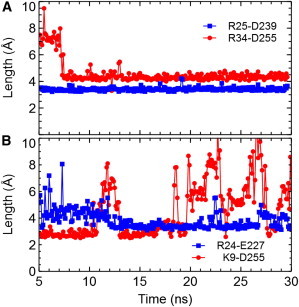
Lengths of the salt bridges in the complexes ChTx-KCa3.1 (A) and OSK1-KCa3.1 (B) as a function of simulation time. To see this figure in color, go online.
The ChTx-KCa3.1 complex predicted from the biased MD simulation reveals that the side chain of ChTx Lys-27 wedges into the selectivity filter (Fig. 4). The bound structure is stabilized by three favorable electrostatic contacts. The first is in the selectivity filter of the channel, where a hydrogen bond is observed between the side chain of ChTx Lys-27 and the backbone carbonyl group of Tyr-253 from the channel (Fig. 4 A). The second and third contacts are located on the outer vestibular wall, where two salt bridges are formed (Fig. 4 B). The first salt bridge Arg-25-Asp-239, with an average length of 3.4 Å, appears to be stronger than the second salt bridge Arg-34-Asp-255 whose length is 4.5 Å on average (Fig. 3 A).
Figure 4.
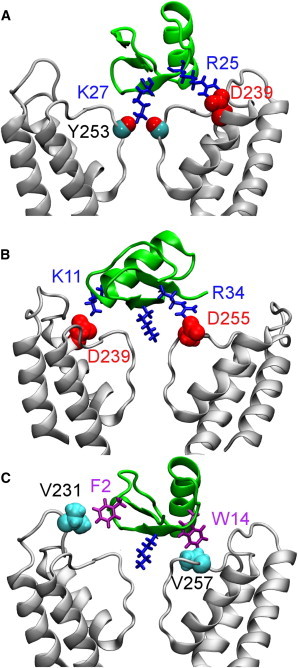
Structure of ChTx-KCa3.1 predicted from a MD simulation of 30 ns. In (A), the salt bridge Arg-25-Asp-239 is highlighted. In (B), residue pairs Arg-34-Asp-255 and Lys-11-Asp-239 are shown. In (C), two key hydrophobic residue pairs are displayed. To see this figure in color, go online.
In addition to the three charged residue pairs described previously, several hydrophobic clusters are observed, which should also contribute significantly to the formation of the stable ChTx-KCa3.1 complex. In particular, Trp-14 of ChTx is in strong coupling with Val-257 of the channel (Fig. 4 C). Phe-2 of ChTx is in close proximity to Val-231 of KCa3.1, with an average distance of 3.0 Å. Table S1 shows the interacting residue pairs in the ChTx-KCa3.1 complex. Both hydrophobic and polar residues are found in the interface of the complex, indicating that electrostatic as well as hydrophobic interactions are involved in the recognition of ChTx by KCa3.1.
Binding of OSK1
We next examine the binding of OSK1 to KCa3.1. OSK1 is of interest as it is an extremely potent blocker of Kv1.3 (Kd = 14 pM) but its affinity for KCa3.1 (Kd = 225 nM) is four orders of magnitude lower (9). In contrast, ChTx inhibits Kv1.3 (Kd = 3 nM) and KCa3.1 (Kd = 5 nM) with equal affinities (8,12).
After the first 5 ns of simulation in which a distance restraint is applied to Lys-27-Gly-252, OSK1 is observed to bind firmly to the outer vestibule of KCa3.1. The simulation is extended until 30 ns without the distance restraint. Over the last 25 ns, the OSK1-KCa3.1 complex is observed to be stable. Fig. 3 B shows that two salt bridges of the complex formed during the first 5 ns remain intact at 30 ns, although the Lys-9-Asp-255 salt bridge forms and breaks at times. Furthermore, the strength of the two salt bridges seems to be anticorrelated; one salt bridge is strong (short length) when the other is week (high length).
The position of OSK1 relative to the outer vestibule of KCa3.1 is shown in Fig. 5. In this complex, the side chain of toxin Lys-27 occludes the channel filter. Two salt bridges, Lys-9-Asp-255 and Arg-24-Glu-227, are observed on the outer wall of the channel (Fig. 5 A). In addition, the toxin also forms strong hydrophobic interactions primarily with residues Val-231 and Val-257 of the channel (Table S1). For example, Ile-10 and Leu-15 of OSK1 are in close proximity to Val-231, whereas Phe-25 is strongly coupled with Val-257 (Fig. 5 B). The strong electrostatic and hydrophobic interactions observed are consistent with the stable OSK1-KCa3.1 complex observed over the last 25 ns of the simulation.
Figure 5.
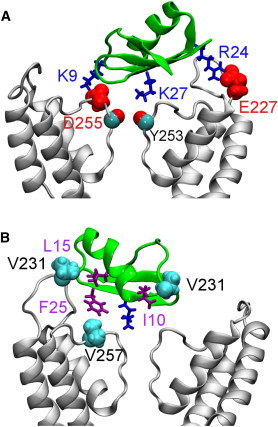
Structure of OSK1-KCa3.1 predicted from a MD simulation of 30 ns. In (A) two salt bridges (Lys-9-Asp-255 and Arg-24-Glu-227) are shown. In (B), three hydrophobic contacts (Ile-10-Val-231, Leu-15-Val-231, and Phe-25-Val-257) are illustrated. To see this figure in color, go online.
In the structure of OSK1-KCa3.1, the side chain of toxin Lys-27 does not protrude deeply into the filter (Fig. 5). This shallow binding is not observed in the ChTx-KCa3.1 complex (Fig. 4). To verify the complex structure of OSK1-KCa3.1, three additional calculations are performed. First, starting from the structure of Fig. 5 a distance restraint is applied to OSK1 Lys-27 and KCa3.1 Gly-252 such that the side chain of Lys-27 is pulled further into the filter over a simulation period of 2 ns. However, the Lys-9-Asp-255 salt bridge is observed to break (Fig. S2 A). In addition, Lys-27 of OSK1 moves out from the filter rapidly when the simulation is continued for a further 3 ns with the distance restraint removed. Second, a molecular docking calculation is performed on OSK1 and KCa3.1 using the docking program ZDOCK following the approach applied previously (15,54). Lys-27 also adopts a shallow mode in the most highly ranked structure predicted by the docking program (Fig. S2 B), and the orientation of the toxin are consistent with that predicted from the MD simulation (Fig. 5). Finally, the biased MD simulation is repeated a second time for 15 ns, in which a distance restraint is applied to Lys-27-Gly-252 during the first 5 ns. The penetration of Lys-27 into the filter is again shallow (Fig. S2 C). However, toxin Arg-24 is observed to form a salt bridge with Asp-239 of KCa3.1 rather than Glu-227 (Fig. 5 and Fig. S2 C). The difference in the free energy of the two different binding modes is only ∼1.5 kT (Fig. S2 D), suggesting that OSK1-KCa3.1 may switch between alternative binding modes, with the mode in Fig. 5 being slightly more favored. It is concluded that the side chain of Lys-27 of OSK1 does not protrude deeply into the filter of KCa3.1.
PMF profiles
To verify if the predicted model structures of toxin-channel complexes displayed in Figs. 4 and 5 are good representations of toxin binding, the PMF profiles for the dissociation of ChTx and OSK1 from KCa3.1 are constructed using umbrella sampling. Convergence for the PMF profiles is obtained because the depths of the profiles change by <0.3 kT over the last 2 ns. The Kd values for both toxins derived according to Eq. 1 are within fivefold to that determined experimentally.
Fig. 6 shows that the shape of the PMF profiles for the two toxins differs significantly. For example, the minima of the PMF profile for OSK1 is located at a narrow region around z = 22.5 Å, whereas that for ChTx spans a wide region between z = 22 Å and z = 24 Å. In the bulk region (z > 38 Å), the two PMF profiles are rather similar. This is expected because at long distances the interactions between the toxin and the channel are insignificant. In the region between the bulk and binding site (28 < z < 38 Å), the PMF profile for OSK1 is deeper than that for ChTx. This is partially due to the higher net charge of OSK1 (+8 e) compared to that of ChTx (+5 e), leading to stronger long-range electrostatic interactions with the negatively charged channel wall. The PMF profile for OSK1 is consistently shallower than that for ChTx near the outer vestibule of the channel (z < 28 Å), indicating that ChTx forms stronger short-range interactions with the channel. This observation is consistent with the binding modes of the two toxins to KCa3.1 observed (Figs. 4 and 5). ChTx penetrates deeply into the filter of the channel and is able to form two stable salt bridges with the channel (Fig. 3 A). On the other hand, OSK1 adopts a shallow binding mode in the filter and one of the two salt bridges it forms with the channel appears to be unstable (Fig. 3 B).
Figure 6.
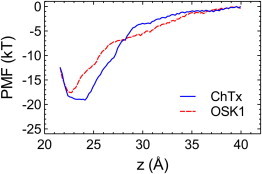
PMF profiles for the unbinding of ChTx and OSK1 from KCa3.1 along the channel axis (z). The reaction coordinate is the distance between the COM of the backbones of the toxin and the channel along z. To see this figure in color, go online.
The depth of the PMF profile for ChTx is about −19.5 kT, 2 kT lower than that for OSK1. The Kd value for ChTx calculated according to Eq. 1 is 24 nM, within fivefold to the value of 5 nM determined experimentally (8). The Kd value for OSK1 computed is 220 nM, which is very close to the experimental value of 225 nM (9). The close agreement of the Kd values derived for both toxins with those determined experimentally suggests that the model structures we predicted are representative of toxin biding.
The umbrella sampling simulations and PMF calculations further support a shallow penetration of OSK1 Lys-27 into the filter of the channel. The shallow mode of Fig. 5 is found to be representative of the umbrella window at z = 22.5 Å, whereas the deep mode of Fig. S2 corresponds closely to the window at z = 22.0 Å. According to the PMF profile derived from umbrella sampling simulations (Fig. 6), the shallow mode is ∼2 kT more energetically favorable than the deep mode.
Comparison to Kv1.3
The binding modes of several peptide toxins to Kv1.1, Kv1.2, and Kv1.3 channels have been examined in detail using computational methods (15,46,55–58). To deduce the mechanism by which OSK1 selectively inhibit Kv1.3, we compare the binding modes between the toxins and KCa3.1 to previous findings on Kv1.3. Detailed comparison suggests that the salt bridge Arg-25/Arg-24-Asp-239 is crucial for the high affinity binding of the toxins to KCa3.1 and Kv1.3.
In the structures of ChTx, OSK1 and a sea anemone toxin ShK in complex with Kv1.3, two key electrostatic contacts were observed, including one in the selectivity filter and the other on the outer vestibular wall of the channel (15). On the outer wall, an aspartate of Kv1.3 equivalent to Asp-239 of KCa3.1 was observed to form a salt bridge with an arginine of each toxin. The salt bridge was stable in OSK1-Kv1.3 and ShK-Kv1.3, but less stable in ChTx-Kv1.3 (15). It was proposed that the lower stability of this salt bridge partially accounts for the lower affinity of ChTx than that of the other two toxins for Kv1.3 (15).
The ChTx-KCa3.1 complex reveals three strong electrostatic contacts, one of which is the Arg-25-Asp-239 salt bridge (average length 3.4 Å) equivalent to the key salt bridge observed in OSK1-Kv1.3 and ShK-Kv1.3 previously (15). As the key salt bridge is present in both ChTx-KCa3.1 and ChTx-Kv1.3, ChTx is expected to be equally potent for KCa3.1 and Kv1.3, consistent with experimental observations (8,12). In contrast, the salt bridge Arg-24-Asp-239 is not found in the most favorable model of the OSK1-KCa3.1 complex (Fig. 5). Although two other salt bridges are observed in OSK1-KCa3.1, neither appears to be strong. For example, the Lys-9-Asp-255 salt bridge is relatively unstable, whereas Arg-24-Glu-227 has a length of as large as 3.9 Å on average (Fig. 3 B). In addition, Lys-27 of OSK1 does not wedge deeply into the filter of the channel (Fig. 5). Therefore, our model is consistent with the high selectivity of OSK1 for Kv1.3 over KCa3.1 observed experimentally (9).
A double mutant of ChTx
The complex of ChTx-KCa3.1 reveals that Ser-10 of the toxin is in close proximity to Asp-255 of the channel (Fig. 7 A). Substitution of this serine with a basic residue is expected to increase the binding affinity of the toxin substantially, if the structure of the toxin is not significantly altered by the mutation. On the other hand, Lys-32 of the toxin is in the water phase, and not in direct contact with any residues from the channel. Substitution of Lys-32 with a neutral residue should not cause a substantial change to the toxin affinity.
Figure 7.
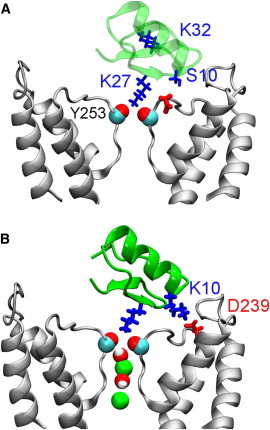
Model structures of the WT (A) and K10S32 mutant (B) ChTx in complex with KCa3.1. In (B), two ions and water molecules in the filter are highlighted. To see this figure in color, go online.
We reasoned that exchanging residues 10 and 32 would enhance the affinity of ChTx for KCa3.1. Following this conjecture, a model of ChTx-[K10S32] in complex with KCa3.1 is constructed by exchanging the side chains of Ser-10 and Lys-32 from the toxin in the ChTx-KCa3.1 complex (Fig. 4). The structure is equilibrated for 10 ns without restraints. The equilibrated structure of ChTx-[K10S32]-KCa3.1 shows that Lys-10 forms a salt bridge with Asp-239 of the channel (Fig. 7 B). All the important salt bridges and hydrogen bonds found in ChTx-KCa3.1 are retained. Therefore, the mutant ChTx should be more potent for KCa3.1 than the WT due to the additional salt bridge it forms with the channel. The structures of the WT and mutant ChTx are displayed in Fig. 8 A. Subsequent PMF calculations show that the mutation reduces the binding free energy of ChTx-KCa3.1 by 4 kT. The PMF profile of ChTx-[K10S32] has a well depth of 23 kT (Fig. 8 B), corresponding to a Kd value of 0.7 nM, 35-fold lower than that of the WT (24 nM). The PMF profiles of the WT and mutant toxins differ by up to 2 kT in the bulk region (z > 30 Å), indicating that the distribution of charges on the toxin surface can affect binding affinity.
Figure 8.
(A) Structure of the WT and K10S32 mutant ChTx. (B) The PMF profiles for the unbinding of ChTx and its K10S32 mutant from KCa3.1 along the channel axis (z). To see this figure in color, go online.
Conclusions
In this work, the binding of two scorpion toxins, ChTx and OSK1, to the pore domain of KCa3.1 is examined in detail using MD simulations. Model structures of ChTx-KCa3.1 and OSK1-KCa3.1 complexes are constructed using MD simulations biased with distance restraints. The complex structures reveal that both toxins form three strong electrostatic contacts with the channel, including one hydrogen bond and two salt bridges. These strong interactions together with several hydrophobic clusters render the high-affinity binding of the toxins to KCa3.1. The dissociation constant Kd of each complex derived computationally is in accord with that determined experimentally. Moreover, the interacting residue pairs of our ChTx-KCa3.1 model are in accord with the crystal structure of ChTx-Kv1.2, in which equivalent salt bridges are formed (59).
The salt bridge Arg-24-Asp-239, which was shown to be crucial for the binding of OSK1 to Kv1.3 (15), is not observed in the most favorable OSK1-KCa3.1 complex. This suggests that this salt bridge might be crucial for the selectivity of OSK1 for Kv1.3 over KCa3.1. This also indicates that a toxin can form drastically different contacts on binding to similar channels, consistent with previous studies (46,58). Therefore, the interacting residue pairs identified from one toxin-channel complex cannot be readily generalized to another. This highlights the importance of using computational methods such as MD simulations biased with distance restraints to construct reliable models of toxin-channel complexes with low computational cost.
A toxin-channel complex structure predicted from computational methods must be validated against experimental data. Mutagenesis experiments such as alanine scanning provide valuable information on the key residues involved in binding. However, such experiments are suitable for comparison only if the mutation does not induce significant structural changes to the toxin or channel protein. The dissociation constant Kd, which can be measured both experimentally and computationally, provides a unique quantity on which the model could be verified. For the Kd value derived from computational methods to be reliable, the configuration of ions in the filter must be modeled appropriately. There are five ion binding sites (S0–S4) in the filter. When a toxin is bound to a channel, the S0 site is occupied by the side chain of a lysine residue from the toxin. In the present and our previous studies (15,46), the S2 and S4 sites are filled by a K+ ion each, whereas the S1 and S3 sites are occupied by water molecules (Fig. 1 B). This ion configuration remains stable in the presence of a bound toxin (Fig. 7 B). The ion configuration in our models is consistent with crystallographic data (59). However, in several other studies the S4 site but not S2 is filled by a K+ ion (60), or the filter is completely free of ions (56). Such ion configurations may have a significant effect on the structures and energetics of the toxin-channel complex. For example, the channel filter can deform into a nonconducting state in the absence of a water molecule or ion at the S2 site (61). Furthermore, a deeper well depth in the PMF profile would be obtained if fewer ions are present in the filter (56).
It is possible to remodel a toxin to alter its binding affinity to a channel, once accurate structure of the toxin-channel complex is deduced, from crystallographic data or MD simulations. We demonstrate here that the ability of ChTx to block KCa3.1 can be enhanced by interchanging the positions of two amino acid residues in the toxin. Thus, computational studies such as the one we employed for this study may prove to be useful for structure-based design of selective channel blockers.
Acknowledgments
This research was undertaken on the National Computational Infrastructure in Canberra, Australia, which is supported by the Australian Commonwealth Government.
This work was supported by the National Health and Medical Research Council of Australia and The Medical Advances Without Animals Trust (MAWA).
Supporting Material
References
- 1.Wei A.D., Gutman G.A., Wulff H. International Union of Pharmacology. LII. Nomenclature and molecular relationships of calcium-activated potassium channels. Pharmacol. Rev. 2005;57:463–472. doi: 10.1124/pr.57.4.9. [DOI] [PubMed] [Google Scholar]
- 2.Faber E.S., Sah P. Calcium-activated potassium channels: multiple contributions to neuronal function. Neuroscientist. 2003;9:181–194. doi: 10.1177/1073858403009003011. [DOI] [PubMed] [Google Scholar]
- 3.Brugnara C., Gee B., Platt O.S. Therapy with oral clotrimazole induces inhibition of the Gardos channel and reduction of erythrocyte dehydration in patients with sickle cell disease. J. Clin. Invest. 1996;97:1227–1234. doi: 10.1172/JCI118537. [DOI] [PMC free article] [PubMed] [Google Scholar]
- 4.Hoffman J.F., Joiner W., Wickrema A. The hSK4 (KCNN4) isoform is the Ca2+-activated K+ channel (Gardos channel) in human red blood cells. Proc. Natl. Acad. Sci. USA. 2003;100:7366–7371. doi: 10.1073/pnas.1232342100. [DOI] [PMC free article] [PubMed] [Google Scholar]
- 5.Wulff H., Miller M.J., Chandy K.G. Design of a potent and selective inhibitor of the intermediate-conductance Ca2+-activated K+ channel, IKCa1: a potential immunosuppressant. Proc. Natl. Acad. Sci. USA. 2000;97:8151–8156. doi: 10.1073/pnas.97.14.8151. [DOI] [PMC free article] [PubMed] [Google Scholar]
- 6.Wang J., Xiang M. Targeting potassium channels Kv1.3 and KCa3.1: routes to selective immunomodulators in autoimmune disorder treatment? Pharmacotherapy. 2013;33:515–528. doi: 10.1002/phar.1236. [DOI] [PubMed] [Google Scholar]
- 7.Lam J., Wulff H. The lymphocyte potassium channels Kv1.3 and KCa3.1 as targets for immunosuppression. Drug Dev. Res. 2011;72:573–584. doi: 10.1002/ddr.20467. [DOI] [PMC free article] [PubMed] [Google Scholar]
- 8.Chandy K.G., Wulff H., Cahalan M.D. K+ channels as targets for specific immunomodulation. Trends Pharmacol. Sci. 2004;25:280–289. doi: 10.1016/j.tips.2004.03.010. [DOI] [PMC free article] [PubMed] [Google Scholar]
- 9.Mouhat S., Visan V., Sabatier J.-M. K+ channel types targeted by synthetic OSK1, a toxin from Orthochirus scrobiculosus scorpion venom. Biochem. J. 2005;385:95–104. doi: 10.1042/BJ20041379. [DOI] [PMC free article] [PubMed] [Google Scholar]
- 10.Pallaghy P.K., Nielsen K.J., Norton R.S. A common structural motif incorporating a cystine knot and a triple-stranded β-sheet in toxic and inhibitory polypeptides. Protein Sci. 1994;3:1833–1839. doi: 10.1002/pro.5560031022. [DOI] [PMC free article] [PubMed] [Google Scholar]
- 11.Visan V., Fajloun Z., Grissmer S. Mapping of maurotoxin binding sites on hKv1.2, hKv1.3, and hIKCa1 channels. Mol. Pharmacol. 2004;66:1103–1112. doi: 10.1124/mol.104.002774. [DOI] [PubMed] [Google Scholar]
- 12.Grissmer S., Nguyen A.N., Chandy K.G. Pharmacological characterization of five cloned voltage-gated K+ channels, types Kv1.1, 1.2, 1.3, 1.5, and 3.1, stably expressed in mammalian cell lines. Mol. Pharmacol. 1994;45:1227–1234. [PubMed] [Google Scholar]
- 13.Gordon D., Chen R., Chung S.H. Computational methods of studying the binding of toxins from venomous animals to biological ion channels: theory and applications. Physiol. Rev. 2013;93:767–802. doi: 10.1152/physrev.00035.2012. [DOI] [PMC free article] [PubMed] [Google Scholar]
- 14.Rashid M.H., Mahdavi S., Kuyucak S. Computational studies of marine toxins targeting ion channels. Mar. Drugs. 2013;11:848–869. doi: 10.3390/md11030848. [DOI] [PMC free article] [PubMed] [Google Scholar]
- 15.Chen R., Robinson A., Chung S.H. Modeling the binding of three toxins to the voltage-gated potassium channel (Kv1.3) Biophys. J. 2011;101:2652–2660. doi: 10.1016/j.bpj.2011.10.029. [DOI] [PMC free article] [PubMed] [Google Scholar]
- 16.Yi H., Qiu S., Wang B. Differential molecular information of maurotoxin peptide recognizing IKCa and Kv1.2 channels explored by computational simulation. BMC Struct. Biol. 2011;11:3. doi: 10.1186/1472-6807-11-3. [DOI] [PMC free article] [PubMed] [Google Scholar]
- 17.Guex N., Peitsch M.C. SWISS-MODEL and the Swiss-PdbViewer: an environment for comparative protein modeling. Electrophoresis. 1997;18:2714–2723. doi: 10.1002/elps.1150181505. [DOI] [PubMed] [Google Scholar]
- 18.Schwede T., Kopp J., Peitsch M.C. SWISS-MODEL: an automated protein homology-modeling server. Nucleic Acids Res. 2003;31:3381–3385. doi: 10.1093/nar/gkg520. [DOI] [PMC free article] [PubMed] [Google Scholar]
- 19.Arnold K., Bordoli L., Schwede T. The SWISS-MODEL workspace: a web-based environment for protein structure homology modelling. Bioinformatics. 2006;22:195–201. doi: 10.1093/bioinformatics/bti770. [DOI] [PubMed] [Google Scholar]
- 20.Chen X., Wang Q., Ma J. Structure of the full-length Shaker potassium channel Kv1.2 by normal-mode-based X-ray crystallographic refinement. Proc. Natl. Acad. Sci. USA. 2010;107:11352–11357. doi: 10.1073/pnas.1000142107. [DOI] [PMC free article] [PubMed] [Google Scholar]
- 21.Jiang Y., Lee A., MacKinnon R. Crystal structure and mechanism of a calcium-gated potassium channel. Nature. 2002;417:515–522. doi: 10.1038/417515a. [DOI] [PubMed] [Google Scholar]
- 22.Posson D.J., McCoy J.G., Nimigean C.M. The voltage-dependent gate in MthK potassium channels is located at the selectivity filter. Nat. Struct. Mol. Biol. 2013;20:159–166. doi: 10.1038/nsmb.2473. [DOI] [PMC free article] [PubMed] [Google Scholar]
- 23.Ye S., Li Y., Jiang Y.X. Novel insights into K+ selectivity from high-resolution structures of an open K+ channel pore. Nat. Struct. Mol. Biol. 2010;17:1019–1023. doi: 10.1038/nsmb.1865. [DOI] [PMC free article] [PubMed] [Google Scholar]
- 24.Hillisch A., Pineda L.F., Hilgenfeld R. Utility of homology models in the drug discovery process. Drug Discov. Today. 2004;9:659–669. doi: 10.1016/S1359-6446(04)03196-4. [DOI] [PMC free article] [PubMed] [Google Scholar]
- 25.Wu Y.L., Cao Z.J., Li W.X. Simulation of the interaction between ScyTx and small conductance calcium-activated potassium channel by docking and MM-PBSA. Biophys. J. 2004;87:105–112. doi: 10.1529/biophysj.103.039156. [DOI] [PMC free article] [PubMed] [Google Scholar]
- 26.Chung S.H., Allen T.W., Kuyucak S. Modeling diverse range of potassium channels with Brownian dynamics. Biophys. J. 2002;83:263–277. doi: 10.1016/S0006-3495(02)75167-9. [DOI] [PMC free article] [PubMed] [Google Scholar]
- 27.Hoyles M., Kuyucak S., Chung S.H. Solutions of Poisson’s equation in channel-like geometries. Comput. Phys. Commun. 1998;115:45–68. [Google Scholar]
- 28.Baker N.A., Sept D., McCammon J.A. Electrostatics of nanosystems: application to microtubules and the ribosome. Proc. Natl. Acad. Sci. USA. 2001;98:10037–10041. doi: 10.1073/pnas.181342398. [DOI] [PMC free article] [PubMed] [Google Scholar]
- 29.Chung S.H., Allen T.W., Kuyucak S. Conducting-state properties of the KcsA potassium channel from molecular and Brownian dynamics simulations. Biophys. J. 2002;82:628–645. doi: 10.1016/S0006-3495(02)75427-1. [DOI] [PMC free article] [PubMed] [Google Scholar]
- 30.Yu L., Sun C., Olejniczak E.T. Nuclear magnetic resonance structural studies of a potassium channel-charybdotoxin complex. Biochemistry. 2005;44:15834–15841. doi: 10.1021/bi051656d. [DOI] [PubMed] [Google Scholar]
- 31.Jaravine V.A., Nolde D.E., Arseniev A.S. Three-dimensional structure of toxin OSK1 from Orthochirus scrobiculosus scorpion venom. Biochemistry. 1997;36:1223–1232. doi: 10.1021/bi9614390. [DOI] [PubMed] [Google Scholar]
- 32.Lange A., Giller K., Baldus M. Toxin-induced conformational changes in a potassium channel revealed by solid-state NMR. Nature. 2006;440:959–962. doi: 10.1038/nature04649. [DOI] [PubMed] [Google Scholar]
- 33.Phillips J.C., Braun R., Schulten K. Scalable molecular dynamics with NAMD. J. Comput. Chem. 2005;26:1781–1802. doi: 10.1002/jcc.20289. [DOI] [PMC free article] [PubMed] [Google Scholar]
- 34.Klauda J.B., Venable R.M., Pastor R.W. Update of the CHARMM all-atom additive force field for lipids: validation on six lipid types. J. Phys. Chem. B. 2010;114:7830–7843. doi: 10.1021/jp101759q. [DOI] [PMC free article] [PubMed] [Google Scholar]
- 35.MacKerell A.D., Bashford D., Karplus M. All-atom empirical potential for molecular modeling and dynamics studies of proteins. J. Phys. Chem. B. 1998;102:3586–3616. doi: 10.1021/jp973084f. [DOI] [PubMed] [Google Scholar]
- 36.Jorgensen W.L., Chandrasekhar J., Klein M.L. Comparison of simple potential functions for simulating liquid water. J. Chem. Phys. 1982;79:926–935. [Google Scholar]
- 37.Ryckaert J.P., Ciccotti G., Berendsen H.J.C. Numerical integration of the cartesian equations of motion of a system with constraints: molecular dynamics of n-alkanes. J. Comput. Phys. 1977;23:327–341. [Google Scholar]
- 38.Miyamoto S., Kollman P.A. SETTLE: an analytical version of the SHAKE and RATTLE algorithm for rigid water models. J. Comput. Chem. 1992;13:952–962. [Google Scholar]
- 39.Martyna G.J., Tobias D.J., Klein M.L. Constant pressure molecular dynamics algorithms. J. Chem. Phys. 1994;101:4177–4189. [Google Scholar]
- 40.Chen R., Chung S.H. Binding modes of μ-conotoxin to the bacterial sodium channel (NaVAb) Biophys. J. 2012;102:483–488. doi: 10.1016/j.bpj.2011.12.041. [DOI] [PMC free article] [PubMed] [Google Scholar]
- 41.Finol-Urdaneta R.K., Glavica R., French R.J. Polymodal, high affinity actions of μ-conotoxins on a bacterial voltage-gated sodium channel. Biophys. J. 2013;104:136a–137a. [Google Scholar]
- 42.Kumar S., Nussinov R. Close-range electrostatic interactions in proteins. ChemBioChem. 2002;3:604–617. doi: 10.1002/1439-7633(20020703)3:7<604::AID-CBIC604>3.0.CO;2-X. [DOI] [PubMed] [Google Scholar]
- 43.Mills J.E., Dean P.M. Three-dimensional hydrogen-bond geometry and probability information from a crystal survey. J. Comput. Aided Mol. Des. 1996;10:607–622. doi: 10.1007/BF00134183. [DOI] [PubMed] [Google Scholar]
- 44.Kumar S., Bouzida D., Rosenberg J.M. The weighted histogram analysis method for free-energy calculations on biomolecules. I. The method. J. Comput. Chem. 1992;13:1011–1021. [Google Scholar]
- 45.Allen T.W., Andersen O.S., Roux B. Energetics of ion conduction through the gramicidin channel. Proc. Natl. Acad. Sci. USA. 2004;101:117–122. doi: 10.1073/pnas.2635314100. [DOI] [PMC free article] [PubMed] [Google Scholar]
- 46.Chen R., Chung S.H. Structural basis of the selective block of Kv1.2 by maurotoxin from computer simulations. PLoS ONE. 2012;7:e47253. doi: 10.1371/journal.pone.0047253. [DOI] [PMC free article] [PubMed] [Google Scholar]
- 47.Roux B., Bernèche S., Yu H. Ion selectivity in channels and transporters. J. Gen. Physiol. 2011;137:415–426. doi: 10.1085/jgp.201010577. [DOI] [PMC free article] [PubMed] [Google Scholar]
- 48.Ishii T.M., Silvia C., Maylie J. A human intermediate conductance calcium-activated potassium channel. Proc. Natl. Acad. Sci. USA. 1997;94:11651–11656. doi: 10.1073/pnas.94.21.11651. [DOI] [PMC free article] [PubMed] [Google Scholar]
- 49.Jensen B.S., Strobaek D., Ahring P.K. Characterization of the cloned human intermediate-conductance Ca2+-activated K+ channel. Am. J. Physiol. 1998;275:C848–C856. doi: 10.1152/ajpcell.1998.275.3.C848. [DOI] [PubMed] [Google Scholar]
- 50.Gordon D., Chen R., Chung S.H. Rigid body Brownian dynamics as a tool for studying ion channel blockers. J. Phys. Chem. B. 2012;116:1933–1941. doi: 10.1021/jp210105f. [DOI] [PubMed] [Google Scholar]
- 51.Reference deleted in proof.
- 52.Eriksson M.A., Roux B. Modeling the structure of agitoxin in complex with the Shaker K+ channel: a computational approach based on experimental distance restraints extracted from thermodynamic mutant cycles. Biophys. J. 2002;83:2595–2609. doi: 10.1016/S0006-3495(02)75270-3. [DOI] [PMC free article] [PubMed] [Google Scholar]
- 53.Chen R., Chung S.H. Complex structures between the N-type calcium channel (CaV2.2) and ω-conotoxin GVIA predicted via molecular dynamics. Biochemistry. 2013;52:3765–3772. doi: 10.1021/bi4003327. [DOI] [PubMed] [Google Scholar]
- 54.Mintseris J., Pierce B., Weng Z. Integrating statistical pair potentials into protein complex prediction. Proteins. 2007;69:511–520. doi: 10.1002/prot.21502. [DOI] [PubMed] [Google Scholar]
- 55.Jin L., Wu Y. Molecular mechanism of the sea anemone toxin ShK recognizing the Kv1.3 channel explored by docking and molecular dynamic simulations. J. Chem. Inf. Model. 2007;47:1967–1972. doi: 10.1021/ci700178w. [DOI] [PubMed] [Google Scholar]
- 56.Khabiri M., Nikouee A., Ettrich R. Charybdotoxin unbinding from the mKv1.3 potassium channel: a combined computational and experimental study. J. Phys. Chem. B. 2011;115:11490–11500. doi: 10.1021/jp2061909. [DOI] [PubMed] [Google Scholar]
- 57.Rashid M.H., Kuyucak S. Affinity and selectivity of ShK toxin for the Kv1 potassium channels from free energy simulations. J. Phys. Chem. B. 2012;116:4812–4822. doi: 10.1021/jp300639x. [DOI] [PubMed] [Google Scholar]
- 58.Mahdavi S., Kuyucak S. Why the Drosophila Shaker K+ channel is not a good model for ligand binding to voltage-gated Kv1 channels. Biochemistry. 2013;52:1631–1640. doi: 10.1021/bi301257p. [DOI] [PubMed] [Google Scholar]
- 59.Banerjee A., Lee A., Campbell E., Mackinnon R. Structure of a pore-blocking toxin in complex with a eukaryotic voltage-dependent K+ channel. eLife. 2013;2:e00594. doi: 10.7554/eLife.00594. [DOI] [PMC free article] [PubMed] [Google Scholar]
- 60.Chen P.C., Kuyucak S. Accurate determination of the binding free energy for KcsA-charybdotoxin complex from the potential of mean force calculations with restraints. Biophys. J. 2011;100:2466–2474. doi: 10.1016/j.bpj.2011.03.052. [DOI] [PMC free article] [PubMed] [Google Scholar]
- 61.Domene C., Klein M.L., Parrinello M. Conformational changes and gating at the selectivity filter of potassium channels. J. Am. Chem. Soc. 2008;130:9474–9480. doi: 10.1021/ja801792g. [DOI] [PubMed] [Google Scholar]
Associated Data
This section collects any data citations, data availability statements, or supplementary materials included in this article.