

Abstract
Using small-angle x-ray scattering (SAXS), we investigated the phase behavior of mesophases of monoolein (MO) mixed with additives commonly used for the crystallization of membrane proteins from lipidic mesophases. In particular, we examined the effect of sodium and potassium phosphate salts and the detergent β-octylglucoside (βOG) over a wide range of compositions relevant for the crystallization of membrane proteins in lipidic mesophases. We studied two types of systems: 1), ternary mixtures of MO with salt solutions above the hydration boundary; and 2), quaternary mixtures of MO with βOG and salt solutions over a wide range of hydration conditions. All quaternary mixtures showed highly regular lyotropic phase behavior with the same sequence of phases (Lα, Ia3d, and Pn3m) as MO/water mixtures at similar temperatures. The effects of additives in quaternary systems agreed qualitatively with those found in ternary mixtures in which only one additive is present. However, quantitative differences in the effects of additives on the lattice parameters of fully hydrated mesophases were found between ternary and quaternary mixtures. We discuss the implications of these findings for mechanistic investigations of membrane protein crystallization in lipidic mesophases and for studies of the suitability of precipitants for mesophase-based crystallization methods.
Introduction
Lipidic mesophases are liquid crystalline phases that form when certain lipids are mixed with water or aqueous solutions. These mesophases have a characteristic internal structure comprised of ordered lipid bilayers and aqueous channels. Depending on composition and temperature, mesophases may form with different arrangements of bilayers, referred to as phase types. Commonly observed phase types in lipidic mesophases are lamellar Lα, inverse hexagonal HII, and bicontinuous cubic phases. The latter are three-dimensional (3D)-ordered liquid crystals that consist of lipid bilayers with midplanes lying on infinite periodic minimal surfaces (IPMS) and an enclosed network of aqueous channels (1), as first identified by Longley and McIntosh (2). Bicontinuous cubic phases of Pn3m, Im3m, and Ia3d symmetries corresponding to IPMS of double diamond (D), primitive cubic (P), and gyroid (G) symmetries, respectively, have been reported in lipid systems (1). Mesophase formation has been observed in both synthetic and naturally occurring surfactant or lipid systems (3,4). Small-angle x-ray scattering (SAXS) is used to establish the phase type and the size of the unit cell of the mesophase (the lattice parameter) for all mesophase types.
Lipidic mesophases, especially those of the synthetic lipid monoolein (MO) from the 1-monoacylglycerol family, have been used extensively as matrices for crystallizing transmembrane proteins (5–9). The lipid bilayers of the mesophase provide a membrane-like environment for the transmembrane proteins that reside in cell membranes of living organisms, helping to maintain proteins in their native conformation. The crystallization protocol consists of two steps (7,10,11): 1), a detergent-stabilized protein solution is mixed with a lipid in a predefined ratio to form a mesophase; and 2), a precipitant solution, typically containing an inorganic salt with additives, is added to a protein-containing mesophase to induce crystal nucleation and growth. A bulk aqueous phase remains in coexistence with the mesophase throughout the trial after this step, i.e., the overall aqueous solution content in the mixture is above the hydration boundary of the mesophase (the onset of bulk aqueous phase separation).
Both phase transformations and the properties of the mesophase itself have highly important roles in mesophase-based protein crystallization (12–18). Detailed information about phase transformations in real, highly complex, multicomponent, multiphase crystallization mixtures would help to enhance our understanding of crystallogenesis. MO/water systems exhibit rich mesomorphism at temperatures relevant for protein crystallization, with Pn3m, Ia3d, or Lα mesophases forming depending on the hydration level and the thermal history of the sample (19,20). Both detergents (21–27) and salts (28–30), the two major nonprotein components in crystallization mixtures, affect the phase behavior of MO, but little has been done to explore their combined effects (21). Furthermore, few studies (21–24,27) controlled the MO/detergent ratio independently of the amount of aqueous phase, at variance with the crystallization protocol. The distributions of components between the phases in the two-phase system, and in turn the properties of the mesophase, are likely to depend on relative amounts of mesophase and solution. However, little information is available about the location of the hydration boundary in crystallization-like systems and about actual conditions experienced by the protein within the mesophase during crystallization.
Here, we report an analysis of the phase behavior of MO mesophases in the presence of the detergent β-octylglucoside (βOG) and sodium or potassium dihydrophosphate solutions. These conditions are commonly used in the crystallization of membrane proteins such as bacteriorhodopsin. We investigated two types of systems: 1), MO mixed with salt solutions above the hydration boundary; and 2), MO mixed with βOG and salt solutions in a wide range of hydration conditions. In the latter studies, we analyzed series of samples at constant βOG/MO ratios (RβOG/MO). For a given value of RβOG/MO, the salt solution content in the samples varied from 10 wt% to 80 wt%, covering a range of conditions below and above the hydration boundary. The phase types and the lattice parameters of all samples were established by SAXS. We discuss the trends in observed phase behavior, the distribution of components, and implications for membrane protein crystallization in general.
Materials and Methods
Sample preparation
Homogeneous solid mixtures with fixed ratios of MO and βOG were prepared gravimetrically. Target amounts of MO (99%; Sigma Aldrich, St. Louis, MO) and βOG (Anagrade; Anatrace, Maumee, OH) were weighed in a glass vial and dissolved in chloroform (≥99.8%; Sigma Aldrich). The solvent was removed under a stream of nitrogen gas. Solid samples were dried in a desiccator under vacuum at room temperature (21–23°C) overnight.
Solutions of potassium dihydrophosphate (Sigma-Aldrich) and sodium dihydrophosphate (EMD Chemicals, Billerica, MA) were prepared gravimetrically and adjusted to a pH of 5.5.
Mesophase samples containing solid MO or solid βOG/MO mixtures (the lipidic part) and salt solutions (the aqueous part) were formulated gravimetrically in a coupled-syringe mixer (7) at 21–23°C. The total mass of each sample with 50–90 wt% of the lipidic part was ∼40 mg. Samples containing 10-40 wt% of the lipidic part were prepared with ∼15 mg of the lipidic part.
After mixing, the samples were dispensed into up to five borosilicate glass capillaries (0.9 mm; Charles Supper, Natick, MA), depending on the amount of sample available. Capillaries were sealed with Critoseal (Leica Microsystems, Buffalo Grove, IL) and Quick-set epoxy (Henkel, Rocky Hill, CT) to minimize water loss. Samples were stored at –12°C in the dark between sample preparation and data collection to further avoid sample deterioration and water evaporation from the samples. This was especially important for the samples analyzed at the Advanced Photon Source (APS, Argonne National Laboratory, Argonne, IL), because they had to be prepared up to 3 weeks in advance. All samples were frozen at – 12°C for at least 12 hr to ensure consistent thermal history.
SAXS data collection and analysis
Prior to SAXS data collection, samples were equilibrated for at least 3 hr at the data collection temperature. For samples prepared with 1.3M NaH2PO4 and studied at two temperatures, 20°C and 25°C, the samples were kept at 20°C overnight and further equilibrated at 25°C for 4 h prior to SAXS data collection. Although freezing may affect the phase behavior of mesophases at low temperatures by triggering the transition from a metastable to a thermodynamically stable sequence of phases, metastability was not observed for MO/detergent mixtures in the temperature range of interest here (20–25°C) (23). We verified that freezing did not affect the microstructure of the mesophases at 20–25°C, and that the equilibration time employed here was sufficient to obtain equilibrium mesophase microstructure after thawing.
We collected SAXS data for samples prepared with NaH2PO4 solutions in a helium chamber using a rotating anode generator (M18XHF; Brucker, Madison, WI) that supplied a Cu Kα (λ = 1.541838 Å) radiation beam through a pinhole collimator. Kβ radiation was filtered out with a Ni filter. A Highstar multiwire detector (Brucker) was used to collect the data. Samples were mounted in a He chamber on an automated goniometer at a sample-to-detector distance of 63.2 cm, calibrated using a silver behenate standard (31). To prevent x-ray scattering by air, the chamber was continuously purged with helium gas during data collection. Temperature was maintained with the use of a custom-built, temperature-controlled sample holder. Diffractograms were convolved and integrated in Bruker-SAXS 4.0 software (Bruker AXS, Karlsruhe, Germany). Phase assignments were carried out based on the presence of characteristic sets of reflections of lipidic mesophases (8,32) and were done in DIFFRACplus Topas 3 (Bruker AXS).
SAXS data for samples prepared with KH2PO4 solutions were collected on beamline 21-ID-D at the APS with a beam energy of 8.048 keV. The beamline was equipped with a microdiffractometer (MD2; MAATEL, Voreppe, France) consisting of a goniometer, an XYZ micropositioner, and an on-axis video microscope. For SAXS measurements, a vacuum flight tube and an adjustable beam stop with an incorporated pin-diode were installed between the sample and the CCD detector (MX300; Rayonix, Evanston, IL) (33). Attenuation of the incident x-ray beam and exposure time were adjusted to minimize radiation damage (34). Raw diffractograms were integrated in Fit2D software (v. 12.077, A.P. Hammersley, ESRF, 1994 (http://www.esrf.eu)). Phase assignments were carried out based on the presence of characteristic sets of reflections for lipidic mesophases (8,32) using a set of MATLAB scripts (R2008a, v. 7.6.0.324; The MathWorks, Natick, MA).
Data analysis protocols are described in detail in the Supporting Material with sample diffractograms (Figs. S1 and S2). Typically, three or four SAXS measurements of different capillaries were carried out for each sample composition. Average values are used in all figures in this work. On average, the standard deviations (SDs) of lattice parameters for a given set of capillaries were 2.0 Å, 1.1 Å, and 0.16 Å for Pn3m, Ia3d, and Lα phases, respectively.
Validation of βOG/MO samples
To verify that the quality of the solid βOG/MO mixtures did not deteriorate during the formulation of homogeneous detergent/lipid mixtures, we prepared mesophase samples of identical overall compositions with 1), solid βOG/MO mixtures and phosphate buffer solution (25 mM NaH2PO4, pH 5.5); and 2), solid MO mixed with 5%, 10%, and 15% v/w solution of βOG in the same phosphate buffer. The phases identified in samples of identical compositions prepared by the two methods were identical. The lattice parameters of cubic phases and lamellar phases differed by less than 3 Å and 2 Å, respectively. These differences may be attributed to the inevitable slight deviations in the composition.
Results and Discussion
Below, we describe the effects of sodium and potassium phosphate salts and the detergent βOG on the phase behavior of MO mesophases. First, we investigate the effect of salt concentration in solution on the lattice parameter of fully hydrated MO mesophases. Second, we report the combined effects of phosphate salts and detergents on the phase behavior of MO mesophases over a wide range of hydration levels. We conclude by discussing the implications of our findings for membrane protein crystallization and for studies of crystallogenesis in meso.
To fully describe the composition of the multiphase multicomponent mixtures studied here, we use several compositional variables: csalt is the concentration of salt in solution used for sample formulation, waq is the overall weight fraction of salt solution in the sample, and φaq is the combined volume fraction of water and salt within the mesophase. Because salt ions are not expected to partition into lipid bilayers, φaq reflects the volume fraction of the aqueous compartments within the mesophase.
MO mixed with salt solutions
Fig. 1 shows the lattice parameters of monoolein mesophases prepared with K and Na phosphate salt solutions of 0.7–2.0 M in the range of waq values of 40–80 wt%. All mesophases in these systems were of the Pn3m type and all samples contained excess aqueous phase. Both K and Na salts caused the lattice parameter of the mesophase to decrease with increasing salt concentration, csalt, in quantitative agreement with available data (29). At matching csalt and waq, the lattice parameters of K and Na salt-containing mesophases differed, on average, by 1 Å.
Figure 1.

Lattice parameters of Pn3m mesophases containing MO and Na or K phosphate salt solutions as a function of salt concentration csalt for different overall loadings of the salt solution in the sample waq (40, 50, or 80 wt%). (A and B) Samples were prepared with solutions of (A) KH2PO4 at 25°C or (B) NaH2PO4 at 22.5°C. Error bars correspond to 1 SD (n = 3 or 4). Lines are linear fits to data.
Dependence of lattice parameters on the amount of excess salt solution
At identical values of csalt, lattice parameters were found to increase with the total amount of solution waq in the mixture (Fig. 1). These variations likely resulted from the redistribution of salt between the aqueous compartments (the internal aqueous phase) of the Pn3m mesophase and the external coexisting bulk aqueous phase, as supported by two observations. First, because all mixtures studied here contained excess aqueous phase, this effect could not be attributed to swelling of the mesophase to accommodate the increased amounts of the aqueous phase. Using φaq = 0.35 as a crude estimate for the hydration boundary (see Section S4.1 in the Supporting Material), the volume of excess aqueous phase varied from ∼0 in mixtures formulated with waq = 40 wt% to approximately three times that of the mesophase in mixtures with waq = 80 wt%. Second, variations of the mesophase lattice parameter above the hydration boundary do not occur in binary MO/water systems, in agreement with the phase rule (19).
The increasing values of lattice parameters indicate that csalt for the internal aqueous phase was lower than the nominal value of csalt in the solution used for sample preparation. Depending on the amount of excess aqueous phase, the change in the composition of the mesophase could be quite significant. For example, the lattice parameter of the mesophase prepared with 80 wt% (3-fold excess) of 1.3M KH2PO4 solution corresponds to ∼0.8 M on the 40 wt% trendline (Fig. 1 A). The latter trendline provides the closest estimate for the true value of csalt in the internal aqueous phase because those samples are closest to the onset of the bulk aqueous phase separation.
To the best of our knowledge, this is the first report of salt depletion from the internal aqueous phase in monoolein mesophases coexisting with a bulk salt solution. However, depletion of salt in the water layer within 10 Å of uncharged surfaces was previously observed in other systems, such as multilamellar phospholipid vesicles (35) and hydroxypropylcellulose films (36,37). Based on Eq. S8, for lattice parameters of 75–96 Å measured here for fully hydrated MO/salt solution Pn3m mesophases (Fig. 1), the radii of aqueous channels are in the range of 13–21 Å. However, a multitude of interactions have been implicated in the depletion phenomena in various systems (35–40), and further work is needed to establish the physical mechanism behind salt exclusion from the aqueous channels of MO mesophases.
Because the salt concentration in the mesophase channels is lower than the nominal value of csalt, in the coexisting bulk aqueous phase the actual salt concentration must be higher than the nominal value of csalt. The difference in the salt concentration between the two directly connected aqueous environments necessarily generates osmotic stress (35–38). This osmotic stress may be offset by several favorable free-energy contributions, such as the curvature elastic free energy of lipid bilayers (41), lipid tail compression stress (42–45), and steric repulsion between lipid headgroups (46).
The mesophase microstructure in MO/salt solution mixtures had two notable features: 1), very small lattice parameters of Pn3m mesophases (79–96 Å) that were below those accessible in the MO/water systems before the Pn3m-Ia3d transition at ∼102 Å; and 2), a shift of the hydration boundary to lower values of φaq (26–39 vol%) compared with MO/water systems (43 vol%). This shift could be related to the interfacial tension (IFT) within the mesophase, i.e., between the bilayers and the internal aqueous phase. IFT is commonly invoked in the energetics of self-assembly of amphiphiles (46–48) and may provide a complementary contribution to the energies of bilayer bending and chain packing typically considered in phase transitions in lipidic mesophases (42–45,49,50). However, ion-specific binding effects may also be important (35,40).
The IFT at the hydrocarbon/aqueous solution interface likely increases in the presence of phosphate salts, based on their position in the Hofmeister series (51) and data for neighboring ions in the series (52). Higher IFT favors a smaller area per MO headgroup a compared with MO/water systems to reduce the free-energy penalty of interface formation, producing mesophases with smaller lattice parameters, more curved bilayers, and lower accessible values of φaq (Fig. S3). The latter signifies the shift of the hydration boundary to lower hydration levels and the decrease of the radii of aqueous channels within the mesophase. Increasing the phosphate salt concentration is likely to further decrease the preferred headgroup area and to shift the hydration boundary to lower φaq values. The occurrence of Pn3m phases with very low values of lattice parameters instead of the Pn3m-Ia3d phase transition in salt solutions may be related to the consistently smaller headgroup area in Pn3m phases compared with Ia3d phases (Fig. S4).
Available data for other systems lend support to our hypothesis about the effect of the bilayer/channel IFT on the lattice parameter of MO mesophases at full hydration for electrolytes that do not partition into the lipid bilayer. In MO mesophases prepared with solutions of IFT-decreasing sodium iodide (51), lattice parameters increased as the salt concentration increased (30). IFT-increasing sodium chloride (51), on the other hand, caused a decrease in lattice parameters (28).
Overall, our data for MO/salt solution systems demonstrate the complexity of the effects that relatively simple additives can have on the phase behavior and microstructure of mesophases compared with purely osmotically driven MO/water phase transformations (41) that match simple dehydration behavior.
βOG/MO/salt solution systems
Here, we analyzed series of samples with constant βOG/MO ratios. At a given RβOG/MO, the content of the salt solution waq in the samples varied from 10 wt% to 80 wt%, covering compositions below and above the hydration boundary. The compositions reflected those of mixtures typical in crystallization trials for the membrane protein bacteriorhodopsin, where a protein solution containing up to 15% of βOG is mixed with monoolein in a 60:40 v/v ratio (21), and crystallization is induced by adding a concentrated salt solution. Thus, the βOG/MO ratio remains fixed throughout the trial and is independent of the amount of the aqueous phase and its salt concentration. We used samples with three βOG/MO ratios: 0.033, 0.066, and 0.099 w/w, corresponding to the βOG concentrations of 5%, 10%, and 15%, respectively, in the 60:40 MO/detergent solution mixture. The concentration of salt in solutions used here, 0.7–1.3 M KH2PO4 and 1.3–2.0 M NaH2PO4, were also within the range used for crystallization of bacteriorhodopsin (14,21). The range of salt concentrations for KH2PO4 was limited by its solubility in water (∼1.3 M at ambient temperature).
Competing effects of detergents and phosphate salts on the microstructure of lipidic mesophases can qualitatively explain our findings on the locations of phase boundaries and the values of lattice parameters in quaternary mesophases. As discussed above, phosphate salts extend the range of the Pn3m phase formation to lower hydration levels compared with MO/water mesophases, and favor mesophases with higher bilayer curvature, smaller lipid headgroup area, and smaller radii of aqueous channels. Detergent additives have the opposite effect (21–27), favoring microstructures with less curved bilayers: cubic phases form with larger lattice parameters, and the range of the Lα phase existence is extended to higher hydration levels. These trends have been rationalized based on the molecular shapes of the detergents and MO that form mixed bilayers within the mesophase (8,21,25,46). The changes in mesophase microstructure observed upon the addition of detergents are consistent with a much bulkier headgroup of βOG compared with MO, and a resultant increase in the average area per amphiphile headgroup a in the bilayers (see the Supporting Material).
Trends in the phase behavior
Fig. 2 shows the phase behavior of mesophases as a function of βOG and salt solution content and sample temperature, as well as approximate locations of hydration boundaries established based on the appearance of the samples. Remarkably, despite the complexity of the quaternary mixtures, the sequence of phases in each series was highly regular, matching that observed for MO/water mesophases at similar temperatures (19,20). The lamellar Lα phase formed in the dry end of the phase diagram. As the amount of the aqueous phase in the samples increased, an Lα—Ia3d transition took place, followed by an Ia3d—Pn3m transition, and at full hydration all mesophases were exclusively of the Pn3m type. We note that because of the different detection limits at the different x-ray sources, small amounts of coexisting phases potentially could have been identified in single-phase Na-containing samples adjacent to phase boundaries if a synchrotron x-ray source was used. However, this would not affect our general conclusions.
Figure 2.
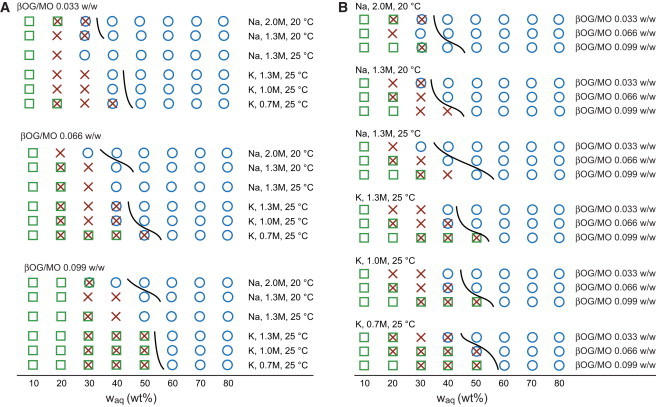
(A and B) The identity of mesophases containing MO, βOG, and phosphate salt solutions as a function of the weight fraction of salt solution waq at (A) three different βOG/MO ratios and (B) different salt concentrations. K and Na denote KH2PO4 and NaH2PO4, respectively. Mesophases are denoted as Pn3m (circles), Ia3d (crosses), and Lα (squares). Superimposed symbols at a given composition indicate coexisting phases. The solid curves indicate approximate locations of hydration boundaries based on the appearance of samples and are drawn to guide the eye. To see this figure in color, go online.
The regularity in the sequence of phases likely originated from the counteracting effects of βOG and phosphate salts on the curvature of the lipid bilayers, as discussed above, as well as from the relatively low detergent loading and salt concentrations in solutions. Previously reported phase behavior of MO with additives did not necessarily track that of MO/water mesophases. Depending on the trajectory in the compositional phase space, both regular sequences of mesophases similar to those in MO/water systems (21–23) and combinations of phase types not found in binary MO/water mesophases have been observed (21,24,27,53).
Coexisting Pn3m and Lα phases discovered in crystallization systems in the vicinity of protein crystals (15) were not found anywhere in the phase space tested here. Coexisting Pn3m, Ia3d, and Lα mesophases were observed in a single sample in this work, but the lattice parameter of the lamellar phase was 44 Å, significantly lower than 50–55 Å for the lamellar mesophase surrounding protein crystals (15). At the same time, the lattice parameters of Pn3m phases found here agreed with values of 85–97 Å observed in crystallization mixtures with protein crystals (14,15). Our findings provide additional evidence that the combination of coexisting Pn3m and Lα phases is brought about by the protein crystals, presumably due to elastic constraints on the bilayers in proximity to membrane protein molecules packed in sheets within the crystal.
The range of mixture compositions in which specific types of mesophases appear varied as expected based on the known effects of detergents and phosphate salts. Specific trends are discussed below.
Dependence of phase behavior on salt concentration at constant βOG/MO ratio
As the salt concentration increased, the boundaries of all phases (Lα, Ia3d, and Pn3m) shifted toward lower content of the salt solution waq in the mixture (Fig. 2 A), in agreement with the anticipated effect of phosphate salts that extend the range of cubic phase formation. For example, in the mixtures with the RβOG/MO of 0.066 w/w, the Ia3d phase was observed at waq of up to 50% at a salt concentration of 0.7M KH2PO4, but only at up to 40% at 1.0 and 1.3M KH2PO4. At the same time, the interval for lamellar phase existence decreased from waq of 10–40% at 0.7 M KH2PO4 to waq of 10–20% with 1.0 and 1.3 M KH2PO4.
Systems with other βOG/MO ratios prepared with solutions of KH2PO4 followed similar trends, as did mixtures with NaH2PO4 solutions of 1.3 M and 2.0 M concentrations at 20°C. An exception among the samples with NaH2PO4 was the series with the RβOG/MO ratio of 0.033, the lowest one studied here. At waq of 20 wt%, the trend for this series was seemingly reversed: a lamellar phase was observed in the sample with 2.0M NaH2PO4, but not with 1.3M NaH2PO4. The series with 2 M NaH2PO4 also deviated with respect to trends for the βOG/MO ratio at a given salt solution concentration, as described in the following section. A noticeably lower volume fraction of solution in mixtures with the higher salt concentration, as well as a significantly lower water/salt ratio (because the 2 M NaH2PO4 solution itself contained 25 wt% of salt), could account for this behavior.
Dependence of phase behavior on βOG/MO ratio at constant salt concentration
At the same salt concentration, the boundaries for all phases shifted in the direction of higher salt solution content in the mixture with increasing βOG/MO ratio (Fig. 2 B), as expected based on the molecular shape of βOG and its effect on the mesophase microstructure in ternary MO/βOG/water systems. The series with the βOG/MO ratio of 0.033 and the NaH2PO4 concentration of 2 M appeared to be an outlier again, as the Lα phase and the Ia3d phase persisted to higher waq at the βOG/MO ratio of 0.033 than at 0.066.
Comparison with MO/water mesophases
Interestingly, the trends in phase behavior observed upon increased RβOG/MO or decreased csalt were very similar to those seen in MO/water mesophases at decreasing temperatures (19,20), although the locations of the phase boundaries did not match exactly in the two classes of systems. The major changes, based on data for systems with KH2PO4, were as follows: 1), a shift of the hydration boundary to higher hydration levels, as discussed above; 2), widening of the Lα + Ia3d coexistence region at the expense of 3), narrowing of the pure Ia3d phase region of the phase diagram; and 4), larger values of lattice parameters (Fig. 3). The latter indicates a preference for cubic mesophases with higher hydration levels in both the binary and quaternary systems, and could account for observations 1–3. The pure Pn3m phase region near the hydration boundary in quaternary systems appeared to remain narrow (Fig. 2), similar to the behavior observed in the binary MO/water system. The Pn3m + Ia3d coexistence was only observed in a few samples, and related trends were difficult to infer unambiguously.
Figure 3.

Properties of mesophases prepared with MO, βOG, and solutions of KH2PO4 as a function of weight fraction of salt solution waq at 25°C. (A1–A3) Each chart shows a set of samples formulated with a salt solution of a given concentration csalt at three different βOG/MO ratios. (B1–B3) Each chart shows a set of samples with a constant βOG/MO ratio at three different salt solution concentrations csalt. Mesophases are denoted as Pn3m (circles), Ia3d (crosses), and Lα (squares). For Pn3m mesophases, error bars corresponding to 1 SD are shown. Where not visible, the error bars are smaller than the size of the data points. Error bars for Ia3d and Lα mesophases were consistently smaller than the size of the data points. To see this figure in color, go online.
Effect of temperature on the phase behavior (samples containing 1.3 M NaH2PO4)
Of the 24 samples, only two showed phase transitions upon heating (Fig. 2, A and B) from 20°C to 25°C. One sample (RβOG/MO = 0.033, waq = 30%) changed from a mixture of Pn3m and Ia3d phases to a pure Pn3m phase, consistent with the phase behavior of MO/water mixtures (19,20), whereas the other sample (RβOG/MO = 0.099 βOG/MO, waq = 30%) converted from the pure Ia3d phase to a mixture of coexisting Ia3d and Lα phases. Lattice parameters followed the same trend as observed in MO/water mixtures, decreasing with increasing temperature in all samples where a given phase type persisted (Fig. 4). The difference in lattice parameters at the two temperatures over the entire range of hydration levels became more pronounced as detergent loading increased. For fully hydrated Pn3m mesophases, the average changes in the lattice parameters between 20°C and 25°C were −3.2 Å, −3.8 Å, and −8.0 Å, respectively, at βOG/MO ratios of 0.033, 0.066, and 0.099.
Figure 4.

Effect of temperature of the properties of mesophases prepared with MO, βOG, and 1.3 M solution of NaH2PO4 at different weight fractions of salt solution waq and three different βOG/MO ratios (0.033, 0.066, and 0.099 w/w). Mesophases are denoted as Pn3m (circles), Ia3d (crosses), and Lα (squares). Error bars are explained in the caption to Figure 3.
Effects of different cations on the phase behavior
A comparison between the effects of the Na or K cation in quaternary systems can be made at 25°C and csalt of 1.3 M. Here, Na had a stronger cubic phase-promoting effect compared with K: in mixtures with the sodium salt, the Pn3m mesophase persisted to lower values of waq than it did in otherwise identical mixtures with the potassium salt (Fig. 5, A–C). The lattice parameters of mesophases prepared with NaH2PO4 were smaller than of those prepared with KH2PO4 under otherwise identical conditions (Fig. 5), with differences of 4.4 Å, 13.9 Å, and 13.6 Å at RβOG/MO of 0.033, 0.066, and 0.099, respectively, averaged for waq of 60–80%.
Figure 5.

Effect of the cation (Na or K) on the lattice parameters of mesophases prepared with MO, βOG, and salt solutions at different weight fractions of salt solution waq and three different βOG/MO ratios (0.033, 0.066, and 0.099 w/w) at 25°C. Solutions of 1.3 M KH2PO4 or 1.3 M NaH2PO4 were used as indicated in the legend. Mesophases are denoted as Pn3m (circles), Ia3d (crosses), and Lα (squares). Error bars are explained in the caption to Figure 3.
Studies on monoolein (30) and monoelaidin (54), focusing on the effect of anions, linked the decrease in the lattice parameters of fully hydrated Pn3m mesophases with the salting-out efficiency of a given anion in the Hofmeister series. Both of our observations for cations (i.e., the persistence of the Pn3m phase and values of lattice parameters) are at variance with these results, as K is more salting-out than Na in the original Hofmeister series (55). However, a similar trend can be inferred for another cation pair, Na2SO4 and (NH4)2SO4 (29,30), where NH4, which is more salting-out than Na, has a less pronounced effect on the lattice parameter.
A potential source of differences between the effects of cations and anions on the lattice parameter could be drastically different specific binding to MO bilayers (39), which increased for anions but decreased for cations in the order of increasing salting-out efficiency in the Hofmeister series (40). Specific binding has previously been implicated in the effect of salts on the behavior of multilamellar phospholipid vesicles (35). However, the types of interactions in various colloidal systems that underlie the ordering of ions in the Hofmeister series are not fully understood (37–40). Further work is required to unequivocally establish the effect of cations on the lattice parameter of MO mesophases in relation to the Hofmeister series and the underlying mechanisms. A data set for a several cations would be invaluable, since inversions of the salting-out ability for individual pairs of cations have been reported for other systems (56,57).
General trends in lattice parameters
Changes in the lattice parameters of mesophases over the entire range of compositions studied agreed with the anticipated effects of βOG and phosphate salts on the average packing of amphiphiles in lipid bilayers. An increase in the βOG/MO ratio caused the lattice parameters to increase (Figs. 3, A1–A3, and S6, A1–A2), and an increase in csalt (Figs. 3, B1–B3, and S6, B1–B3) caused the lattice parameters to decrease at a given value of waq. The effect of salts could be partially attributed to the smaller volume of solutions used because of the higher density at higher salt concentrations. However, lattice parameters showed noticeably different quantitative trends below and above full hydration, as discussed below.
Lattice parameters of mesophases below full hydration
The lattice parameters of mesophases below full hydration consistently increased with increasing waq in single-phase as well as in coexisting-phase regions. The latter indicated that the compositions of coexisting phases varied with the overall composition in the quaternary systems, presumably due to the redistribution of additives (detergents and phosphate salts) or changes in hydration levels of coexisting mesophases. Thus, the βOG/MO ratios and salt concentrations in the aqueous compartments of the coexisting phases must be different from the nominal ones used for sample preparation. Remarkably, the trends in the phase behavior as a function of hydration level waq in the quaternary systems (Fig. 2) remained identical to those in the binary MO/water system (19,20) and were not affected by these compositional variations the coexisting mesophases.
The salt solution content waq, rather than csalt or RβOG/MO, had the prevailing effect on the lattice parameters of Lα and Ia3d phases below full hydration (Figs. 3 and S6). Lattice parameters of lamellar phases dLα at a given salt solution content differed by less than 3.5 Å between all samples and followed a linear trend, dLα = 0.36waq + 35.6, regardless of the presence of the Ia3d phase and the range of the lamellar phase existence. Another interesting feature of the series in which the Ia3d phase formed over a wide range of compositions was the near-constant slope of the lattice parameter (∂dIa3d/∂waq) at a given βOG/MO ratio (Figs. 3 and S6). This slope was nearly independent of the salt concentration and the presence of coexisting phases of other types. The specific type of coexisting phase also did not appear to affect the trend for the lattice parameters of Ia3d phases, as highlighted by data for samples with RβOG/MO = 0.066, where values of dIa3d for pure Ia3d, Ia3d + Lα, and Ia3d + Pn3m samples fell on the same linear trend. These observations may indicate that lattice parameters below full hydration were largely defined by geometric constraints related to the relatively small volume of the aqueous subcompartments of the mesophase rather than optimal molecular geometries for the amphiphile. In this case, phase separation provides a route for redistribution of components and formation of bilayers with more favorable amphiphile packing.
Lattice parameters of mesophases above the hydration boundary
All mesophases that coexisted with the excess aqueous phase maintained Pn3m symmetry (Fig. 2). At a fixed waq, changes in salt concentration, βOG/MO ratio, and sample temperature had a significant effect on the values of lattice parameters of Pn3m phases, dPn3m (Figs. 3–5 and S6). For a given value of waq, the variation in dPn3m was large in comparison with the relatively small changes observed for Ia3d and Lα mesophases in partially hydrated samples. This was especially evident in data on the effect of detergent at a given salt concentration (Fig. 3, A1–A3, and S6, A1 and A2). In fully hydrated systems, the amount of aqueous solution within the mesophase and the lattice parameters of the mesophase are likely determined by optimal packing parameters that are strongly affected by detergent content and salt concentration.
The effects of the amount of excess aqueous phase at fixed values of RβOG/MO and csalt on lattice parameters of Pn3m mesophases could not be discerned unambiguously due to the large uncertainty in the values of lattice parameters for several samples (Fig. 3). The maxima that appear in data sets for samples at low phosphate salt concentrations (0.7 and 1.0 M of KH2PO4) at waq of 60–70% may be artifacts brought about by these uncertainties. If those maxima are real, they could be related to the redistribution of both salt and detergent between the mesophase and the coexisting bulk aqueous phase, and to the effect of salt concentration on the solubility of detergent in the bulk aqueous phase.
Effect of additives on the hydration boundary and lattice parameters at full hydration
All mesophases in coexistence with excess aqueous phase were of the Pn3m type (Fig. 2), suggesting that this was also the mesophase type adopted at the onset of aqueous phase separation, analogous to MO/water mesophases in a similar temperature range. The hydration boundaries shifted in the direction of higher aqueous solution content as the βOG/MO ratio increased or the concentration of salt decreased (Fig. 2, A and B). The location of the hydration boundary appeared to be more sensitive to the βOG/MO ratio than to the concentration of salt in solution, as evidenced by more frequent observations of hydration boundary shifts in data sets with constant csalt and varying RβOG/MO (Fig. 2 B) than in data sets with constant RβOG/MO ratio and varying csalt (Fig. 2 A).
As discussed above, the hydration boundary shifts to lower values of φaq (or waq) to satisfy geometric/compositional relationships as the lattice parameters decrease. Conversely, this boundary is also expected to shift to higher values as the lattice parameters increase. Based on the dependence of the lattice parameters of Pn3m mesophases on βOG loading and KH2PO4 concentration (Table 1), the latter would have to increase by more than 0.6 M to offset the effect of increasing the βOG/MO ratio by 0.033 (the increment used in this work). The required change in salt concentration is slightly larger than the range of KH2PO4 concentrations used here. This requirement, coupled with the uncertainty in the determination of the hydration boundary, may explain our observations regarding the stronger effect of βOG compared with the effect of salt.
Table 1.
Linear regression coefficients for the dependence of βOG and phosphate salts on the lattice parameters of ternary and quaternary Pn3m mesophases at the hydration boundary
| Additives | kβOG/Åa | ksalt/Åb |
|---|---|---|
| βOGc | 5.3 | – |
| 2M Na/K phosphate and βOGc | 1.7 | – |
| KH2PO4 or NaH2PO4d,e | – | −1.2 |
| KH2PO4 and βOGd | 6.5 | −3.3 |
| NaH2PO4 and βOGd,f | 3.4 | −2.0 |
| NaH2PO4 and βOGd,g | 5.2 | −2.4 |
Change in the lattice parameter of the Pn3m phase per RβOG/MO increase of 0.01.
Change in the lattice parameter of the Pn3m phase per csalt increase of 0.1 M.
Data from Misquitta and Caffrey (21).
This work.
Vargas et al. (29) reported a value of −1.4.
For RβOG/MO of 0.033–0.066.
For RβOG/MO of 0.066–0.099.
We analyzed our data in the spirit of previously published linear correlations between lattice parameters of mesophases and concentrations of additives (21,29). Our results demonstrated that data for ternary systems cannot be reliably used to predict results for more complex systems based on simple linear correlations, as discussed below. These findings are not surprising given the complex dependence of the lattice parameter on the geometrical parameters of the amphiphiles constituting the mesophase (Eq. S7), all of which depend on the detergent loading and the salt concentration.
Table 1 summarizes linear regression coefficients, kβOG and ksalt, for the dependence of lattice parameters on the concentrations of additives obtained in this work (see the Supporting Material) and previous studies (21,29).
Our data for the effect of salt in ternary MO/water/phosphate salt systems are in near-quantitative agreement with those reported previously (29). In quaternary systems, on the other hand, salts had a dramatically larger apparent effect on the lattice parameter of the mesophase, as demonstrated by the values of respective regression coefficients in Table 1. The apparent quantitative effects of βOG on the lattice parameter were similar in the ternary MO/βOG/water system, in all MO/βOG/KH2PO4/water mixtures, and in MO/βOG/NaH2PO4/water mixtures with RβOG/MO of 0.066–0.099. This agreement, however, may be fortuitous. Misquitta and Caffrey (21) reported a much smaller quantitative effect of βOG on the lattice parameter in mixtures with 2 M Na/K phosphate (Table 1). The value of the βOG regression coefficient in MO/βOG/NaH2PO4/water mixtures with RβOG/MO of 0.033–0.066 was intermediate between the two.
Implications of observed phase behavior
For membrane protein crystallization
The outcome of a crystallization trial must be determined by the exact conditions experienced by the protein molecules within the mesophase. The lattice types and lattice parameters of the mesophase are easily established, and diffractograms may provide information about other parameters important for crystallogenesis (58,59), such as the size of aqueous channels and lipid bilayer thickness (60,61). However, based on our data, an assessment of the exact composition of the mesophase in crystallization systems and its effect on crystallogenesis is significantly more difficult. For example, the viscosity and elasticity of bilayers, and electrostatic screening between the hydrophilic domains of the protein may depend on the βOG/MO ratio in bilayers and the salt concentration within the channels. A better understanding of the effect of those variables could provide routes for optimizing crystallization protocols and improving the success rate of crystallization from lipidic mesophases.
For the development and assessment of compatibility of detergents and crystallization screens with in meso crystallization
Because bicontinuous mesophases are required for membrane protein crystallogenesis in lipidic mesophases, the compatibility of various crystallization screens and detergents with the formation of bicontinuous mesophases has been investigated in a number of reports (16,62,63). However, only a single data set for MO combined with detergents and precipitants at crystallization-relevant concentrations is available (21). The majority of studies focused on either MO mixed with detergent solutions in a 60:40 v/v ratio, as in the original protocol for crystallization from lipidic mesophases (5–9), or for MO mixed with an excess (usually unspecified) of a multicomponent precipitant solution. These data (e.g., those obtained for a series of glucoside and maltoside detergents (21,23,26)) have been invaluable for identifying general trends with respect to the effect of certain components on the microstructure of MO mesophases and the relative magnitude of this effect.
Our results, however, highlight the difficulty of inferring the microstructure of the mesophase present in a crystallization trial from the effects of individual additives on the phase behavior of MO under a limited range of conditions. In agreement with another report (21), our samples with βOG/MO ratios of 0.033, 0.066, and 0.099 produced Ia3d, Ia3d + Lα, and Lα phases, respectively, when mixed with water to match the 60:40 MO/detergent solution ratio, yet all formed Pn3m cubic phases when mixed with an excess of a phosphate salt solution in a wide range of concentrations csalt. Information on detergent-containing mesophases at full hydration in the absence of a precipitant may provide a relevant starting point for assessing the phase behavior in crystallization systems. However, data for MO/detergent/water mesophases with the hydration varied independently of detergent loading are scarce (21–24,27) and typically cover only a limited section of phase space. Detailed work on the ternary MO/βOG/system is the only exception thus far (21,22,24,27). Our results also show that the quantitative effects of individual components on the lattice parameter of quaternary MO mesophases at and above full hydration cannot be easily deduced from data on ternary systems. Hence, for fine-tuning of lattice parameters in crystallization systems, an analysis of the complete system, including MO, detergents, and precipitants, under conditions that would be expected during a crystallization trial will be necessary until reliable modeling approaches or correlations become available.
Despite the apparent complexity of the ternary and quaternary systems studied here, the interpretation of trends was relatively straightforward due to the easily discernible compartmentalization of additives. One additive (salt) remained in the aqueous environment both within and outside of the mesophase, whereas the second additive (detergent) was incorporated into the bilayers. If phase type and plausible trends in the variation of the lattice parameters are the main interest for such systems, partial data on the effects of individual components may suffice, especially for fully hydrated mesophases. Commercially available crystallization screens, however, contain components that may partition between both the aqueous compartments and the bilayers of the mesophase, significantly complicating interpretations of phase behavior. The phase types and the lattice parameters of lipidic mesophases in these systems may be expected to depend strongly on the amount of excess precipitant in the mixture, further necessitating experimental studies of the phase behavior to assess the compatibility of crystallization screens.
Conclusions
We investigated the phase behavior of MO mesophases mixed with the detergent βOG and sodium or potassium phosphate salts that are frequently used for crystallization of membrane proteins from lipidic mesophases The compositions of mixtures were selected to closely resemble conditions for membrane protein crystallization in lipidic mesophases in meso: βOG/MO and salt/water ratios were kept constant, and the hydration level (the weight fraction of the salt solution in the mixture) in the mixture was varied. We also studied MO mixtures with salt solutions without detergent under conditions of excess aqueous phase.
The quaternary MO/βOG/water/phosphate salt mesophases studied here exhibited a remarkably regular behavior, with a sequence of phases matching that for MO/water mesophases as a function of aqueous solution content. The location of phase boundaries and the values for lattice parameters both above and below the hydration boundary shifted in agreement with previously established effects for detergents and phosphate salts on the microstructure of MO mesophases. The apparent quantitative dependences of lattice parameters of fully hydrated mesophases on the concentration of additives in the quaternary systems differed from estimates based on data for ternary MO/water/additive systems. Hence, it is difficult, if not impossible, to make a priori quantitative predictions of lattice parameters in crystallization mixtures based on simple correlations. Additionally, we found evidence for a redistribution of additives between the mesophase and the aqueous solution, potentially causing significant changes in the compositional makeup of the mesophase, such as the βOG/MO ratio and the salt concentration in the aqueous channels within the mesophase.
In summary, our findings strongly suggest that the compatibility of precipitants with the formation of the cubic phase necessary for protein crystallogenesis in lipidic mesophases must be probed under conditions that are directly relevant to crystallization trials, i.e., with detergent present in the mixture and with a large amount of precipitant. The exact amount of precipitant in the mixture may be of particular importance for precipitants containing small molecules that may partition between both the aqueous and lipidic environments. The multitude of detergents and precipitants available, as well as the lack of fine control over the detergent concentrations in protein solutions used for crystallization, make the parameter space enormous. Recent developments (62,63) in high-throughput SAXS analysis of lipidic mesophases may greatly facilitate such studies.
Acknowledgments
We thank Dr. Elena Kondrashkina, Dr. Keith Brister, and Mr. Jay Von Osinski for the development of the SAXS setup at the APS and assistance in data collection. The assistance of Dr. Danielle Gray and Dr. Amy Fuller was invaluable throughout SAXS data collection and analysis at the X-Ray Diffraction Laboratory, University of Illinois at Urbana-Champaign. Dr. Sudipto Guha and Dr. Ashtamurthy Pawate provided help in SAXS data collection at the APS. We thank Prof. Alexey Victorov for insightful comments on the manuscript.
This work was funded by the NIH (R01 GM086727). Use of the Advanced Photon Source was supported by the U.S. Department of Energy, Office of Science, Office of Basic Energy Sciences, under contract No. DE-AC02-06CH11357. Use of the LS-CAT Sector 21 was supported by the Michigan Economic Development Corporation as well as the University of Illinois.
Supporting Material
References
- 1.Lynch M.L., Spicer P.T., editors. Bicontinuous Liquid Crystals. CRC Press; Boca Raton, FL: 2005. [Google Scholar]
- 2.Longley W., McIntosh T.J. A bicontinuous tetrahedral structure in a liquid-crystalline lipid. Nature. 1983;303:612–614. [Google Scholar]
- 3.Fontell K. Cubic phases in surfactant and surfactant-like lipid systems. Colloid Polym. Sci. 1990;268:264–285. [Google Scholar]
- 4.Yamashita J., Shiono M., Hato M. New lipid family that forms inverted cubic phases in equilibrium with excess water: molecular structure-aqueous phase structure relationship for lipids with 5,9,13,17-tetramethyloctadecyl and 5,9,13,17-tetramethyloctadecanoyl chains. J. Phys. Chem. B. 2008;112:12286–12296. doi: 10.1021/jp8029874. [DOI] [PubMed] [Google Scholar]
- 5.Cherezov V. Lipidic cubic phase technologies for membrane protein structural studies. Curr. Opin. Struct. Biol. 2011;21:559–566. doi: 10.1016/j.sbi.2011.06.007. [DOI] [PMC free article] [PubMed] [Google Scholar]
- 6.Caffrey M., Lyons J., Hart D.J. Monoacylglycerols: the workhorse lipids for crystallizing membrane proteins in mesophases. In: Larry D., editor. Current Topics in Membranes. Academic Press; New York: 2009. pp. 83–108. [Google Scholar]
- 7.Caffrey M., Cherezov V. Crystallizing membrane proteins using lipidic mesophases. Nat. Protoc. 2009;4:706–731. doi: 10.1038/nprot.2009.31. [DOI] [PMC free article] [PubMed] [Google Scholar]
- 8.Kulkarni C.V., Wachter W., Ahualli S. Monoolein: a magic lipid? Phys. Chem. Chem. Phys. 2011;13:3004–3021. doi: 10.1039/c0cp01539c. [DOI] [PubMed] [Google Scholar]
- 9.Kulkarni C.V. In cubo crystallization of membrane proteins. In: Ales I., editor. Advances in Planar Lipid Bilayers and Liposomes. Academic Press; New York: 2010. pp. 237–272. [Google Scholar]
- 10.Wallace E., Dranow D., Nollert P. Monoolein lipid phases as incorporation and enrichment materials for membrane protein crystallization. PLoS ONE. 2011;6:e24488. doi: 10.1371/journal.pone.0024488. [DOI] [PMC free article] [PubMed] [Google Scholar]
- 11.Kubicek J., Schlesinger R., Labahn J. Controlled in meso phase crystallization—a method for the structural investigation of membrane proteins. PLoS ONE. 2012;7:e35458. doi: 10.1371/journal.pone.0035458. [DOI] [PMC free article] [PubMed] [Google Scholar]
- 12.Nollert P., Qiu H., Landau E.M. Molecular mechanism for the crystallization of bacteriorhodopsin in lipidic cubic phases. FEBS Lett. 2001;504:179–186. doi: 10.1016/s0014-5793(01)02747-8. [DOI] [PubMed] [Google Scholar]
- 13.Grabe M., Neu J., Nollert P. Protein interactions and membrane geometry. Biophys. J. 2003;84:854–868. doi: 10.1016/S0006-3495(03)74904-2. [DOI] [PMC free article] [PubMed] [Google Scholar]
- 14.Efremov R., Shiryaeva G., Gordeliy V. SANS investigations of the lipidic cubic phase behaviour in course of bacteriorhodopsin crystallization. J. Cryst. Growth. 2005;275:e1453–e1459. [Google Scholar]
- 15.Cherezov V., Caffrey M. Membrane protein crystallization in lipidic mesophases. A mechanism study using X-ray microdiffraction. Faraday Discuss. 2007;136:195–212. doi: 10.1039/b618173b. discussion 213–229. [DOI] [PubMed] [Google Scholar]
- 16.Cherezov V., Fersi H., Caffrey M. Crystallization screens: compatibility with the lipidic cubic phase for in meso crystallization of membrane proteins. Biophys. J. 2001;81:225–242. doi: 10.1016/S0006-3495(01)75694-9. [DOI] [PMC free article] [PubMed] [Google Scholar]
- 17.Cherezov V., Clogston J., Caffrey M. Membrane protein crystallization in meso: lipid type-tailoring of the cubic phase. Biophys. J. 2002;83:3393–3407. doi: 10.1016/S0006-3495(02)75339-3. [DOI] [PMC free article] [PubMed] [Google Scholar]
- 18.Cherezov V., Clogston J., Caffrey M. Room to move: crystallizing membrane proteins in swollen lipidic mesophases. J. Mol. Biol. 2006;357:1605–1618. doi: 10.1016/j.jmb.2006.01.049. [DOI] [PubMed] [Google Scholar]
- 19.Briggs J., Chung H., Caffrey M. The temperature-composition phase diagram and mesophase structure characterization of the monoolein/water system. J. Phys. II. 1996;6:723–751. [Google Scholar]
- 20.Qiu H., Caffrey M. The phase diagram of the monoolein/water system: metastability and equilibrium aspects. Biomaterials. 2000;21:223–234. doi: 10.1016/s0142-9612(99)00126-x. [DOI] [PubMed] [Google Scholar]
- 21.Misquitta Y., Caffrey M. Detergents destabilize the cubic phase of monoolein: implications for membrane protein crystallization. Biophys. J. 2003;85:3084–3096. doi: 10.1016/S0006-3495(03)74727-4. [DOI] [PMC free article] [PubMed] [Google Scholar]
- 22.Sparr E., Wadsten P., Kocherbitov V., Engström S. The effect of bacteriorhodopsin, detergent and hydration on the cubic-to-lamellar phase transition in the monoolein–distearoyl phosphatidyl glycerol–water system. Biochim. Biophys. Acta. 2004;1665:156–166. doi: 10.1016/j.bbamem.2004.07.005. [DOI] [PubMed] [Google Scholar]
- 23.Ai X., Caffrey M. Membrane protein crystallization in lipidic mesophases: detergent effects. Biophys. J. 2000;79:394–405. doi: 10.1016/S0006-3495(00)76301-6. [DOI] [PMC free article] [PubMed] [Google Scholar]
- 24.Persson G., Edlund H., Lindblom G. The 1-monooleoyl-rac-glycerol/n-octyl-β-D-glucoside/water system. Phase diagram and phase structures determined by NMR and X-ray diffraction. Langmuir. 2003;19:5813–5822. [Google Scholar]
- 25.Angelov B., Ollivon M., Angelova A. X-ray diffraction study of the effect of the detergent octyl glucoside on the structure of lamellar and nonlamellar lipid/water phases of use for membrane protein reconstitution. Langmuir. 1999;15:8225–8234. [Google Scholar]
- 26.Sennoga C., Heron A., Hankamer B. Membrane-protein crystallization in cubo: temperature-dependent phase behaviour of monoolein-detergent mixtures. Acta Crystallogr. D Biol. Crystallogr. 2003;59:239–246. doi: 10.1107/s0907444902020772. [DOI] [PubMed] [Google Scholar]
- 27.Persson G., Edlund H., Lindblom G. Phase behaviour of the 1-monooleoyl-rac-glycerol /n-octyl-β-D-glucoside/water system. Prog. Colloid Polym. Sci. 2004;123:36–39. [Google Scholar]
- 28.Caffrey M. Kinetics and mechanism of transitions involving the lamellar, cubic, inverted hexagonal, and fluid isotropic phases of hydrated monoacylglycerides monitored by time-resolved X-ray diffraction. Biochemistry. 1987;26:6349–6363. doi: 10.1021/bi00394a008. [DOI] [PubMed] [Google Scholar]
- 29.Vargas R., Mateu L., Romero A. The effect of increasing concentrations of precipitating salts used to crystallize proteins on the structure of the lipidic Q224 cubic phase. Chem. Phys. Lipids. 2004;127:103–111. doi: 10.1016/j.chemphyslip.2003.09.006. [DOI] [PubMed] [Google Scholar]
- 30.Takahashi H., Matsuo A., Hatta I. Effects of chaotropic and kosmotropic solutes on the structure of lipid cubic phase: monoolein-water systems. Mol. Cryst. Liq. Cryst. 2000;347:231–238. [Google Scholar]
- 31.Huang T.C., Toraya H., Wu Y. X-ray powder diffraction analysis of silver behenate, a possible low-angle diffraction standard. J. Appl. Cryst. 1993;26:180–184. [Google Scholar]
- 32.Larsson K. Two cubic phases in monoolein-water system. Nature. 1983;304:664. [Google Scholar]
- 33.Kondrashkina E., Khvostichenko D.S., Brister K. Using macromolecular-crystallography beamline and microfluidic platform for small-angle diffraction studies of lipidic mesophases for membrane protein crystallization. J. Phys. Conf. Ser. 2013;425:012013. doi: 10.1088/1742-6596/425/1/012013. [DOI] [PMC free article] [PubMed] [Google Scholar]
- 34.Cherezov V., Riedl K.M., Caffrey M. Too hot to handle? Synchrotron X-ray damage of lipid membranes and mesophases. J. Synchrotron Radiat. 2002;9:333–341. doi: 10.1107/s0909049502014528. [DOI] [PubMed] [Google Scholar]
- 35.Petrache H.I., Kimchi I., Parsegian V.A. Measured depletion of ions at the biomembrane interface. J. Am. Chem. Soc. 2005;127:11546–11547. doi: 10.1021/ja052549+. [DOI] [PubMed] [Google Scholar]
- 36.Bonnet-Gonnet C., Leikin S., Parsegian V.A. Measurement of forces between hydroxypropylcellulose polymers: temperature favored assembly and salt exclusion. J. Phys. Chem. B. 2001;105:1877–1886. [Google Scholar]
- 37.Chik J., Mizrahi S., Rau D.C. Hydration forces underlie the exclusion of salts and of neutral polar solutes from hydroxypropylcellulose. J. Phys. Chem. B. 2005;109:9111–9118. doi: 10.1021/jp046999k. [DOI] [PubMed] [Google Scholar]
- 38.Petrache H.I., Zemb T., Parsegian V.A. Salt screening and specific ion adsorption determine neutral-lipid membrane interactions. Proc. Natl. Acad. Sci. USA. 2006;103:7982–7987. doi: 10.1073/pnas.0509967103. [DOI] [PMC free article] [PubMed] [Google Scholar]
- 39.Boström M., Parsons D.F., Monduzzi M. Possible origin of the inverse and direct Hofmeister series for lysozyme at low and high salt concentrations. Langmuir. 2011;27:9504–9511. doi: 10.1021/la202023r. [DOI] [PubMed] [Google Scholar]
- 40.Garcia-Celma J.J., Hatahet L., Fendler K. Specific anion and cation binding to lipid membranes investigated on a solid supported membrane. Langmuir. 2007;23:10074–10080. doi: 10.1021/la701188f. [DOI] [PubMed] [Google Scholar]
- 41.Chung H., Caffrey M. The curvature elastic-energy function of the lipid-water cubic mesophase. Nature. 1994;368:224–226. doi: 10.1038/368224a0. [DOI] [PubMed] [Google Scholar]
- 42.Shearman G.C., Ces O., Templer R.H. Towards an understanding of phase transitions between inverse bicontinuous cubic lyotropic liquid crystalline phases. Soft Matter. 2010;6:256–262. [Google Scholar]
- 43.Shearman G.C., Khoo B.J., Templer R.H. Calculations of and evidence for chain packing stress in inverse lyotropic bicontinuous cubic phases. Langmuir. 2007;23:7276–7285. doi: 10.1021/la700355a. [DOI] [PubMed] [Google Scholar]
- 44.Templer R.H., Seddon J.M., Erbes J. Modeling the phase behavior of the inverse hexagonal and inverse bicontinuous cubic phases in 2:1 fatty acid/phosphatidylcholine mixtures. J. Phys. Chem. B. 1998;102:7262–7271. [Google Scholar]
- 45.Shearman G.C., Ces O., Seddon J.M. Inverse lyotropic phases of lipids and membrane curvature. J. Phys. Condens. Matter. 2006;18:S1105–S1124. doi: 10.1088/0953-8984/18/28/S01. [DOI] [PubMed] [Google Scholar]
- 46.Israelachvili J.N., Mitchell D.J., Ninham B.W. Theory of self-assembly of hydrocarbon amphiphiles into micelles and bilayers. J. Chem. Soc., Faraday Trans. II. 1976;72:1525–1568. [Google Scholar]
- 47.Carale T.R., Pham Q.T., Blankschtein D. Salt effects on intramicellar interactions and micellization of nonionic surfactants in aqueous solutions. Langmuir. 1994;10:109–121. [Google Scholar]
- 48.Mukerjee P., Chan C.C. Effects of high salt concentrations on the micellization of octyl glucoside: salting-out of monomers and electrolyte effects on the micelle-water interfacial tension. Langmuir. 2002;18:5375–5381. [Google Scholar]
- 49.Turner D.C., Wang Z.-G., McElhaney R.N. Structural study of the inverted cubic phases of di-dodecyl alkyl-β-D-glucopyranosyl-rac-glycerol. J. Phys. II. 1992;2:2039–2063. [Google Scholar]
- 50.Siegel D.P. Fourth-order curvature energy model for the stability of bicontinuous inverted cubic phases in amphiphile-water systems. Langmuir. 2010;26:8673–8683. doi: 10.1021/la904838z. [DOI] [PubMed] [Google Scholar]
- 51.Aveyard R., Saleem S.M. Interfacial tensions at alkane-aqueous electrolyte interfaces. J. Chem. Soc., Faraday Trans. I. 1976;72:1609–1617. [Google Scholar]
- 52.Zhang Y., Cremer P.S. Chemistry of Hofmeister anions and osmolytes. Annu. Rev. Phys. Chem. 2010;61:63–83. doi: 10.1146/annurev.physchem.59.032607.093635. [DOI] [PubMed] [Google Scholar]
- 53.Khvostichenko D.S., Kondrashkina E., Kenis P.J.A. An X-ray transparent microfluidic platform for screening of the phase behavior of lipidic mesophases. Analyst (Lond.) 2013;138:5384–5395. doi: 10.1039/c3an01174g. [DOI] [PMC free article] [PubMed] [Google Scholar]
- 54.Takahashi H., Matsuo A., Hatta I. Effects of salt on the lamellar and bicontinuous cubic phases of fully hydrated monoacylglycerol (monoelaidin) Phys. Chem. Chem. Phys. 2002;4:2365–2370. [Google Scholar]
- 55.Kunz W., Henle J., Ninham B.W. ‘Zur Lehre von der Wirkung der Salze’ (about the science of the effect of salts): Franz Hofmeister’s historical papers. Curr. Opin. Colloid Interface Sci. 2004;9:19–37. [Google Scholar]
- 56.Deguchi K., Meguro K. The effects of inorganic salts and urea on the micellar structure of nonionic surfactant. J. Colloid Interface Sci. 1975;50:223–227. [Google Scholar]
- 57.Maclay W.N. Factors affecting the solubility of nonionic emulsifiers. J. Colloid Sci. 1956;11:272–285. [Google Scholar]
- 58.Cherezov V., Liu J., Stevens R.C. LCP-FRAP assay for pre-screening membrane proteins for in meso crystallization. Cryst. Growth Des. 2008;8:4307–4315. doi: 10.1021/cg800778j. [DOI] [PMC free article] [PubMed] [Google Scholar]
- 59.Xu F., Liu W., Cherezov V. Development of an automated high throughput LCP-FRAP assay to guide membrane protein crystallization in lipid mesophases. Cryst. Growth Des. 2011;11:1193–1201. doi: 10.1021/cg101385e. [DOI] [PMC free article] [PubMed] [Google Scholar]
- 60.Garstecki P., Hołyst R. Scattering patterns of self-assembled cubic phases. 1. The model. Langmuir. 2002;18:2519–2528. [Google Scholar]
- 61.Garstecki P., Hołyst R. Scattering patterns of self-assembled cubic phases. 2. Analysis of the experimental spectra. Langmuir. 2002;18:2529–2537. [Google Scholar]
- 62.Joseph J.S., Liu W., Cherezov V. Characterization of lipid matrices for membrane protein crystallization by high-throughput small angle X-ray scattering. Methods. 2011;55:342–349. doi: 10.1016/j.ymeth.2011.08.013. [DOI] [PMC free article] [PubMed] [Google Scholar]
- 63.Conn C.E., Darmanin C., Drummond C.J. High-throughput analysis of the structural evolution of the monoolein cubic phase in situ under crystallogenesis conditions. Soft Matter. 2012;8:2310–2321. [Google Scholar]
- 64.Hahn T., editor. International Tables for Crystallography. Springer; Dordrecht: 2006. [Google Scholar]
- 65.Le Bail A., Duroy H., Fourquet J.L. Ab-initio structure determination of LiSbWO6 by X-ray powder diffraction. Mater. Res. Bull. 1988;23:447–452. [Google Scholar]
- 66.Pawley G. Unit-cell refinement from powder diffraction scans. J. Appl. Cryst. 1981;14:357–361. [Google Scholar]
- 67.Sands D.E. W.A. Benjamin; New York: 1969. Introduction to Crystallography. [Google Scholar]
- 68.Hyde S.T. Microstructure of bicontinuous surfactant aggregates. J. Phys. Chem. 1989;93:1458–1464. [Google Scholar]
- 69.Angelov B., Angelova A., Campitelli A. Diamond-type lipid cubic phase with large water channels. J. Am. Chem. Soc. 2003;125:7188–7189. doi: 10.1021/ja034578v. [DOI] [PubMed] [Google Scholar]
Associated Data
This section collects any data citations, data availability statements, or supplementary materials included in this article.