

Abstract
Gene trees record the combination of gene-level events, such as duplication, transfer and loss (DTL), and species-level events, such as speciation and extinction. Gene tree–species tree reconciliation methods model these processes by drawing gene trees into the species tree using a series of gene and species-level events. The reconstruction of gene trees based on sequence alone almost always involves choosing between statistically equivalent or weakly distinguishable relationships that could be much better resolved based on a putative species tree. To exploit this potential for accurate reconstruction of gene trees, the space of reconciled gene trees must be explored according to a joint model of sequence evolution and gene tree–species tree reconciliation. Here we present amalgamated likelihood estimation (ALE), a probabilistic approach to exhaustively explore all reconciled gene trees that can be amalgamated as a combination of clades observed in a sample of gene trees. We implement the ALE approach in the context of a reconciliation model (Szöllősi et al. 2013), which allows for the DTL of genes. We use ALE to efficiently approximate the sum of the joint likelihood over amalgamations and to find the reconciled gene tree that maximizes the joint likelihood among all such trees. We demonstrate using simulations that gene trees reconstructed using the joint likelihood are substantially more accurate than those reconstructed using sequence alone. Using realistic gene tree topologies, branch lengths, and alignment sizes, we demonstrate that ALE produces more accurate gene trees even if the model of sequence evolution is greatly simplified. Finally, examining 1099 gene families from 36 cyanobacterial genomes we find that joint likelihood-based inference results in a striking reduction in apparent phylogenetic discord, with respectively. 24%, 59%, and 46% reductions in the mean numbers of duplications, transfers, and losses per gene family. The open source implementation of ALE is available from https://github.com/ssolo/ALE.git. [amalgamation; gene tree reconciliation; gene tree reconstruction; lateral gene transfer; phylogeny.]
Each homologous gene family has its own unique story, but all of these stories are related by a shared species history (Maddison 1997; Szöllősi and Daubin 2012). Consequently, knowledge of the pattern of speciations that lead to the species we observe today, that is, of the species tree, is valuable in gene tree inference. This is the case because sequence data alone often lack enough information to confidently support one gene tree topology over many competing alternatives (Nguyen et al. 2012; Wu et al. 2013).
The problem of how to obtain the species tree itself raises a circular problem: The reconstruction of the species tree requires identifying events of gene family evolution, such as duplications, transfers, and losses, and both the reconstruction of gene trees and the identification of such events requires a known species tree. A solution to this problem is the joint inference of gene and species trees, where gene trees reconstructed using a candidate species tree are used to infer the species tree itself (Boussau and Daubin 2010; Boussau et al. 2012). Given the plethora of sequence information available, a central element of such an approach is an efficient method capable of reconstructing gene trees given a putative species tree.
Here, we present such a method to reconstruct gene trees, which we call amalgamated likelihood estimation (ALE). The ALE approach allows the combination of the estimation of sequence likelihood by conditional clade probabilities based on a sample of gene trees (Höhna and Drummond 2012), with probabilistic reconciliation methods that assume the evolution of gene lineages to be independent (Akerborg et al. 2008; Tofigh 2009; Rasmussen and Kellis 2012; Szöllősi et al. 2012; Boussau et al. 2012; Szöllősi et al. 2013). We implement the ALE approach in the context of a reconciliation model that considers duplications, transfers, and losses (Szöllősi et al. 2013) by extending the dynamic programming scheme to iterate over the very large number of reconciled gene trees whose topologies can be amalgamated as a combination of clades observed in the gene tree sample (David and Alm 2011).
To validate our approach we simulate a large number of sequences using gene tree topologies, branch lengths, and alignment sizes based on homologous gene families from 36 cyanobacterial genomes. The choice of Cyanobacteria is motivated by (i) the availability of a well-resolved (Criscuolo and Gribaldo 2011) dated species phylogeny (Szöllősi et al. 2012) and (ii) the large evolutionary time spanned by the species tree, with the root dated at 3500–2700 Ma (Falcón et al. 2010). To perform simulations that are as realistic as possible we use two techniques: First, in a procedure reminiscent of parametric bootstrap methods we infer gene trees using ALE and use these to simulate sequences retaining both alignment sizes and branch length; second, to emulate the complexity of real data, we use a complex model of sequence evolution to simulate sequences, and a simple model to perform reconstructions.
The simulation results presented below demonstrate that ALE combined with the ODT reconciliation method (Szöllősi et al. 2013) is able to reconstruct significantly more accurate gene trees compared with reconstruction based on sequence evolution alone. As we show, ALE is more accurate than the sequence-only method even when the latter is run with the correct model of sequence evolution used in the simulations, whereas ALE relies on a simplified model. Examining reconciliations for the biological data set on which our simulations are based, we further show that inference using the joint likelihood greatly reduces the number of inferred duplication, transfer, and loss (DTL) events. As we discuss, going beyond the cyanobacterial example, this indicates that the majority of the apparent discord between gene trees may, in fact, result from uncertainty in reconstructions based on sequence alone.
MATERIALS AND METHODS
Gene Tree Reconciliation using Conditional Clade Probabilities
Recently, Höhna and Drummond (2012), and subsequently Larget (2013) demonstrated that conditional clade probabilities (CCPs) provide a highly accurate means of approximating posterior probabilities of tree topologies from samples recorded during Markov Chain Monte Carlo (MCMC) sampling. That is, the CCP method accurately approximates the posterior probability of a very large number of gene tree topologies from a converged MCMC run that sampled only a minute fraction of the total tree space. However, it is approximate because, aside of finite sample size, it ignores the fact that the phylogenies of nonoverlapping clades are not necessarily independent of one another.
The estimation of the posterior probability of a gene tree topology by CCP relies on a simple recursion during the course of which the tree is incrementally resolved. Consider a rooted bifurcating gene tree G. As illustrated in Figure. 1a, for a given clade γ the conditional probability qG(γ) of the subtree resolving γ in G is
| (1) |
where γ′,γ″ are daughter clades splitting γ, such that γ\γ′ = γ″, and p(γ′,γ″|γ) is the probability of observing the split γ′, γ″ conditional on γ being present. The conditional probability p(γ′,γ″|γ) can be estimated from an MCMC sample as the ratio of the frequency of observing the split implying both daughter clades f (γ′,γ″) and the frequency of observing the mother clade f (γ), if clade γ is present in the sample, and it is zero otherwise. It follows that qG(γ) = 1 for clades with a single leaf, which terminate the recursion. The value qG(Γ) for the ubiquitous clade Γ composed of all leaves of G yields the estimate of the posterior probability of G. The conditional clade probability is normalized, since summing over all splits γ′,γ″ of γ at each step of the recursion and Σ(γ′γ″|γ)p(γ′γ″|γ)= 1 imply ΣG qG(Γ) = 1. We refer to gene tree topologies that are composed of clades observed in an MCMC sample of trees as trees that can be amalgamated (David and Alm 2011). As defined here, the CCP estimate of the posterior probability is nonzero for trees that can be amalgamated, and zero otherwise.
Figure 1.
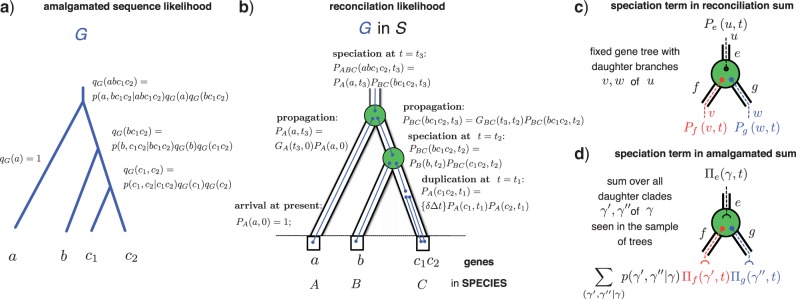
Estimating the joint likelihood using amalgamation. a) Based on a sample of gene trees, CCPs are used to estimate the posterior probability of a gene tree G that can be amalgamated from clades present in the sample (some terms are not shown). b) An evolutionary scenario reconciling G with the species tree S that involves a duplication and two speciations. The probability of a scenario, here the probability PABCD(abc1c2,t3) of seeing the root of G at the root of S calculated using reconciliation events that draw G into S (some terms not shown). In general, we do not know the evolutionary scenario and must sum over all possible ways to draw G into S to calculate the reconciliation likelihood (Szöllősi et al. 2013). c) The sum over reconciliations carried out recursively using a set of reconciliation events. We show one such event, a speciation, together with the corresponding term in the probability Pe (u,t) of seeing gene tree branch u in branch e of S at time t. d) To extend the recursion to sum over trees that can be amalgamated, we replace u by the corresponding clade γ and sum over all pairs of complementary subclades γ′, γ″ present in the gene tree sample.
As illustrated in Figure 1b–d, it is possible to extend probabilistic reconciliation methods that assume the evolution of gene lineages in the species tree to be independent to iterate over the reconciliations of all gene tree topologies that can be amalgamated. Such species tree–gene tree reconciliation methods describe the evolution of a gene family by recursively drawing the corresponding gene tree into the species tree using a series of reconciliation events (Fig. 1c). The reconciliation events used are composed of one or more atomic events, such as duplication, transfer, loss and speciation, and map branches of the gene tree to branches of the species tree.
In extending reconciliation methods to consider all possible gene trees that can be amalgamated, we are interested in reconciliation events that cause a bifurcation in G. Each of these events corresponds to a gene tree branch u being succeeded by its descendants v and w. We replace each such reconciliation event by a series of alternative such events, corresponding to alternative resolutions of the clade γ corresponding to u. That is, we replace each event that leads to u being succeeded by v and w by a series of events leading to the clade γ corresponding to u being succeeded by every split γ′,γ″ of γ that has been observed in the sample of gene trees used to construct the CCP estimate.
In Appendix 1, we develop the ALE approach in the context of the dynamic programming algorithm derived in Szöllősi et al. (2013). Our goal is to calculate the likelihood of alignment A given the species tree S and a model of gene family evolution ℳrec. as the sum over gene tree topologies of the product of the posterior probability P(A|G) of the alignment given G and the probability P(G|S,ℳrec.) of G given S and ℳrec.
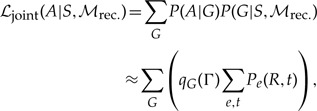 |
(2) |
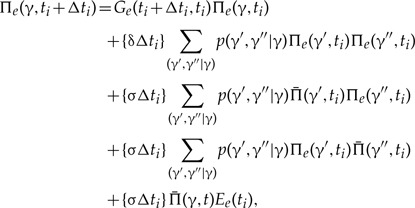
where Pe(u,t) is the probability of seeing branch u of G in branch e of S at time t, the sum over e and t corresponds to all species tree branch-time pairs in S, and R is the root of G. To calculate ℒjoint(A|S,ℳrec.), we use the procedure sketched above to extend the dynamic programming algorithm to simultaneously sum over all reconciled gene trees that can be amalgamated (cf. Appendix 1). As an example of how this is carried out, consider a speciation event in the species tree S that results in two gene lineages in a fixed gene tree G. The corresponding term in the probability of observing the gene tree branch u in branch e of the species tree at time t that the speciation occurs (cf. Fig. 1b and equation (6) in Szöllősi et al. (2013)) is
where the f and g are daughters of e in S, and v and w are descendants of u in G. To calculate the sum of the joint sequence-reconciliation likelihood over all reconciled gene trees that can be amalgamated, we replace gene tree branch u with the corresponding clade γ and sum over all observed splits γ′,γ″ of γ weighted by the appropriate conditional probabilities:
where Πe(γ,t) is the probability of observing clade γ in branch e of S at time t.
Performing the equivalent procedure for all reconciliation events, it follows by recursion that the sum of the joint sequence-reconciliation likelihood ℒjoint over all trees G is calculated as:
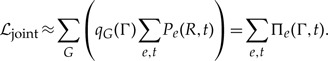 |
(3) |
Reconciled gene trees can be sampled by stochastic backtracking along the sum, while replacing addition by taking the maximum it is possible to find the most likely reconciled tree (Szöllősi et al. 2012). The calculation of the likelihood (equation (3)) takes 0.8 s on a single 2.6 GHz CPU, and ALEml requires 122 such calculations to converege, for the example data provided with the implementaion, which is representative of the data presented here.
Validation Based on “Real” Gene Trees
To validate our approach we simulated sequences using tree topologies, branch lengths, and alignment sizes based on 1099 gene families from 36 cyanobacterial genomes available in the HOGENOM database (Penel et al. 2009). As described in detail in Appendix 1 and illustrated in Figure 2a, to generate the set of simulated alignments we first reconstructed reconciled gene trees that maximize the joint likelihood and subsequently used the reconstructed gene trees to simulate amino acid sequences. To emulate the relative complexity of real data compared with available models of sequence evolution, we used a complex model of sequence evolution to simulate sequences—an LG model (Le and Gascuel 2008) with across-site rate variation and invariant sites, and attempted to reconstruct their history with a simple model—a Poisson model (Felsenstein 1981) with no rate variation.
Figure 2.
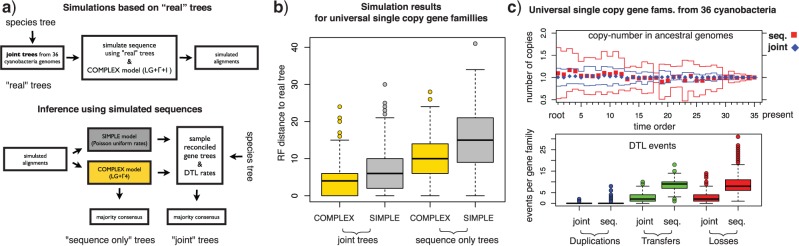
Validating joint likelihood-based inference. a) We (i) reconstructed reconciled gene trees that maximise the joint likelihood using homologous gene families from 36 cyanobacterial genomes together with the species tree show in Figure A.4; (ii) simulated sequences using the reconstructed “real” trees and a COMPLEX model of sequence evolution; (iii) sampled gene tree topologies using both a SIMPLE model and the COMPLEX model; (iv) attempted to reconstruct the “real” trees from the simulated sequences using only the sequence alone, and using the joint likelihood together with the species tree for samples from both the SIMPLE and the COMPLEX models. b) The Robinson-Foulds distance to the real trees demonstrates that trees reconstructed from simulated sequences using the joint likelihood are more accurate than those reconstructed based on the sequence alone regardless of the model of sequence evolution used. c) In the top panel, we compare the distribution of the number of genes in ancestral genomes based on reconciliations of gene trees reconstructed from 342 universal single-copy cyanobacterial gene families. The mean number of copies for joint (diamonds, blue online) and sequence trees (squares, red online) is plotted together with the standard deviation (dark and light gray lines, blue and red online). The time order of the speciations corresponds to Figure 3 of Szöllősi et al. (2012). In the lower panel, we compare the number of Duplication, Transfer, and Loss events needed to reconcile joint and sequence trees. For details of the inferences presented see Appendix 1.
Data.—To construct a simulated dataset, we first reconstructed gene trees for 1099 cyanobacterial gene families with 10 or more genes in any of the 36 cyanobacteria present in version 5 of the HOGENOM database (Penel et al. 2009). Families with more than 150 genes were not considered. For each family, amino acid sequences were extracted from the database and aligned using MUSCLE (v3.8.31) (Edgar 2004) with default parameters. The multiple alignment was subsequently cleaned using GBLOCKS (v0.91b) (Talavera and Castresana 2007) with the options:
Cleaned alignments are available from the Dryad data repository at http://datadryad.org, doi:10.5061/dryad.pv6df.
Reconstructing “real” trees.—For each cleaned alignment, an MCMC sample was obtained using PhyloBayes (v3.2e) (Lartillot et al. 2009) using an LG+Γ4+I substitution model (Le and Gascuel 2008) with a burn-in of 1000 samples followed by at least 3000 samples. Following this step, gene families were separated into two datasets: (i) dataset I, composed of 342 universal single-copy families with exactly one copy in each of the 36 cyanobacteria and, (ii) dataset II, which includes dataset I, and is composed of 1099 families, each with at least 10 genes in any of the 36 cyanobacterial genomes considered. For the 342 single-copy universal gene families of dataset I 10 000 trees were sampled.
For each family, we used the species tree shown in Figure A.4, sampled reconciled gene trees using ALEsample (sampling at least 5000 reconciled trees) to sample DTL rates and reconciled gene trees, and ALEml to find the ML DTL rates and the corresponding ML reconciled gene tree.
For each ALEsample sample, we computed the majority consensus tree and fully resolved “real” trees for each gene family were calculated based on the ALEsample sample of trees by finding the tree that maximized CCPs based on the sample. For both real and simulated alignments, sequence-only trees were also inferred using PhyML (version 20110526) (Guindon and Gascuel 2003) using the LG+Γ4+I model with the options:
“Real” gene trees are available from the Dryad data repository at http://datadryad.org, doi:10.5061/dryad.pv6df.
Sequence simulation.—To simulate amino acid sequences, we used bppseqgen (v1.1.0) (Dutheil and Boussau 2008) keeping the branch lengths and alignment sizes and using the COMPLEX model corresponding to an LG model with site rate variation described by a gamma distribution with α = 0.1 and 10% invariant sites.
Simulated alignments are available from the Dryad data repository at http://datadryad.org, doi:10.5061/dryad.pv6df.
Inference for simulated data.—For each simulated alignment, an MCMC sample was obtained using PhyloBayes (v3.2e) using a SIMPLE model corresponding to a Poisson model (Felsenstein 1981) with no rate variation.
We sampled 10 000 trees after a burn-in of 1000 samples with a sample taken every 10 iterations. For the simulated sequence corresponding to the 342 single-copy universal gene families of dataset I, we also sampled trees using the COMPLEX model corresponding to an LG+Γ4+I substitution model, sampling 3000 trees after a burn-in of 1000 samples.
For each family, we sampled reconciled gene trees using ALEsample (sampling at least 5000 reconciled trees) to sample DTL rates and reconciled gene trees, and ALEml to find the ML DTL rates and the corresponding ML reconciled gene tree.
Distances to the “real” tree for gene trees of dataset I (Fig. 2b) were computed as the distance between majority consensus trees calculated from the sequence-only PhyloBayes samples for both the SIMPLE and the COMPLEX model as well as the joint ALEsample samples for both. The same procedure was used for the simulated sequence corresponding to dataset II (Fig. A.1a) for the SIMPLE model. For the COMPLEX model, joint trees were not computed and PhyML trees were used for the sequence-only trees.
Inference of numbers of DTL events.—The number of DTL events for joint trees was inferred using ALEml using a sample of trees obtained using the SIMPLE model. The number of DTL events for sequence trees was inferred using ALEml using fixed PhyML trees (based on LG+Γ4+I substitution model).
ML reconciled trees are available from the Dryad data repository at http://datadryad.org, doi:10.5061/dryad.pv6df.
Statistical support.—Statistical support of bipartitions was calculated from samples of gene trees obtained either using PhyloBayes, for the sequence-only case, or using ALEsample in the joint case. The support of each observed bipartition was estimated as the fraction of all trees in which it was present.
RESULTS
Analysis of Gene Families from 36 Cyanobacteria
As described above, we performed simulations based on two datasets: (i) dataset I, composed of 342 universal single-copy families and (ii) dataset II composed of 1099 families, each with at least 10 genes. As shown in Figure 2b and Figure A.1a of Appendix 1, for both datasets gene tree reconstruction based on the joint likelihood substantially improves accuracy in comparison to inference based on sequence alone. In fact, we found that the joint reconstruction based on the simple model of sequence evolution yielded significantly more accurate gene trees than the sequence-only inference relying on the complex model used to simulate the alignments.
In our inference on biological data, we chose to consider separately the universal single-copy gene families of dataset I because—since these families have exactly one copy in all extant cyanobacteria—we can expect that they were also present in a single copy in ancestral genomes. Testing to what extent this assumption is satisfied allows us to assess the accuracy of gene trees reconstructed from real-life gene sequences, where we do not have knowledge of the correct tree. An equivalent assumption cannot be made for all families in dataset II, that is, families that are multi-copy families and/or have a more limited distribution in extant species. As show in Figure 2c, gene trees reconstructed using joint likelihood imply that the number of gene copies in ancestral genomes is very close to one with for example 328 families with one, only six families with zero gene copies and eight with more than one copy at the root. In contrast, for gene trees inferred based on sequence information only, 248 families have one, 34 families have zero gene copies and 60 have more than one copy at the root of Cyanobacteria.
Considered together with the simulation result, the reconciliations of universal single-copy families not only demonstrate that ALE is able to reconstruct accurate gene trees, but also suggests that gene trees inferred using the joint likelihood are significantly different from gene trees inferred based on sequence alone. The magnitude of this difference is reflected in the number of DTL events that are required to reconcile the two sets of gene trees with the species tree. In dataset I, the reduction in the number of events necessary to reconcile joint trees is 81.6% for duplications, 70.9% for transfers, and 70.2% for losses. In dataset II, the reduction in the number of required events is 24.3% for duplications, 59.1% for transfers, and 45.8% for losses. The validity of these results is supported by simulation results, where we find that the number of duplications and transfers per family for trees inferred using the joint likelihood is accurately recovered. As shown in Figure A.1b, the number of duplications and transfers needed to reconcile joint trees is statistically indistinguishable (p > 0.1 for both paired T and Wilcox sign-rank tests) from the corresponding number of events needed to reconcile “real” trees used to simulate the alignments. The number of losses per tree are slightly less accurately recovered with an increase of 12.1% in the number of events needed to reconcile joint trees.
Consistent with the above result, we find that the distance to the species tree is recovered accurately in our simulations. For simulations based on the 342 single-copy universal families, the Robinson-Foulds distance to the species tree for “real” gene trees has a mean of 11.41, whereas the corresponding fully resolved maximum likelihood (ML) reconciled gene trees reconstructed based on the SIMPLE sequence evolution model have a moderately increased distance to the species tree with a mean of 13.02. In comparison, the mean distance of sequence-only trees reconstructed using the COMPLEX and SIMPLE models are, respectively, 17.77 and 21.80 (cf. Fig. A.3).
A possible concern regarding the joint inference is that we may overfit the species tree. As shown in Figure A.3 in simulations, the distance of the reconstructed trees to both the real tree and the species tree exhibits a decreasing trend for increasing sample size, with no sign of overfitting for any sample size. However, based on Figure A.3 alone we cannot rule out that overfitting of the species tree would not occur for larger sample sizes. A possible test that does not involve a computationally expensive increase in sample size is to examine the correlation between reconstruction accuracy and alignment size. If overfitting is present, we expect it to be stronger for shorter alignments. Such a trend is not observed in our data, in fact, for the largest sample size considered alignment length is negatively correlated with reconstruction error, measured as either (i) the distance to the real trees (Pearson's r = −0.44 with p < 10−5); or (ii) the difference of the distance of the reconstructed tree and the real tree to the species tree (Pearson's r = −0.20 with p < 10−3). In other words, reconstructions based on shorter simulated alignments are less accurate and are on average more distant from the species tree than real trees. Such an explicit test is only possible for simulated alignments; however, we do observe that the distances to the species tree of real trees (reconstructed from cyanobacterial sequences) are not correlated with alignment length (Pearson's r = −0.0148 with p = 0.78).
Analysis of the Signal for the Phylogenetic Discord
Considering the above, the results of joint inference present strong evidence that the majority of apparent phylogenetic discord observed among gene trees based on sequence information alone results from reconstruction uncertainty. To examine the signal for the phylogenetic relationships responsible for the spurious discord, we computed the statistical support of bipartitions based on sequence alone as well as based on joint likelihood (for details see Appendix 1). As shown in Figure 3a most of the bipartitions present in consensus trees based on the joint likelihood are also supported according to the sequence, with 71% of bipartitions in joint trees having a statistical support > 0.95 according to sequence alone. A significant minority of the bipartitions in joint consensus trees are, however, not supported by the sequence, with 6.4% of bipartitions in joint trees having a statistical support > 0.95 according to the joint likelihood, but < 0.05 according to sequence alone. Examining the statistical support of partitions in simulations, we observe very similar results (cf. Fig. A.2a).
Figure 3.
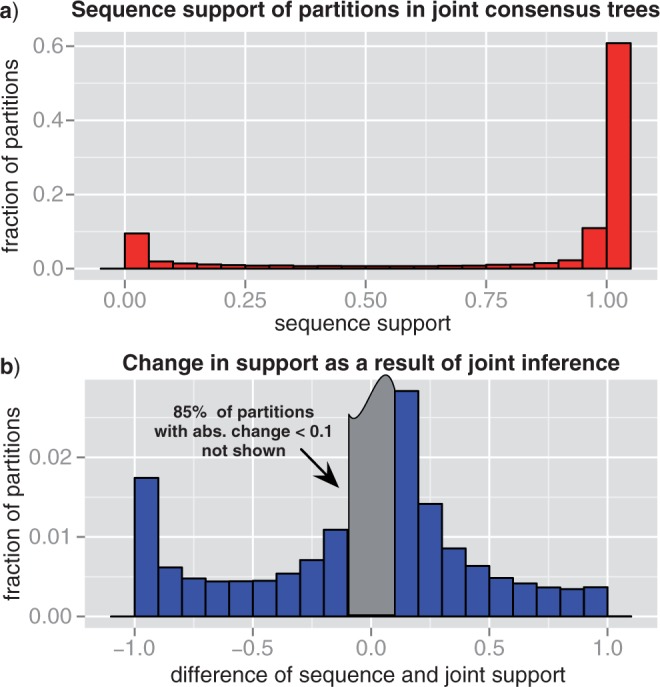
Statistical support for 1099 gene trees from 36 cyanobacteria. We calculated the statistical support of bipartitions as their frequency in MCMC samples based on both the joint likelihood and sequence alone. a) Shows the distribution of sequence-only support for bipartitions present in the joint majority consensus trees. b) Presents the distribution of the difference between sequence-only and joint support for all bipartitions.
To quantify how often the opposite case occurs, that is, how often are bipartitions strongly supported by sequence rejected based on the joint likelihood we computed the change in statistical likelihood as a result of joint inference. As shown in Figure 3b, the difference of the support according to sequence alone and the support according to the joint likelihood is small for most bipartitions, with 85.8% of bipartitions having an absolute difference < 0.1. Examining the remaining bipartitions, an excess of partitions with a difference < -0.95 is present (left corner of Fig. 3b), composed of 1.4% of all observed bipartitions. These are partitions that are not supported by sequence, but are strongly supported based on joint likelihood. There is, in contrast, no excess in the number of partitions with a difference > 0.95 (right corner of Fig. 3b), corresponding to partitions that are strongly supported by sequence, but are not supported based on joint likelihood, with only 0.18% of partitions having a difference > 0.95. Examining the statistical support of partitions in simulations, we observe very similar results (cf. Fig. A.2b).
DISCUSSION
We present a probabilistic method, which we call ALE, that is able to exhaustively explore the joint likelihood of a very large number of reconciled gene trees using a sample of trees comprising only a minute fraction of the total tree space. We implement ALE in the context of one of the most general gene tree – species tree reconciliation methods available that allows for the DTL genes (Szöllősi et al. 2013). The general computational scheme, however, is applicable to other models considering, for example, duplication and loss (Akerborg et al. 2009; Boussau et al. 2012), lineage sorting (Edwards et al. 2007; Liu and Pearl 2007), or both (Rasmussen and Kellis 2012).
To validate our implementation, we simulate sequences based on homologous gene families from 36 completely sequenced cyanobacterial genomes. Contrasting the simulated and the real data sets, we find that both the statistical support of simulated and real gene trees (cf. Fig. A.1c and f) and the topological distance between sequence and joint trees are comparable (the mean Robinson-Foulds distance between joint and sequence trees is 13.25 for simulations and 19.12 for real data).
Simulation results together with reconciliations for universal single-copy gene families from 36 cyanobacteria, both presented in Figure 2, establish that ALE reconstructs gene trees that are more accurate than those based on sequence alone. Examining the statistical support for gene trees for both the real and the simulated dataset, we can conclude that overall: (i) the majority of relationships inferred from sequence alone are also found in joint trees, with 88.5% of bipartitions (90.7% in simulations) shared among the two sets of consensus trees, but (ii) a significant minority of bipartitions in joint phylogenies have low sequence support, with 9 .5% (7.5% in simulations) having a sequence support < 0.05, and (iii) more rarely, relationships that are strongly supported by sequence are not found in joint consensus trees, with 1.9% of bipartitions (1.5% in simulations) with sequence support > 0.95 missing from joint trees, and finally (iv) joint trees are significantly better supported than sequence trees with 90.3% versus 80 .0% of bipartitions in consensus trees (92.4% versus 83 .6% in simulations) having a support > 0.95.
There are two intrinsic limitations to the accuracy of ALE-based inferences. First, ALE is approximate in that CCPs on which it relies reconstruct the posterior probability of gene trees from marginal frequencies of splits, assuming CCPs to be independent. However, although this independence assumption is in general false, Höhna and Drummond have demonstrated that in practice CCP estimates based on sufficiently large samples of trees usually give very accurate approximations of the posterior probabilities (Höhna and Drummond 2012). Furthermore, as we demonstrate in Appendix 1, ignoring dependencies between clades is not an arbitrary assumption, but the CCP-based estimate of the posterior probability in fact corresponds to the maximum entropy distribution (Jaynes and Bretthorst 2003) given marginal split frequencies observed from an MCMC sample. Second, and from a practical point of view more importantly, ALE-based inferences rely on a finite sample of tree topologies, between 3000 and 10 000 in the results presented here. The corresponding number of amalgamations considered can be very large, for example for the cyanobacterial gene families considered here up to 1040, with a geometric mean of ∼ 1012. Despite the large number of amalgamations, we find in simulations that only 98% of bipartitions comprising “real” gene trees are present in sampled trees. The correlation between reconstruction error (the distance of the reconstructed tree to the real tree) and the fraction of missing bipartitions is high and significant (Pearson's r = 0.71 with p < 10-5). This suggests that the accuracy of ALE-based reconstructions can be significantly further improved by increasing the size and/or diversity of the underlying MCMC samples (also cf. Fig. A.3).
From the perspective of gene tree–species tree reconciliation we find that, as shown in Figure 2c and Figure A.1e, joint inference results in a dramatic reduction in the number of events required to describe the evolution of gene trees along the species tree. This decrease is particularly remarkable for the number of transfer events (which make up 69% of the birth events) with only 3.6 transfers per family in joint trees, compared with 8.7 for sequence trees in dataset II. The reduction in the number of transfers is reflected in a striking drop in phylogenetic discord, corresponding to an over 2-fold reduction in the Robinson-Foulds distance of the species tree and gene trees for single-copy universal families (from 25.8 to 11.4, cf. Fig. A.1d).
Obtaining results similar to the above for bacterial or archaeal phyla other than the cyanobacteria is currently limited by the availability of well-supported dated species phylogenies. Joint inference of species and gene trees offers a path toward surmounting this obstacle (Boussau and Daubin 2010; Boussau et al. 2012; Szöllősi and Daubin 2012; Szöllősi et al. 2012). However, as there is no reason to believe that results for other groups will be qualitatively different, we believe that our results strongly suggest that the majority of apparent phylogenetic discord is the result of uncertainty in phylogenetic reconstructions not only for cyanobacteria, but other groups as well.
In summary, we find that the majority of phylogenetic discord results from uncertainty in sequence-based reconstruction that can be corrected using information aggregated across gene families by a putative species tree. Finally, as a corollary of the observation that gene trees reconstructed by combining a simplistic model of sequence evolution with a reconciliation method are more accurate than trees reconstructed using the correct sequence evolution model, we note that although developing increasingly sophisticated models of sequence evolution is of fundamental interest, the potential of probabilistic models of species tree–gene tree reconciliation remain nearly untapped.
ACKNOWLEDGMENTS
We thank Nicolas Lartillot for his suggestions about the MaxEnt derivation. We thank all members of the Bioinformatics and Evolutionary Genomics Group for discussions of the results and comments on the article.
APPENDIX 1
A Minimal Model of Speciation and Gene Birth and Death
In the presence of lateral gene transfer (LGT), gene trees record evolutionary paths along the complete species tree, including extinct and unsampled branches, and not only along the phylogeny of the species in which they reside today. This is the case because, although LGT events imply that the donor and receiver lineages existed at the same time, the donor lineage might have subsequently become extinct, or more generally, might not have been sampled. However, it is not feasible to specify, much less to reconstruct, the complete phylogeny of all species that ever existed. Hence, to describe the evolution of genes outside the represented phylogeny—along lineages that have become extinct or whose descendants have not been sampled—we must resort to modeling the speciation dynamics that gave rise to the complete phylogeny (Szöllősi et al. 2013).
As a minimal model of speciation, in Szöllősi et al. (2013) we assume that the number of species N is constant, and that the dynamics of speciation are modeled by a continuous time Moran process. That is, for each species at rate σ, a speciation occurs during which the species gives rise to two descendants and a randomly chosen species goes extinct. We further assume that, of the N species existing at present, we sample only a small fraction n ≪ N. These n species are the species represented in S.
To describe the evolution of genes within the genomes of species, we assume genes to evolve independently according to a birth-and-death process that consists of gene DTL. A gene in the genome of any of the N species can: (i) be duplicated at rate δ; (ii) be transferred from a donor species to any of the other N –1 possible host species at a rate τ/(N –1); or (iii) be lost at a rate λ. Gene copies can also be born and be lost as a result of the speciation dynamics: (iv) at the species level lineages experience speciation at a rate σ, in which case they are replaced by two copies in the two new species, or (v) suffer extinction at an identical rate σ. A branch e of the represented tree S in general corresponds to a series of speciation events; however, only the last one of these, the speciation event that gave rise to two represented lineages, is explicitly present for internal branches as the speciation node terminating an internal branch of S.
Amalgamated sum over reconciled trees.—As developed in Szöllősi et al. (2013), in order to derive the recursion expressing the probability of G as the sum over possible paths along the species tree S we discretize time along S using the series of speciation times ti along S, with t0 = 0 corresponding to the root of S and tn = 0 to the present. Speciations represented in S define the time intervals [0,t1),...,[ti,ti+1),...[tn – 1,tn – 1) referred to as time slices with indices 0,...,i,...n. We further divide each time slice into D equal time intervals of height Δti = (ti+1 – ti)/D.
First, we must describe the evolution of gene copies that appear as single-gene lineages when observed from the present. We have to calculate: (i) the extinction probability Ee(t) that a gene lineage seen at time t on branch e of S leaves no observed descendant that is, no descendant exists at time t = 0 in the genome of any of the n sampled species; (ii) the extinction probability Ē (t) that a gene seen at time t in an unrepresented species leaves no observed descendant; (iii) the single-gene propagation probabilities Ge(s,t) that all observed descendants of a gene seen at time s on branch e descend from a descendant seen at a later time t < s on branch e; and (iv)  (s,t) the probability that all observed descendants of a gene seen at time s in an unrepresented species descend from a descendant seen at time t < s in an unrepresented species. Differential equations that can be used to calculate the above functions are available in the Appendix of Szöllősi et al. (2013).
Using the extinction probabilities and single-gene propagators, we sum over all reconciled trees that can be amalgamated by recursively mapping the branches of G onto branches of S, as well as unrepresented species using the set of reconciliation events from Szöllősi et al. (2013).
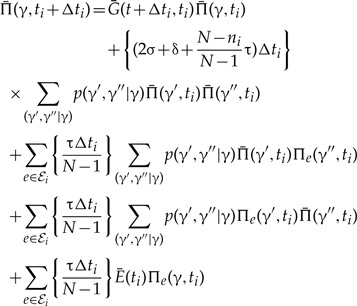
The probability of the lineage leading to the first bifurcation resolving clade γ being seen on branch e of S at time ti + Δti given the probabilities at time ti is
 |
(A.1) |
where  denotes the probability of the gene lineage leading to the first bifurcation resolving clade γ being seen in an unrepresented species at time t, and the sum goes over all splits γ′,γ″ of γ observed in the MCMC sample used to construct the CCP estimate. The terms correspond to (i) no event with an observed descendent; (ii) birth of two gene lineages by duplication, such that both leave observed descendants; (iii) and (iv) birth of two gene lineages with observed descendants as a result of an unrepresented speciation; and finally, (v) unrepresented speciation followed by the loss of the copy in branch e such that only the copy in the unrepresented phylogeny leaves an observed descendant, compare equation (4) and Figure A1 of Szöllősi et al. (2013).
Figure A.1.

Results of joint likelihood-based reconstruction for simulated and real data. a) The distribution of normalized Robinson-Foulds distance to the real tree used to simulate sequences, defined as the distance divided by its maximum possible value in each gene tree, for all simulated gene families. Joint inference-based on the COMPLEX model was only performed for single-copy universal families (cf. Fig. 2b). b) Comparison of the distribution of DTL events for all simulated gene families. Some points fall outside the range of the ordinate. c) The fraction of bipartitions in majority consensus trees with statistical support over a given threshold for all simulated gene families. d) Robinson-Foulds distance to the species tree for 342 single-copy universal gene families from 36 cyanobacterial genomes. e) DTL events for 1099 gene families from 36 cyanobacterial genomes. Some points fall outside the range of the ordinate. f) The fraction of bipartitions in majority consensus trees with statistical support over a given threshold for 1099 gene families from 36 cyanobacterial genomes.
Figure A.2.
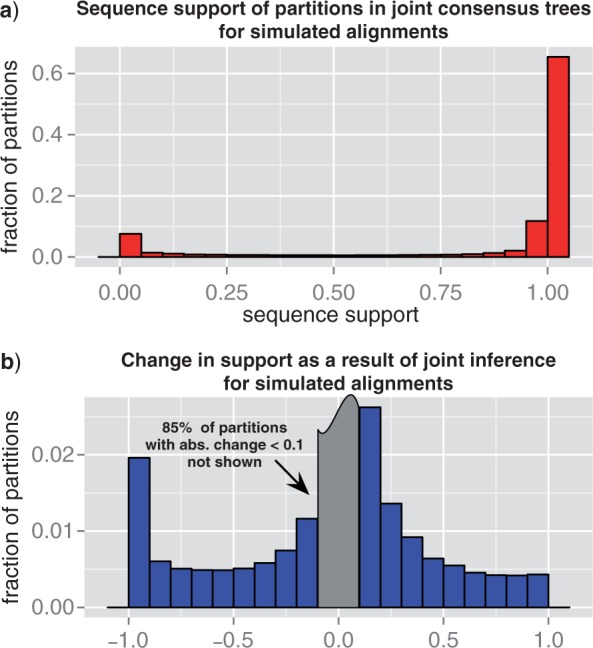
Statistical support for simulated gene families. We calculated the statistical support of bipartitions as their frequency in MCMC samples based on both the joint likelihood and sequence alone. a) Shows the distribution of sequence-only support for bipartitions present in the joint majority consensus trees. b) Presents the distribution of the difference between sequence-only and joint support for all bipartitions.
Figure A.3.
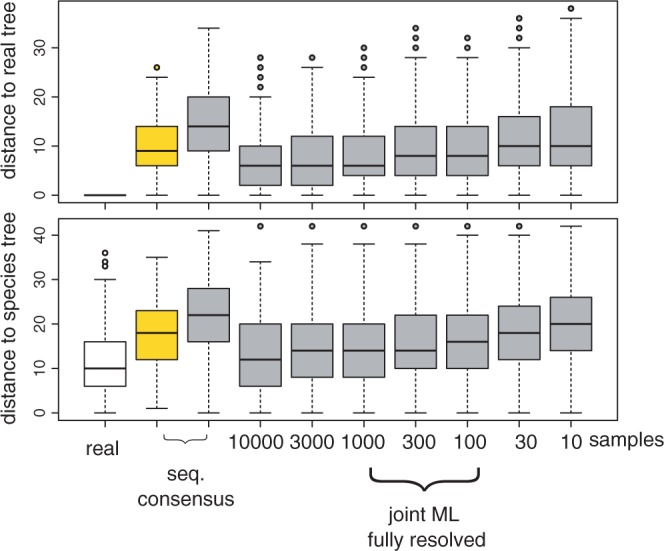
Reconstruction accuracy for different sample sizes. To examine the accuracy of reconstructions for simulated data, we used ALEml to recover the ML reconciled trees for 342 universal single-copy families from simulated sequences. In both the top and bottom panel, the first set values in white corresponds to real trees. The second and third set of values were obtained from sequence-only samples for respectively the COMPLEX and SIMPLE models of sequence evolution. The seven remaining set of values correspond to ALEml estimates of the ML reconciled trees for samples of 10, 30, 100, 300, 1000, 3000, 10 000 gene tree chosen randomly and without replacement.
Figure A.4.

Chronologically ordered species tree used in gene tree inference. ML chronologically ordered species phylogeny based on 36 genomes with 8 332 homologous gene families from (Szöllősi et al. 2012).
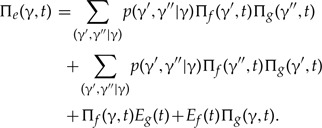
The probability of the lineage leading to the first bifurcation resolving clade γ being seen in an unrepresented species is:
 |
(A.2) |
where ℰi(S) denotes the set of branches of S in time slice i. The terms correspond to (i) no event with an observed descendent; (ii) birth of two gene lineages by speciation, duplication or transfer, such that both leave observed descendants; (iii) and (iv) birth of two gene lineages with observed descendants as a result of transfer back to the represented phylogeny; and finally, (v) transfer back to the represented phylogeny following which the copy in the unrepresented donor lineage does not leave an observed descendant, compare equation (5) and Figure A1 of Szöllősi et al. (2013).
At speciation times t = ti where branches f and g descend from e in S, a represented speciation takes place that may be followed by a loss, compare equation (6) and Figure A1 of Szöllősi et al. (2013):
 |
(A.3) |
Finally at time t = 0 on each terminal branch e of S, the presence of observed genes for trivial clades γ = {u} composed of a single leaf is expressed as:
| (A.4) |
ALE implementation.—We implemented two methods to explore reconciliations for gene trees that can be amalgamated from an MCMC sample. Both these methods take as their input a dated binary species tree and a set of CCPs obtained from an MCMC sample of gene tree topologies. In both methods we set σ = 2N, corresponding to making the assumption that the height of the species tree is equal to its expected value under the coalescent (Szöllősi et al. 2013). Both implementations are in C++ and rely heavily on the Bio++ library (Dutheil et al. 2006).
The first, which we call ALEsample samples DTL rates using a simple Metropolis–Hastings algorithm (Metropolis et al. 1953) using the likelihood ℒjoint(A|S,δ,τ,λ,σ = 2N) with an implicit flat prior on rates. At each step of the algorithm, proposals are generated from the current rate values by adding a small random value to each of the three rates, boundaries at 0 are considered as absorbing, that is, for negative proposals a new proposal is generated. For a given set of DTL rates, reconciled trees are sampled using stochastic backtracking along the dynamic programming sum (Szöllősi et al. 2013).
The second, which we call ALEml optimizes DTL rates using the downhill simplex method implemented in Bio++ by maximizing ℒjoint(A|S,3,3,3,3 = 2N) and subsequently finds the ML reconciled gene tree for the ML set of rates using backtracking along the dynamic programming sum (Szöllősi et al. 2012).
Our implementation of ALE is available from https://github.com/ssolo/ALE.git.
Maximum Entropy Distribution for Marginal Split Frequencies
We demonstrate that given marginal split frequencies the distribution over the space of all trees computed using CCPs is the maximum entropy distribution.
Consider  the set of all rooted trees with n leaves, and denote by
  the number of such trees. We index trees by
  . The indicator functions δiγ = 1 and δiξ = 1 indicate, respectively, the presence of clade γ, and the presence of split ξ = (γ′,γ″|γ) of clade γ into complementary daughter clades γ′ and γ″, such that γ\γ′ = γ″ in tree i, and are 0 for all other trees. To simplify notation, we denote the sum over all splits of γ as
the sum over all possible splits as
and the set of splits in tree i as ξ ⊂ i. Finally, we use the convention that identical lower-upper tree indices imply summation over all trees, for example, δiξpi ≡ Σi δiξpi and δiγpi ≡ Σiδiγpi.
Given an arbitrary probability distribution p = {pi} on  the CCPs are defined as
 |
(A.5) |
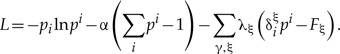
To derive the maximum entropy distribution given a set of observed marginal split frequencies Fξ, we have to find among all distributions p the distribution that matches the observed split frequencies and maximizes the entropy
| (A.6) |
The entropy has to be maximized under the constraints of total probability, that is, Σi pi = 1 and the observed split frequencies:
| (A.7) |
To find the maximum given the above linear constraints, we maximize the Lagrangian
 |
Equating the derivative with respect to pi with zero gives:
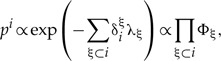 |
where we define the notation Φ = e−λ. Normalizing Φ-s such that
| (A.8) |
satisfies total probability. Furthermore, it implies that
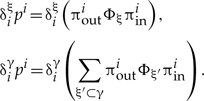
To see that this is the case, we must consider that the branch at the base of γ defines an outer tree and an inner tree, the latter of which corresponds to the clade γ. For any tree i containing split ξ of γ, and consequently also clade 3, one can write down products of Φ-s such that all factors πouti corresponding to the outer tree are on the left, and all factors Φξπini corresponding to the inner tree are on the right, that is,
For a given ξ, the outer tree is constrained only by the presence of γ, whereas the inner tree is constrained by the presence of ξ. We now calculate the numerator and denominator of equation (A.5) separately:
 |
The sums Σiδiξ ··· and Σiδiγ··· can both be split into an outer and an inner part such that the outer sum is over all trees that contain the clade γ, whereas the inner sum contains a particular split resolving γ:
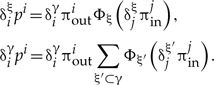 |
The inner sums can be calculated recursively starting from clades with only a single split for which Φ(ξ) = 1, for each ancestral clade the normalization in equation (A.8) recursively implies that these also sum to unity. It follows that
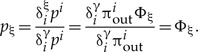 |
(A.9) |
FUNDING
G.J.S. was supported by the Marie Curie Fellowship 253642 “Geneforest” and the Albert Szent-Györgyi Call-Home Researcher Scholarship A1-SZGYA-FOK-13-0005. B.B. has been supported by a Human Frontier Science Program fellowship. This work was granted access to the Institut National de Physique Nucléaire et de Physique des Particules' (IN2P3) computing center. This project was supported by the French Agence Nationale de la Recherche (ANR) through Grant (ANR-10-BINF-01-01) “Ancestrome”.
REFERENCES
- Akerborg O., Sennblad B., Lagergren J. Birth-death prior on phylogeny and speed dating. BMC Evol. Biol. 2008;8:77. doi: 10.1186/1471-2148-8-77. [DOI] [PMC free article] [PubMed] [Google Scholar]
- Akerborg O., Sennblad B., Arvestad L., Lagergren J. Simultaneous Bayesian gene tree reconstruction and reconciliation analysis. Proc. Natl Acad. Sci. USA. 2009;106:5714–5719. doi: 10.1073/pnas.0806251106. [DOI] [PMC free article] [PubMed] [Google Scholar]
- Boussau B., Daubin V. Genomes as documents of evolutionary history. Trends Ecol. Evol. 2010;25:224–232. doi: 10.1016/j.tree.2009.09.007. [DOI] [PubMed] [Google Scholar]
- Boussau B., Szöllősi G. J., Duret L., Gouy M., Tannier E., Daubin V. Genome-scale coestimation of species and gene trees. Genome Res. 2012;23:323–330. doi: 10.1101/gr.141978.112. [DOI] [PMC free article] [PubMed] [Google Scholar]
- Criscuolo A., Gribaldo S. Large-scale phylogenomic analyses indicate a deep origin of primary plastids within cyanobacteria. Mol. Biol. Evol. 2011;28:3019–3032. doi: 10.1093/molbev/msr108. [DOI] [PubMed] [Google Scholar]
- David L. A., Alm E. J. Rapid evolutionary innovation during an Archaean genetic expansion. Nature. 2011;469:93–96. doi: 10.1038/nature09649. [DOI] [PubMed] [Google Scholar]
- Dutheil J., Boussau B. Non-homogeneous models of sequence evolution in the bio++ suite of libraries and programs. BMC. Evol. Biol. 2008;8:255. doi: 10.1186/1471-2148-8-255. [DOI] [PMC free article] [PubMed] [Google Scholar]
- Dutheil J., Gaillard S., Bazin E., Glémin S., Ranwez V., Galtier N., Belkhir K. Bio++: a set of c++ libraries for sequence analysis, phylogenetics, molecular evolution and population genetics. BMC Bioinformatics. 2006;7:188. doi: 10.1186/1471-2105-7-188. [DOI] [PMC free article] [PubMed] [Google Scholar]
- Edgar R. C. Muscle: multiple sequence alignment with high accuracy and high throughput. Nucleic Acids Res. 2004;32:1792–1797. doi: 10.1093/nar/gkh340. [DOI] [PMC free article] [PubMed] [Google Scholar]
- Edwards S. V., Liu L., Pearl D. K. High-resolution species trees without concatenation. Proc. Natl Acad. Sci. USA. 2007;104:5936–5941. doi: 10.1073/pnas.0607004104. [DOI] [PMC free article] [PubMed] [Google Scholar]
- Falcón L. I., Magallón S., Castillo A. Dating the cyanobacterial ancestor of the chloroplast. ISME J. 2010;4:777–783. doi: 10.1038/ismej.2010.2. [DOI] [PubMed] [Google Scholar]
- Felsenstein J. Evolutionary trees from DNA sequences: a maximum likelihood approach. J. Mol. Evol. 1981;17:368–376. doi: 10.1007/BF01734359. [DOI] [PubMed] [Google Scholar]
- Guindon S., Gascuel O. A simple, fast, and accurate algorithm to estimate large phylogenies by maximum likelihood. Syst. Biol. 2003;52:696–704. doi: 10.1080/10635150390235520. [DOI] [PubMed] [Google Scholar]
- Höhna S., Drummond A. J. Guided tree topology proposals for Bayesian phylogenetic inference. Syst. Biol. 2012;61:1–11. doi: 10.1093/sysbio/syr074. [DOI] [PubMed] [Google Scholar]
- Jaynes E. T., Bretthorst G. L. Probability theory: the logic of science. Cambridge, UK: Cambridge University Press; 2003. [Google Scholar]
- Larget B. The estimation of tree posterior probabilities using conditional clade probability distributions. Syst. Biol. 2013;62:501–511. doi: 10.1093/sysbio/syt014. [DOI] [PMC free article] [PubMed] [Google Scholar]
- Lartillot N., Lepage T., Blanquart S. Phylobayes 3: a Bayesian software package for phylogenetic reconstruction and molecular dating. Bioinformatics. 2009;25:2286–2288. doi: 10.1093/bioinformatics/btp368. [DOI] [PubMed] [Google Scholar]
- Le S. Q., Gascuel O. An improved general amino acid replacement matrix. Mol. Biol. Evol. 2008;25:1307–1320. doi: 10.1093/molbev/msn067. [DOI] [PubMed] [Google Scholar]
- Liu L., Pearl D. K. Species trees from gene trees: reconstructing Bayesian posterior distributions of a species phylogeny using estimated gene tree distributions. Syst. Biol. 2007;56:504–514. doi: 10.1080/10635150701429982. [DOI] [PubMed] [Google Scholar]
- Maddison W. P. Gene trees in species trees. Syst. Biol. 1997;46:523–536. [Google Scholar]
- Metropolis N., Rosenbluth A. W., Rosenbluth M. N., Teller A. H., Teller E. Equation of state calculations by fast computing machines. J. Chem. Physics. 1953;21:1087–1092. [Google Scholar]
- Nguyen T., Doyon J.-P., Pointet S., Arigon Chifolleau A.-M., Ranwez V., Berry V. Accounting for gene tree uncertainties improves gene trees and reconciliation inference. In: Raphael B., Tang J., editors. Algorithms in Bioinformatics, vol. 7534 of Lecture Notes in Computer Science. Berlin, Heidelberg: Springer; 2012. pp. 123–134. [Google Scholar]
- Penel S., Arigon A.-M., Dufayard J.-F., Sertier A.-S., Daubin V., Duret L., Gouy M., Perrière G. Databases of homologous gene families for comparative genomics. BMC Bioinformatics. 2009;10(Suppl. 6):S3. doi: 10.1186/1471-2105-10-S6-S3. [DOI] [PMC free article] [PubMed] [Google Scholar]
- Rasmussen M. D., Kellis M. Unified modeling of gene duplication, loss, and coalescence using a locus tree. Genome Res. 2012;22:755–765. doi: 10.1101/gr.123901.111. [DOI] [PMC free article] [PubMed] [Google Scholar]
- Szöllősi G. J., Boussau B., Abby S. S., Tannier E., Daubin V. Phylogenetic modeling of lateral gene transfer reconstructs the pattern and relative timing of speciations. Proc. Natl Acad. Sci. USA. 2012;109:17513–17518. doi: 10.1073/pnas.1202997109. [DOI] [PMC free article] [PubMed] [Google Scholar]
- Szöllősi G. J., Daubin V. Modeling gene family evolution and reconciling phylogenetic discord. Methods Mol. Biol. 2012;856:29–51. doi: 10.1007/978-1-61779-585-5_2. [DOI] [PubMed] [Google Scholar]
- Szöllősi G. J., Tannier E., Lartillot N., Daubin V. Lateral gene transfer from the dead. Syst. Biol. 2013;62:386–397. doi: 10.1093/sysbio/syt003. [DOI] [PMC free article] [PubMed] [Google Scholar]
- Talavera G., Castresana J. Improvement of phylogenies after removing divergent and ambiguously aligned blocks from protein sequence alignments. Syst. Biol. 2007;56:564–577. doi: 10.1080/10635150701472164. [DOI] [PubMed] [Google Scholar]
- Tofigh A. 2009. Using trees to capture reticulate evolution: lateral gene transfers and cancer progression. (Ph.D. thesis) KTH, School of Computer Science and Communication. [Google Scholar]
- Wu Y.-C., Rasmussen M. D., Bansal M. S., Kellis M. Treefix: Statistically informed gene tree error correction using species trees. Syst. Biol. 2013;62:110–120. doi: 10.1093/sysbio/sys076. [DOI] [PMC free article] [PubMed] [Google Scholar]