

Abstract
♦ Background: Peritoneal effluent contains clinically relevant substances derived from intraperitoneal production or transperitoneal transport, or both. The glycoproteinase matrix metalloproteinase 2 (MMP-2) cleaves denatured collagen and complements other collagenases in the degradation of fibrillar collagens. Elevated intraperitoneal levels of plasminogen activator inhibitor 1 (PAI-1) have been demonstrated to be present in patients with intra-abdominal adhesions. The aim of the present study was therefore to investigate the potential for effluent MMP-2 and PAI-1 to be used as markers of the development of peritoneal alterations. In addition, MMP-2 was analyzed in previously frozen effluent samples from a uremic rat model, in which data concerning the severity of peritoneal fibrosis were available.
♦ Methods: This prospective, single-center cohort study included 86 incident peritoneal dialysis (PD) patients. All patients were treated solely with biocompatible dialysis solutions and underwent a standard peritoneal permeability analysis (SPA). The presence of local MMP-2 and PAI-1 production and the relationships between those markers and peritoneal transport parameters were analyzed. Furthermore, effluent interleukin 6 was analyzed as a marker of local inflammation.
♦ Results: Median effluent levels of 21.4 ng/mL for MMP-2 and 0.9 ng/mL for PAI-1 were found. The median dialysate appearance rates were 218.8 ng/min for MMP-2 and 9.6 ng/min for PAI-1. Local peritoneal production averaged 90% of effluent MMP-2 concentration and 74% of effluent PAI-1 concentration. Furthermore, correlations between peritoneal transport parameters and MMP-2 and PAI-1 were observed. Longitudinal follow-up showed no change for MMP-2 (p = 0.37), but a tendency for PAI-1 to increase with the duration of PD (p < 0.001). In rats, a significant relationship was present between the extent of peritoneal fibrosis and the appearance rate of MMP-2 (r = 0.64, p = 0.03).
♦ Conclusions: The foregoing data illustrate the potential of effluent MMP-2 and PAI-1 as biomarkers of peritoneal modifications, especially fibrosis; however, the components of peritoneal transport and local production should be clearly distinguished in every patient.
Keywords: Biomarkers, fibrosis, matrix metalloproteinase 2, peritoneal membrane, plasminogen activator inhibitor type 1
In peritoneal dialysis (PD), solutes are transported from the peritoneal microcirculation to the peritoneal cavity (1) and vice versa. After long-term PD treatment, functional and morphologic alterations of the peritoneal membrane occur because of continuous contact with conventional PD solutions (2,3). In 12% of patients, ultrafiltration failure develops after a PD duration of more than 2 years (4). Development of ultrafiltration failure, especially after loss of residual urine production, is a serious complication that often leads to overhydration. Histologically, ultrafiltration failure is associated with vascular abnormalities in the peritoneum and is generally accompanied by extensive interstitial fibrosis. A relationship was found between the number of blood vessels and the amount of peritoneal fibrosis (2). In the presence of serious membrane damage, free water transport through endothelial water channels is especially impaired (5,6).
The performance of serial peritoneal biopsies to detect morphology modifications is not feasible in PD patients. Evidence provided by peritoneal transport characteristics or peritoneal effluent biomarkers is therefore necessary to detect early peritoneal membrane alterations and to monitor the effectiveness of PD treatment.
Currently, cancer antigen 125 (CA125) is the best-known effluent marker. Measured in peritoneal effluent, this glycoprotein is proportional to the number of mesothelial cells (7). Less research has been performed on the coagulation and fibrinolysis factors present in peritoneal effluent. Human peritoneal mesothelial cells are capable of producing several coagulation and fibrinolysis factors (8), such as tissue-type plasminogen activator and plasminogen activator inhibitor type 1 (PAI-1). The single-chain glycoprotein PAI-1 (molecular weight: approximately 50 kDa) is the main inhibitor of tissue-type plasminogen activator. It is produced by various cell types, including endothelial cells and vascular smooth muscle cells (9,10). Elevated levels of PAI-1 are present in the peritoneal tissue of surgical patients with intra-abdominal adhesions (11,12). Expression of PAI-1 is also intensified and widely distributed in submesothelial tissue during peritonitis in PD patients (13,14).
Expansion of extracellular matrix in the interstitium is the major morphologic change in the peritoneum. Homeostasis of the matrix is achieved by a balance between synthesis and degradation. In the extracellular surroundings, matrix metalloproteinases (MMPs) are initially synthesized as latent inactive zymogens (15). After activation at neutral pH, MMPs are capable of degrading all matrix constituents (16). The glycoproteinase MMP-2 (molecular weight: 72 kDa) cleaves denatured collagen and thereby complements other collagenases in the degradation of fibrillar collagens (17,18). High concentrations of MMP-2 have been described in PD patients who develop encapsulating peritoneal sclerosis (19).
We hypothesized that MMP-2 and PAI-1 contribute to the remodeling of the peritoneal matrix during PD and thereby to the process of fibrinogenesis. We also postulated that concentrations of these molecules in peritoneal effluent represent fibrous change and are not just a result of diffusion from the circulation. We therefore aimed to investigate the potential use of MMP-2 and PAI-1 in effluent as biomarkers for the development of peritoneal alterations during longitudinal follow-up of chronic PD patients treated solely with biocompatible dialysis solutions.
Methods
Subjects
This prospective, single-center cohort study was conducted between January 2002 and December 2009. All chronic renal failure patients were permitted to enroll if they were being treated with biocompatible PD solutions, if they had a baseline standard peritoneal permeability analysis (SPA) performed in the first year of PD treatment, and if they were at least 18 years of age. All patients were treated with a bicarbonate/lactate-buffered solution (Physioneal: Baxter Healthcare SA, Castlebar, Ireland) for the short dwells, and almost all used a 7.5% icodextrin solution (Extraneal: Baxter Healthcare SA) for the long dwell. In some patients, 1 short dwell was performed with an amino-acid-based solution (Nutrineal: Baxter Healthcare SA). Demographic data collected were age, sex, PD duration, peritoneal transport parameters, and primary kidney disease classified using the codes of the European Renal Association-European Dialysis and Transplantation Association. Repeated measurements over time in each patient, obtained from the SPA, were investigated.
Procedure
The SPA is a peritoneal function assessment performed once yearly as conventional patient care at our center (20). In brief, before instillation of a 3.86% glucose-based test solution, the peritoneal cavity is rinsed with a 1.36% glucose-based dialysis solution. Before and during the 4-hour dwell period of the test, intermediate effluent samples are obtained at multiple time points (0, 10, 20, 30, 60, 120, 180, and 240 minutes).
For the calculation of fluid kinetics, 1.0 g/L dextran 70 (Hyskon: Medisan Pharmaceuticals AB, Uppsala, Sweden) is added to the test solution. Dextran 1 (Promiten: NPBI International, Emmer-Compascuum, Netherlands) is injected intravenously before instillation of the test solution to prevent a possible anaphylactic reaction to dextran 70. Effluent samples used in the present study were taken from the test solution at 240 minutes after instillation. Blood samples were taken at the beginning and end of the test. All samples were centrifuged at 1710g for 10 minutes and frozen at -26°C until analysis.
Assays
Creatinine, urea, and urate were measured by enzymatic methods on an automated analyzer (Hitachi H747: Boehringer Mannheim, Mannheim, Germany). In peritoneal effluent, CA125 was determined by a microparticle enzyme immunoassay in combination with a monoclonal antibody OC125 on an E170 autoanalyzer (Roche Diagnostics, Basel, Switzerland). Dialysate interleukin-6 (IL-6) was used as a marker of local inflammation and was detected with the aid of a quantitative sandwich ELISA technique (R&D Systems, Minneapolis, MN, USA).
Serum and effluent concentrations of MMP-2 and PAI-1 were determined by quantitative sandwich ELISA (R&D Systems). The MMP-2 and PAI-1 assays had a mean minimum detectable concentration of 0.047 ng/mL and 0.059 ng/mL respectively. The intra-assay precision averaged 5.6% for MMP-2 and 6.7% for PAI-1.
Analytical Methods
Appearance rates of MMP-2, PAI-1, and IL-6 were calculated to correct for the drained effluent volume, because diffusion of these markers is negligible. In the relevant equation, the product of the biomarker levels and the drained effluent volume is divided by the total dwell time.
Peritoneal macromolecular transport lines were computed for each patient, based on a least-squares regression analysis of the dialysate-to-plasma ratio (D/P) of β2-microglobulin (11.8 kDa), albumin (69 kDa), immunoglobulin G (150 kDa), and α2-macroglobulin (820 kDa) and of their molecular weights, plotted on a double logarithmic scale. The slope of the resulting line represents the size selectivity of the peritoneal membrane, because those proteins are transported from the circulation to the peritoneal cavity. By interpolation of the molecular weights of MMP-2 and PAI-1 in the regression equation, the expected D/P for each of those molecules was calculated. The concentrations of MMP-2 and PAI-1 attributed to local production were defined as the difference between the measured and the predicted dialysate concentration (21,22).
To express the transport of low molecular weight solutes, the mass transfer area coefficients (MTACs) of creatinine, urea, and urate were calculated according to the model set out by Waniewski et al. (23) and corrected for body surface area. Solute concentrations in serum were corrected for plasma water (24), and Na+ sieving was corrected for diffusion by MTACurate (25). Free water transport (FWT) at 60 minutes was calculated as described by Smit et al. (26) and La Milia et al. (27), and small-pore transport at 60 minutes was calculated from the Na+ amount transported during that hour, divided by the concentration of the dialysate Na+ concentration.
Correlations between peritoneal transport parameters, PD duration, and MMP-2 or PAI-1 were based on data from the last available SPA. Subsequently, effluent concentrations of the biomarkers were divided into quartiles to explore the associations found by means of a Kruskal-Wallis test. For non-normally distributed continuous variables at baseline, medians and ranges were calculated (unless stated otherwise), and categorical variables were calculated as proportions.
To analyze the time course of effluent MMP-2, PAI-1, and peritoneal fluid transport parameters, we used a linear mixed model with the restricted maximum likelihood estimation method in PASW Statistics (version 18.0.2: SPSS, Chicago, IL, USA) and included a repeated statement as well as a random intercept. Duration of PD was incorporated as a categorical variable by means of the number of SPAs. The model takes into account the association between repeated measurements in the same patient and is capable of handling unbalanced data.
Assessment of Fibrosis
For ethical reasons, peritoneal biopsies were absent in this study population. To verify the potential of effluent MMP-2 and PAI-1 as markers of peritoneal fibrosis, we therefore made use of data obtained from a chronic uremic rat model that was part of an attempt to develop a model of peritoneal sclerosis in rodents, as previously published by our group (28,29). Omental tissue and peritoneal effluent samples had been collected after a peritoneal function test adapted for the rat. Peritoneal specimens were fixed in 4% buffered formalin, embedded in paraffin, and stained for picro-sirius red (Gurr: BDH, London, UK). Subsequently, the amount of fibrosis was scored blinded and independently by 2 observers according to the following grading system: 0 = normal presence of fibrous tissue, 1 = mild fibrosis, 2 = moderate fibrosis, 3 = severe fibrosis, and 4 = excessive fibrosis or sclerosis. A maximum fibrosis score of 12 was achievable. Effluent levels of MMP-2 were assessed by means of a recently developed quantitative sandwich ELISA (USCN Life Science, Wuhan, China). Unfortunately, no data for PAI-1 could be obtained because of the unavailability of an assay suitable for the rat.
Results
The 86 adult incident PD patients included in the study had a median of 2 available SPAs (range: 1 - 6). Table 1 shows baseline demographics for the patients. At baseline, median effluent MMP-2 was 21.4 ng/mL (range: 0.1 - 196.2 ng/mL), and median effluent PAI-1 was 0.9 ng/mL (range: 0.1 - 7.1 ng/mL). Median dialysate appearance rates for MMP-2 and PAI-1 were 218.8 ng/min (range: 0.8 - 2114.2 ng/min) and 9.6 ng/min (range: 0.9 - 74.9 ng/min) respectively. Median serum MMP-2 and PAI-1 at baseline were 242.9 ng/mL (range: 51.6 - 4664.7 ng/mL) and 20.9 ng/mL (range: 2.4 - 76.7 ng/mL) respectively. Local production averaged 90% for effluent MMP-2 and 74% for effluent PAI-1 (Figure 1). Also, expressed as ratio, both D/PMMP-2 and D/PPAI-1 over D/Palbumin exceeded 1; evidence for local production on top of transport was therefore established (data not shown).
TABLE 1.
Baseline Patient Demographics
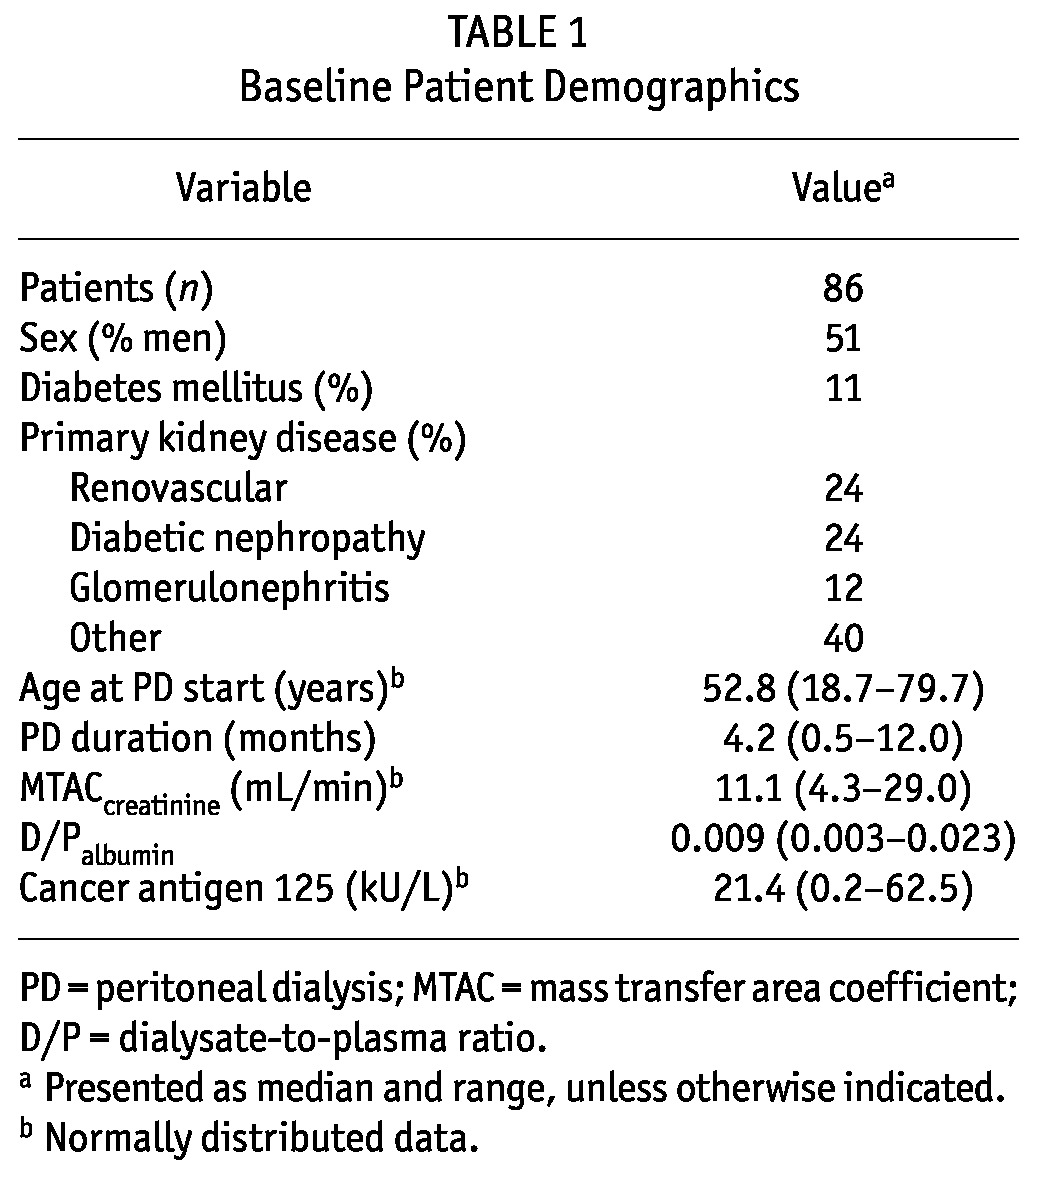
Figure 1 —
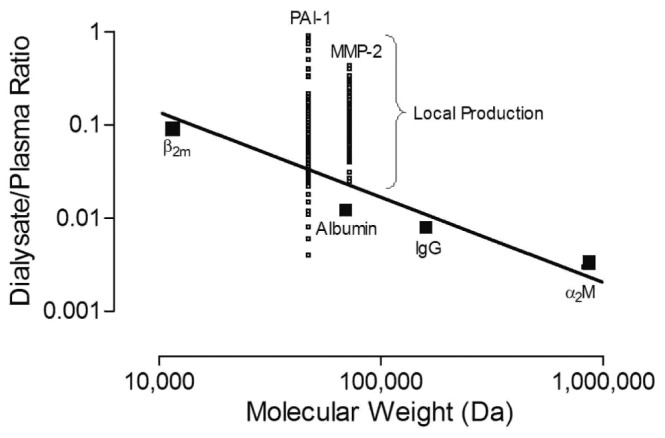
Local production of matrix metalloproteinase-2 (MMP-2) and plasminogen activator inhibitor 1 (PAI-1). A linear transport line was constructed for assessment of local production based on the dialysate-to-plasma ratio of β2-microglobulin (β2m), albumin, immunoglobulin G (IgG), and α2-macroglobulin (α2M) plotted against their molecular weight. When the measured levels of MMP-2 and PAI-1 in dialysate exceeded the levels predicted by interpolation of their molecular weight, the positive discrepancy was attributed to local production.
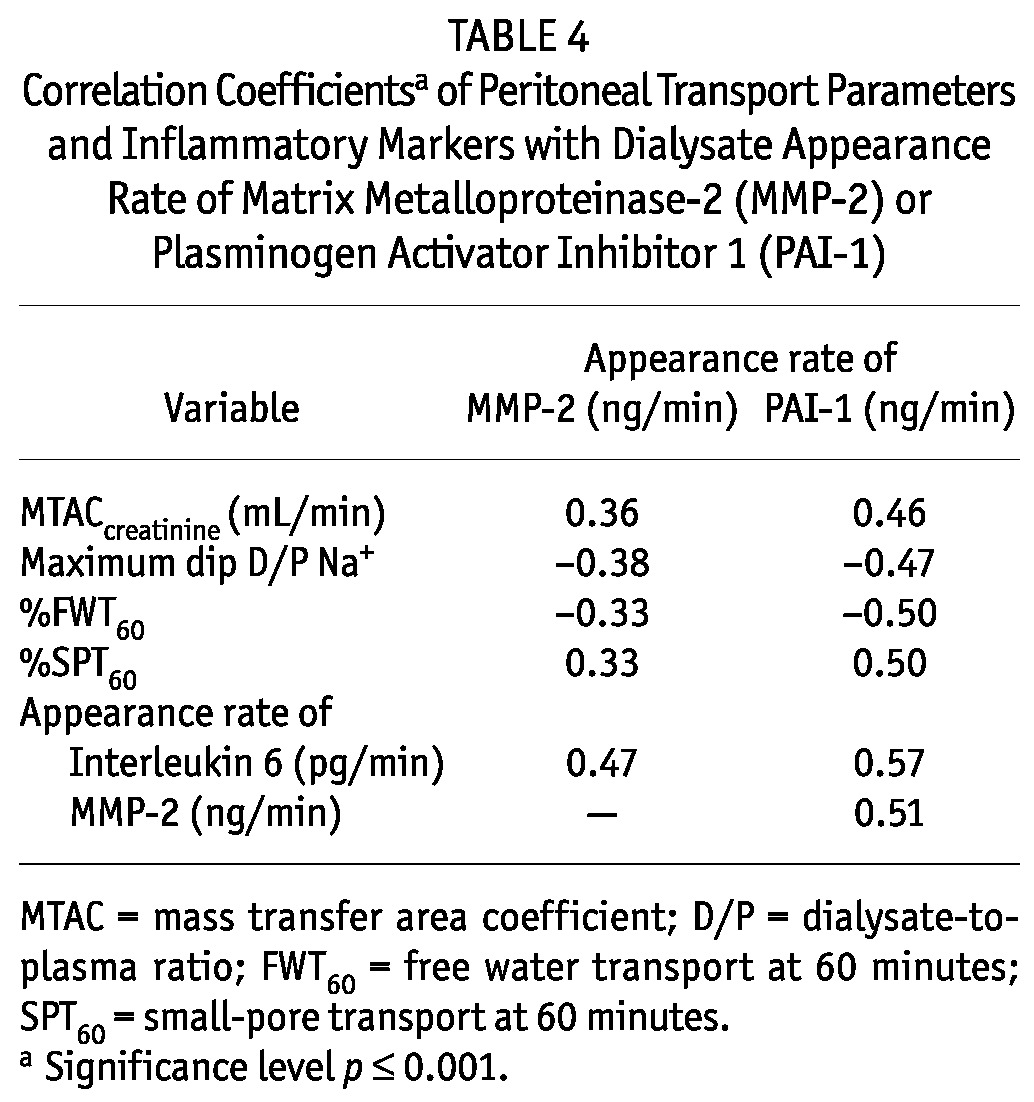
Effluent concentrations of MMP-2 and PAI-1 were analyzed in quartiles (Tables 2 and 3). The results showed that the highest quartile of MMP-2 and of PAI-1 was associated with the longest duration of PD and the highest prevalence of ultrafiltration failure. Similar results were not found for CA125 in the present study. Despite the limited contribution of peritoneal diffusion, effluent MMP-2 and PAI-1 were also associated with other parameters of peritoneal transport, such as the MTAC of creatinine and indices of FWT. Such relationships were not present for net ultrafiltration and small-pore fluid transport. All transport parameters that showed a significant trend in the quartile analysis also showed a significant correlation coefficient in a linear regression analysis. A correlation analysis also indicated associations between the appearance rates of effluent MMP-2, PAI-1, and IL-6 (Table 4). However, all effluent IL-6 values were within the normal range and did not show evidence of severe inflammation.
TABLE 2.
Factors and Peritoneal Transport Parameters by Quartile of the Dialysate Appearance Rate of Matrix Metalloproteinase-2 (MMP-2)
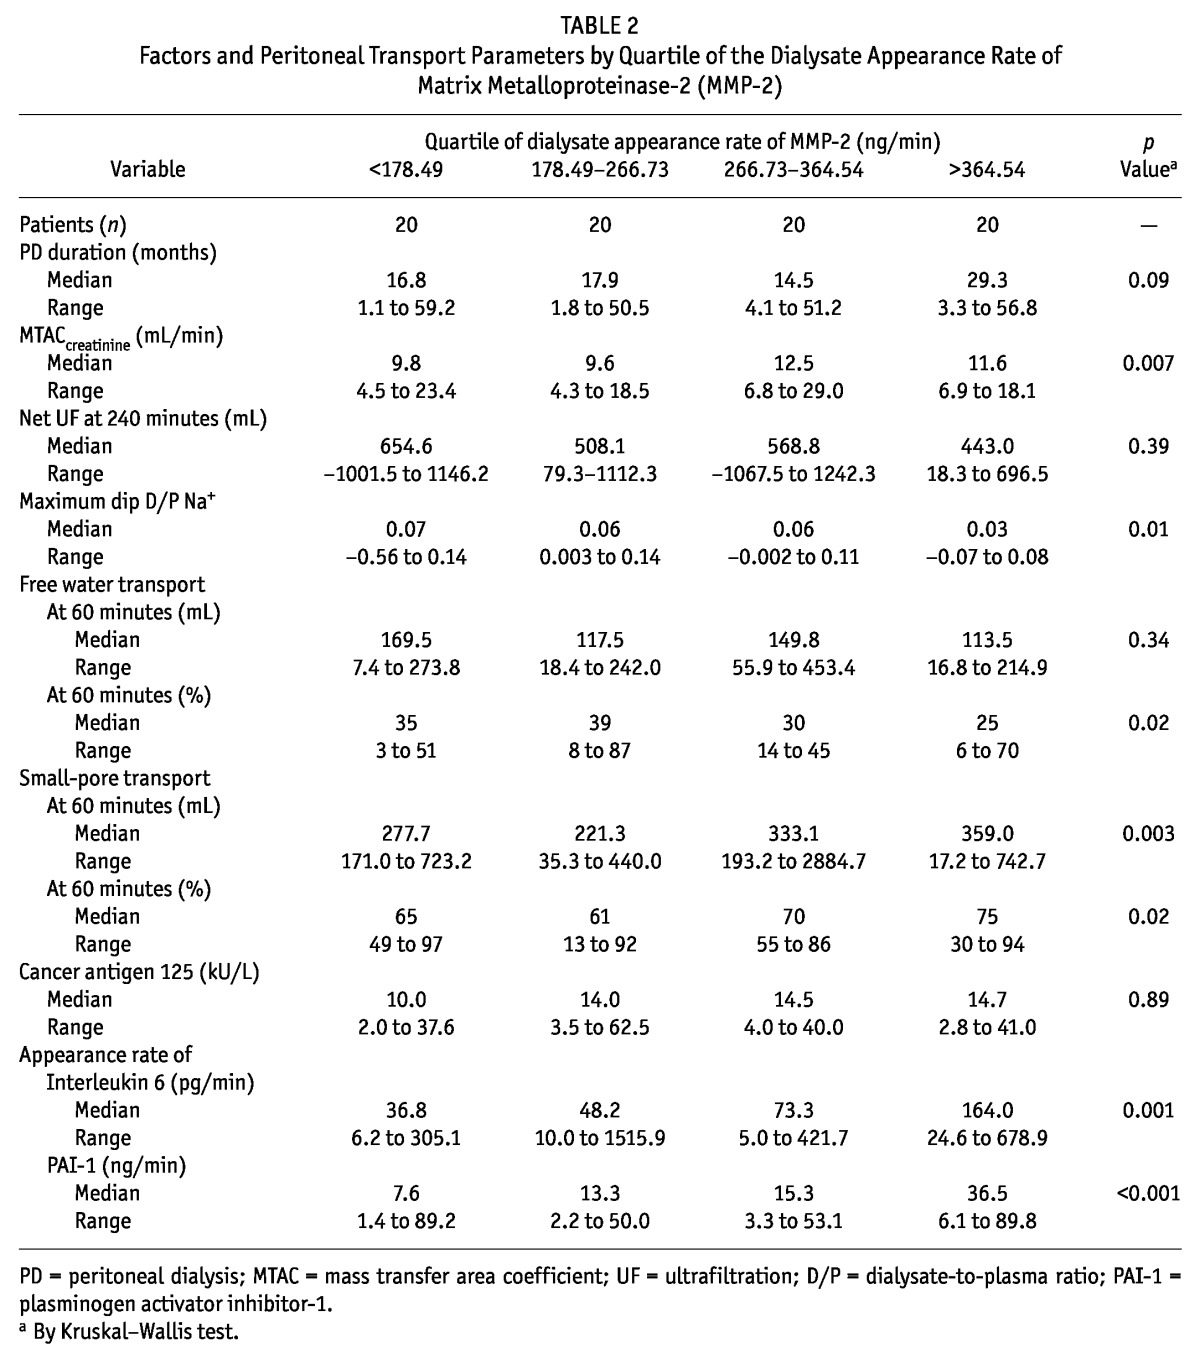
TABLE 3.
Factors and Peritoneal Transport Parameters by Quartile of the Dialysate Appearance Rate of Plasminogen Activator Inhibitor 1 (PAI-1)
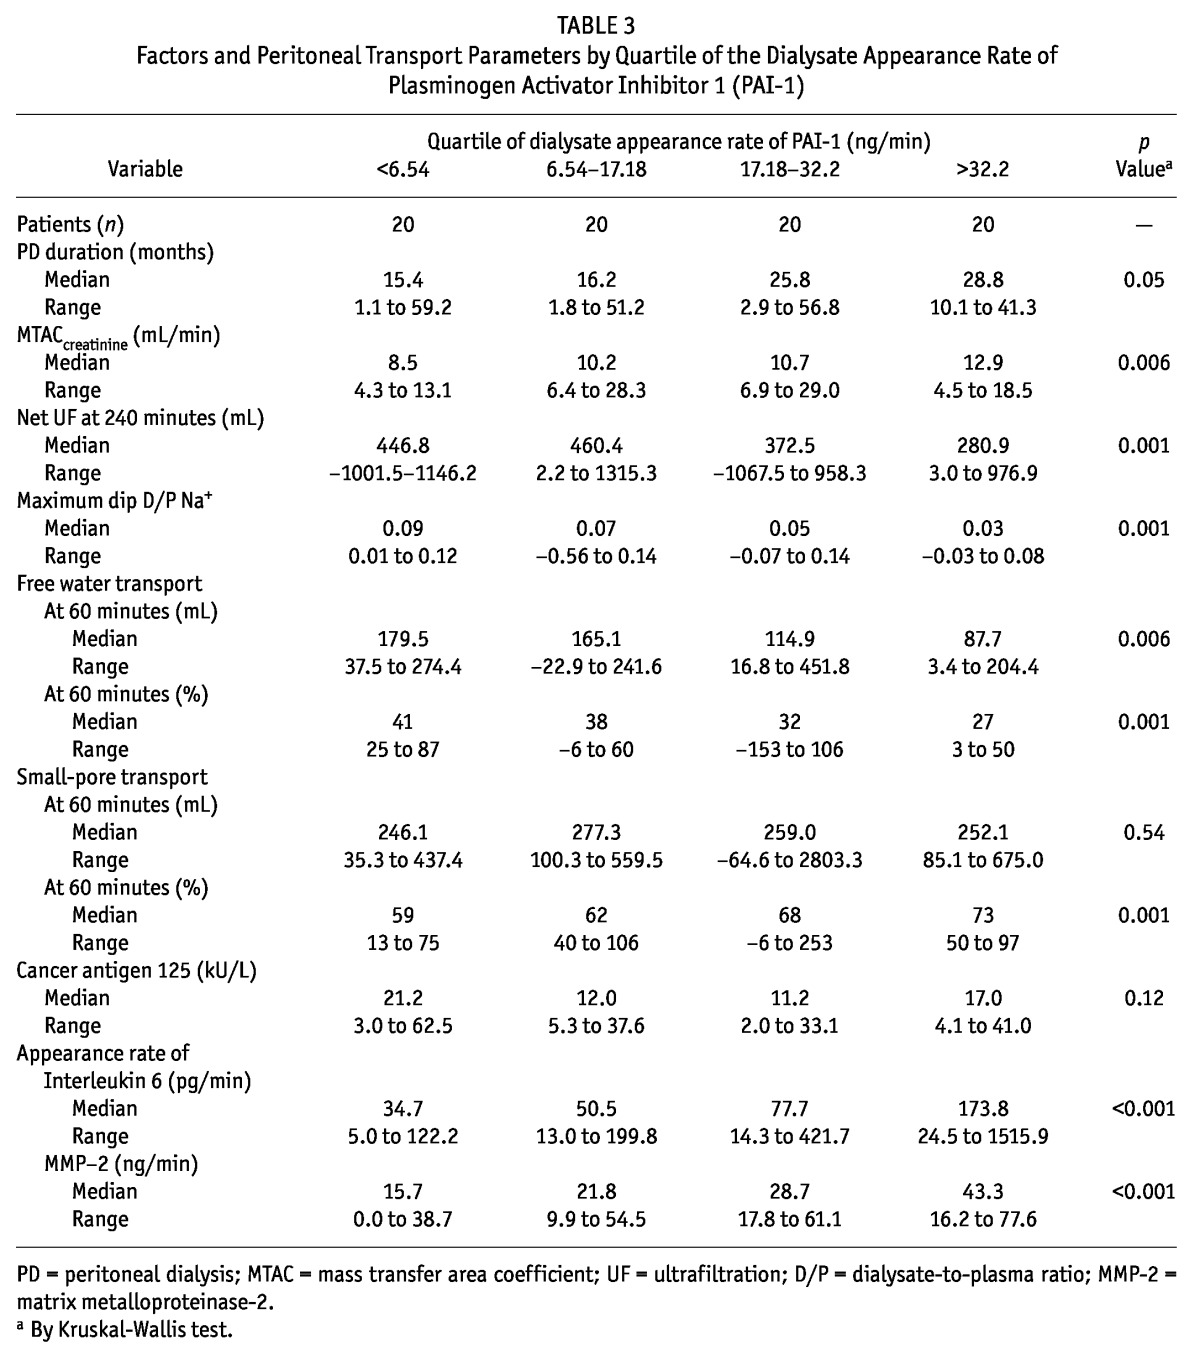
TABLE 4.
Correlation Coefficientsa of Peritoneal Transport Parameters and Inflammatory Markers with Dialysate Appearance Rate of Matrix Metalloproteinase-2 (MMP-2) or Plasminogen Activator Inhibitor 1 (PAI-1)
The time course derived from the linear mixed model showed no significant difference in the appearance rate MMP-2 [Figure 2(A)], although a positive correlation with the duration of PD (r = 0.28, p = 0.008) was present. In Figure 2(B), the time course of the PAI-1 appearance rate shows a significant increase with duration of PD (compared with baseline SPA: p < 0.001). Additionally, a positive relationship was found between effluent PAI-1 and PD duration (r = 0.22, p = 0.04). A downward trend with duration of PD treatment was observed for CA125 (p = 0.001), but no difference could be found in the trend of MTACcreatinine [p = 0.91, Figure 2(C)] or in the percentage of FWT [p = 0.64, Figure 2(D)].
Figure 2 —

Time course of matrix metalloproteinase-2 (MMP-2), plasminogen activator inhibitor 1 (PAI-1), the mass transfer area coefficient (MTAC) of creatinine, and percentage of free water transport. Studied by linear mixed model, a nonsignificant time course of dialysate MMP-2 (panel A) and a significant change in dialysate PAI-1 (panel B) with time on peritoneal dialysis are seen. In panels C and D, the time courses of the MTAC creatinine and the percentage of free water transport at 60 minutes show no differences with the duration of biocompatible PD treatment. The values presented are estimated marginal means and standard errors provided by the model. The number (Nr) of subjects per time point are specified underneath the graphs. SPA = standard peritoneal permeability analysis.
To assess peritoneal fibrosis and verify the potential use of MMP-2 as a marker of fibrosis, 12 rats were analyzed. Effluent MMP-2 in rats was detectable, with a median concentration of 11.6 ng/mL (range: 1.0 - 99.5 ng/mL). Figure 3 depicts the correlation between the MMP-2 appearance rate and fibrosis scores. Evidently, extensive fibrosis corresponds with high levels of effluent MMP-2.
Figure 3 —
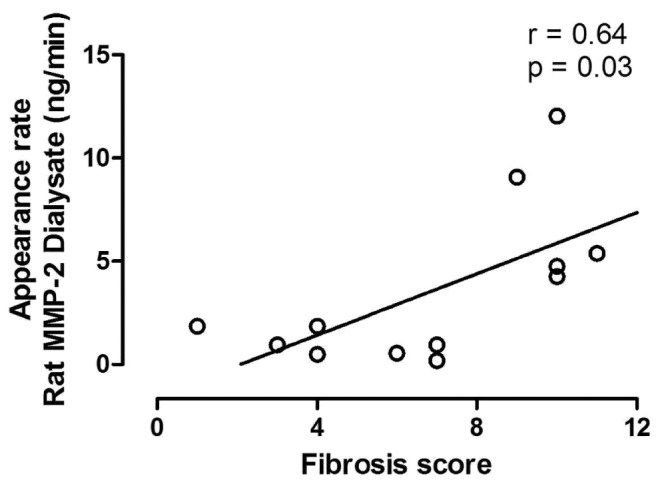
Association of rat peritoneal fibrosis scores with the dialysate appearance rate of matrix metalloproteinase-2 (MMP-2). Because of skewed data, a Spearman rank correlation analysis was performed. The appearance rate of MMP-2 and independently-scored peritoneal fibrosis, derived from a chronic uremic rat model, show a strong positive relationship.
Discussion
Alterations in peritoneal morphology—including neoangiogenesis, fibrosis, and sclerosis—often develop during the time course of PD. Currently, no biomarkers are known to represent the amount of fibrosis in the peritoneal membrane. By providing evidence for the local production of MMP-2 and PAI-1 and for the presence of significant relationships between those molecules and peritoneal solute and fluid transport parameters that are suggestive of peritoneal membrane damage, the present study supports the potential use of effluent MMP-2 and PAI-1 as biomarkers for peritoneal fibrosis.
One of the essential requirements for a peritoneal effluent biomarker that purports to reflect the condition of the peritoneal membrane is the presence of local production. High percentages of locally produced MMP-2 and PAI-1 were present. Those findings imply that changes in effluent MMP-2 and PAI-1 mainly reflect changes in local production. Our findings are in line with, but much more extensive than, the results of a cross-sectional multicenter study in 215 prevalent patients in whom local production and a correlation between MMP-2 and PD duration were found (30). Moreover, a study evaluating hypercoagulation during peritonitis in pediatric patients also found locally produced PAI-1 in effluent (13).
Several pathologic and physiologic processes are known to involve both MMP-2 and PAI-1. Evidence for participation in angiogenesis, cell growth, invasion, and metastasis has been found for MMP-2 (31). The diverse roles that PAI-1 is considered to play include protecting the extracellular matrix from excessive degradation and, conversely, interacting with integrins, the urokinase receptor, and vitronectin (32). The strong relationship between the two markers therefore underlines possible opposing pathways of PAI-1. First, it may act as a protector by inhibiting plasminogen in the fibrinolytic system at injury sites. Second, it is likely a contributing factor in the conversion of the pro-MMPs and thereby involved in the increase of MMP-2 and extracellular matrix degradation. Moreover, as shown by an in vitro study, induction of epithelial-to-mesenchymal transition by mesothelial cells is accompanied by upregulation of MMP-2 (33). Furthermore, the association additionally suggests angiogenesis, in which MMP-2 and PAI-1 are required for the process of activation and resolution (34).
The results of the cross-sectional analysis by quartile of the biomarker appearance rates during the last SPA support a relationship of those markers with other parameters of membrane damage, such as an enlarged vascular surface area and reduced FWT: high appearance rates were associated with high MTACcreatinine and low FWT. The findings with respect to those functional parameters accord with findings in previous investigations by our study group (26,35). The absence of relationships with net ultrafiltration and with small-pore transport confirms that a number of other factors are involved in the magnitude of those parameters (36). The absence of a relationship with CA125 suggests that the mesothelium is unlikely to be involved in the amount of locally produced MMP-2 and PAI-1. Appearance rates of MMP-2 and PAI-1 correlated with IL-6. Additionally, we observed an increase in the appearance rates of IL-6 from the lowest to the highest quartiles of MMP-2 and PAI-1. A possible explanation could be that inflammation precedes fibrotic processes. However, the levels of IL-6 found in this study were lower than levels found during peritonitis (37) and in incident PD patients with a PD duration of less than 6 months (38). Those observations support the contention that, during PD, the peritoneal membrane may be in a state of persistent low-grade inflammation.
Some longitudinal studies reported an increase of small-solute transport with the duration of PD (39). In the present analysis, such an increase was not found for MTACcreatinine and FWT. Although the idea speculative, it cannot be excluded that the use of only biocompatible solutions in the present study is the cause of that difference, especially given that a marked reduction in the number of peritoneal vessels has also been found in rats during long-term follow-up with a biocompatible solution (40). Nevertheless, PAI-1 increased slightly over time, although a trend for MMP-2 was absent. The results, indicating less peritoneal damage during follow-up with biocompatible dialysis solutions, will have to be confirmed.
Conclusions
Our study demonstrates that, in addition to CA125 and IL-6, MMP-2 and PAI-1 can be used as biomarkers in PD. The establishment of local production, associations with relevant peritoneal transport parameters, and a relationship with in vivo histologic data make it likely that an uncomplicated method is available for monitoring peritoneal fibrosis. Independent verification of these study results, in a larger study population and in patients with varying degrees of peritoneal injury, is required. Furthermore, after validation, the biomarkers MMP-2 and PAI-1 suggest a future potential to serve as a target for therapeutic interventions during PD treatment.
Disclosures
The authors declare that they have no relevant financial interests.
Acknowledgments
The authors acknowledge Anniek Vlijm and Marijke de Graaff for providing the effluent samples and data from the experimental animal model.
References
- 1. Nolph KD, Popovich RP, Ghods AJ, Twardowski Z. Determinants of low clearances of small solutes during peritoneal dialysis. Kidney Int 1978; 13:117–23 [DOI] [PubMed] [Google Scholar]
- 2. Mateijsen MA, van der Wal AC, Hendriks PM, Zweers MM, Mulder J, Struijk DG, et al. Vascular and interstitial changes in the peritoneum of CAPD patients with peritoneal sclerosis. Perit Dial Int 1999; 19:517–25 [PubMed] [Google Scholar]
- 3. Williams JD, Craig KJ, Topley N, Von Ruhland C, Fallon M, Newman GR, et al. on behalf of the Peritoneal Biopsy Study Group. Morphologic changes in the peritoneal membrane of patients with renal disease. J Am Soc Nephrol 2002; 13:470–9 [DOI] [PubMed] [Google Scholar]
- 4. Sampimon DE, Coester AM, Struijk DG, Krediet RT. The time course of peritoneal transport parameters in peritoneal dialysis patients who develop encapsulating peritoneal sclerosis. Nephrol Dial Transplant 2011; 26:291–8 [DOI] [PubMed] [Google Scholar]
- 5. Smit W, Parikova A, Krediet RT. Ultrafiltration failure in peritoneal dialysis. Causes and clinical consequences. Minerva Urol Nefrol 2005; 57:165–74 [PubMed] [Google Scholar]
- 6. Smit W, Parikova A, Struijk DG, Krediet RT. The difference in causes of early and late ultrafiltration failure in peritoneal dialysis. Perit Dial Int 2005; 25(Suppl 3):S41–5 [PubMed] [Google Scholar]
- 7. Krediet RT. Dialysate cancer antigen 125 concentration as marker of peritoneal membrane status in patients treated with chronic peritoneal dialysis. Perit Dial Int 2001; 21:560–7 [PubMed] [Google Scholar]
- 8. Sitter T, Spannagl M, Schiffl H, Held E, van Hinsbergh VW, Kooistra T. Imbalance between intraperitoneal coagulation and fibrinolysis during peritonitis of CAPD patients: the role of mesothelial cells. Nephrol Dial Transplant 1995; 10:677–83 [PubMed] [Google Scholar]
- 9. Loskutoff DJ, Sawdey M, Mimuro J. Type I plasminogen activator inhibitor. Prog Hemost Thromb 1989; 9:87–115 [PubMed] [Google Scholar]
- 10. Dawson S, Henney A. The status of PAI-1 as a risk factor for arterial and thrombotic disease: a review. Atherosclerosis 1992; 95:105–17 [DOI] [PubMed] [Google Scholar]
- 11. Vipond MN, Whawell SA, Thompson JN, Dudley HA. Peritoneal fibrinolytic activity and intra-abdominal adhesions. Lancet 1990; 335:1120–2 [DOI] [PubMed] [Google Scholar]
- 12. Buckman RF, Woods M, Sargent L, Gervin AS. A unifying pathogenetic mechanism in the etiology of intraperitoneal adhesions. J Surg Res 1976; 20:1–5 [DOI] [PubMed] [Google Scholar]
- 13. de Boer AW, Levi M, Reddingius RE, Willems JL, van den Bosch S, Schröder CH, et al. Intraperitoneal hypercoagulation and hypofibrinolysis is present in childhood peritonitis. Pediatr Nephrol 1999; 13:284–7 [DOI] [PubMed] [Google Scholar]
- 14. Holmdahl L, Falkenberg M, Ivarsson ML, Risberg B. Plasminogen activators and inhibitors in peritoneal tissue. APMIS 1997; 105:25–30 [DOI] [PubMed] [Google Scholar]
- 15. Nagase H, Ogata Y, Suzuki K, Enghild JJ, Salvesen G. Substrate specificities and activation mechanisms of matrix metalloproteinases. Biochem Soc Trans 1991; 19:715–18 [DOI] [PubMed] [Google Scholar]
- 16. Khasigov PZ, Podobed OV, Ktzoeva SA, Gatagonova TM, Grachev SV, Shishkin SS, et al. Matrix metalloproteinases of normal human tissues. Biochemistry (Mosc) 2001; 66:130–40 [DOI] [PubMed] [Google Scholar]
- 17. Collier IE, Wilhelm SM, Eisen AZ, Marmer BL, Grant GA, Seltzer JL, et al. H-Ras oncogene-transformed human bronchial epithelial cells (TBE-1) secrete a single metalloprotease capable of degrading basement membrane collagen. J Biol Chem 1988; 263:6579–87 [PubMed] [Google Scholar]
- 18. Wilhelm SM, Collier IE, Marmer BL, Eisen AZ, Grant GA, Goldberg GI. SV40-transformed human lung fibroblasts secrete a 92-kDa type IV collagenase which is identical to that secreted by normal human macrophages. J Biol Chem 1989; 264:17213–21 [PubMed] [Google Scholar]
- 19. Hirahara I, Inoue M, Okuda K, Ando Y, Muto S, Kusano E. The potential of matrix metalloproteinase-2 as a marker of peritoneal injury, increased solute transport, or progression to encapsulating peritoneal sclerosis during peritoneal dialysis—a multicentre study in Japan. Nephrol Dial Transplant 2007; 22:560–7 [DOI] [PubMed] [Google Scholar]
- 20. Pannekeet MM, Imholz AL, Struijk DG, Koomen GC, Langedijk MJ, Schouten N, et al. The standard permeability analysis: a tool for the assessment of peritoneal permeability characteristics in CAPD patients. Kidney Int 1995; 48:866–75 [DOI] [PubMed] [Google Scholar]
- 21. Zemel D, Imholz AL, de Waart DR, Dinkla C, Struijk DG, Krediet RT. Appearance of tumor necrosis factor-alpha and soluble TNF-receptors I and II in peritoneal effluent of CAPD. Kidney Int 1994; 46:1422–30 [DOI] [PubMed] [Google Scholar]
- 22. Krediet RT, Sampimon DE, Vlijm A, Coester AM, Struijk DG, Smit W. Biological markers in the peritoneal dialysate effluent: are they useful. Contrib Nephrol 2009; 163:54–9 [DOI] [PubMed] [Google Scholar]
- 23. Waniewski J, Werynski A, Heimbürger O, Lindholm B. Simple models for description of small-solute transport in peritoneal dialysis. Blood Purif 1991; 9:129–41 [DOI] [PubMed] [Google Scholar]
- 24. Waniewski J, Heimbürger O, Werynski A, Lindholm B. Aqueous solute concentrations and evaluation of mass transport coefficients in peritoneal dialysis. Nephrol Dial Transplant 1992; 7:50–6 [PubMed] [Google Scholar]
- 25. Zweers MM, Imholz AL, Struijk DG, Krediet RT. Correction of sodium sieving for diffusion from the circulation. Adv Perit Dial 1999; 15:65–72 [PubMed] [Google Scholar]
- 26. Smit W, Struijk DG, Ho-Dac-Pannekeet MM, Krediet RT. Quantification of free water transport in peritoneal dialysis. Kidney Int 2004; 66:849–54 [DOI] [PubMed] [Google Scholar]
- 27. La Milia V, Di Filippo S, Crepaldi M, Del Vecchio L, Dell’Oro C, Andrulli S, et al. Mini-peritoneal equilibration test: a simple and fast method to assess free water and small solute transport across the peritoneal membrane. Kidney Int 2005; 68:840–6 [DOI] [PubMed] [Google Scholar]
- 28. Vlijm A, Sampimon DE, de Graaff M, Struijk DG, Krediet RT. Experimental peritoneal sclerosis models should not be based on chlorhexidine gluconate anymore. Nephron Exp Nephrol 2011; 117:e1–8 [DOI] [PubMed] [Google Scholar]
- 29. Vlijm A, Sampimon DE, de Graaff M, Struijk DG, Krediet RT. A two-hit approach in the development of an experimental peritoneal sclerosis model. Adv Perit Dial 2012; 28:26–31 [PubMed] [Google Scholar]
- 30. Hirahara I, Inoue M, Umino T, Saito O, Muto S, Kusano E. Matrix metalloproteinase levels in the drained dialysate reflect the peritoneal solute transport rate: a multicentre study in Japan. Nephrol Dial Transplant 2011; 26:1695–701 [DOI] [PubMed] [Google Scholar]
- 31. Chang C, Werb Z. The many faces of metalloproteases: cell growth, invasion, angiogenesis and metastasis. Trends Cell Biol 2001; 11:S37–43 [DOI] [PMC free article] [PubMed] [Google Scholar]
- 32. Wilkins-Port CE, Freytag J, Higgins SP, Higgins PJ. PAI-1: a multifunctional SERPIN with complex roles in cell signaling and migration. Cell Commun Insights 2010; 3:1–10 [Google Scholar]
- 33. Margetts PJ, Bonniaud P, Liu L, Hoff CM, Holmes CJ, West-Mays JA, et al. Transient overexpression of TGF-β1 induces epithelial mesenchymal transition in the rodent peritoneum. J Am Soc Nephrol 2005; 16:425–36 [DOI] [PubMed] [Google Scholar]
- 34. Pepper MS. Role of the matrix metalloproteinase and plasminogen activator-plasmin systems in angiogenesis. Arterioscler Thromb Vasc Biol 2001; 21:1104–17 [DOI] [PubMed] [Google Scholar]
- 35. Parikova A, Smit W, Struijk DG, Krediet RT. Analysis of fluid transport pathways and their determinants in peritoneal dialysis patients with ultrafiltration failure. Kidney Int 2006; 70:1988–94 [DOI] [PubMed] [Google Scholar]
- 36. Parikova A, Smit W, Zweers MM, Struijk DG, Krediet RT. Free water transport, small pore transport and the osmotic pressure gradient. Nephrol Dial Transplant 2008; 23:2350–5 [DOI] [PubMed] [Google Scholar]
- 37. Zemel D, Koomen GC, Hart AA, ten Berge IJ, Struijk DG, Krediet RT. Relationship of TNF-alpha, interleukin-6, and prostaglandins to peritoneal permeability for macromolecules during longitudinal follow-up of peritonitis in continuous ambulatory peritoneal dialysis. J Lab Clin Med 1993; 122:686–96 [PubMed] [Google Scholar]
- 38. Rodrigues AS, Martins M, Korevaar JC, Silva S, Oliveira JC, Cabrita A, et al. Evaluation of peritoneal transport and membrane status in peritoneal dialysis: focus on incident fast transporters. Am J Nephrol 2007; 27:84–91 [DOI] [PubMed] [Google Scholar]
- 39. Mushahar L, Lambie M, Tan K, John B, Davies SJ. Long-term changes in solute and water transport. Contrib Nephrol 2009; 163:15–21 [DOI] [PubMed] [Google Scholar]
- 40. Krediet RT, Zweers MM, van Westrhenen R, Zegwaard A, Struijk DG. Effects of reducing the lactate and glucose content of PD solutions on the peritoneum. Is the future GLAD? NDT Plus 2008; 1(Suppl 4):iv56–62 [DOI] [PMC free article] [PubMed] [Google Scholar]