Abstract
Electrophysiological studies indicate that cat visual cortical critical period neuronal plasticity peaks around 5 weeks and largely disappears by 20 weeks. Dark rearing slows this time course. Normal cats are more plastic than dark reared cats at 5 weeks but the opposite is true at 20 weeks. Thus, a stringent criterion for identifying genes controlling neuronal plasticity is that normal and dark rearing produce opposite direction differences in expression between young and older animals. Differential display PCR identified Abelson interacting protein 2 (Abi-2) as a candidate plasticity gene regulated according to this criterion. Western blotting showed bidirectional regulation of Abi-2 protein levels in cats and mice that was specific to visual cortex and did not occur in frontal cortex. Immunohistochemistry indicated developmental changes in Abi-2 laminar expression in cat visual cortex. Dark rearing altered laminar expression such that at 5 weeks dark reared cats were similar to 1 week normally reared cats and at 20 weeks, dark reared cats were similar to 5–10 week normally reared animals. The effect of dark rearing on both Abi-2 expression levels and laminar expression patterns was to slow the normal developmental process, the same effect seen on physiologically assessed plasticity in visual cortex.
Index Entries: Visual Deprivation, Visual Development, differential display PCR, Neuronal Plasticity
Introduction
Neonatal visual cortex is a highly plastic structure and its development is guided by visual experience. The clearest example of environmental effects on visual cortical development is rearing animals with one eye sutured closed. This monocular deprivation (MD), leads to dramatic physiological alterations in favor of the open eye (Daw 2006, for review). In normal development of cat visual cortex, sensitivity to MD is limited to a “critical period,” which begins about three weeks after birth, is maximal at 5–6 weeks, declines to low levels by 20 weeks and is absent by 1 year of age (Daw 2006).
Rearing in total darkness from birth maintains many properties of the neonatal visual cortex in cats (Imbert and Buisseret 1975; Mower 1991). Dark reared visual cortical neurons show abnormally low responsiveness, rapid response habituation and little selectivity for the orientation and direction of movement of a visual stimulus compared to normally reared animals. Exposure to the visual environment after prolonged dark rearing promotes normal neuronal response properties in cat visual cortical neurons and more importantly, reveals extension of the critical period for MD far beyond its normal age limit (Cynader and Mitchell 1980; Mower et al. 1981). Mice, which allow mechanistic gene manipulation analysis, also show a visual cortical critical period (Fagiolini et al. 1994; Gordon and Stryker 1996; Guire et al. 1999) as well as prolongation of the critical period by dark rearing (Fagiolini et al. 2003).
Electrophysiological results indicate that dark rearing slows the time course of the entire critical period for susceptibility to MD. At the peak of the critical period (5 weeks) normal cats are more plastic than dark reared, but at later ages (20 weeks) dark reared cats are more plastic (Mower 1991, Beaver et al. 2001). This bidirectional regulation of visual cortical plasticity by age and dark rearing provides a stringent criterion for identifying molecules that control plasticity in visual cortex. Important molecules should show opposite direction differences in their levels of expression between normal and dark rearing in young versus older animals.
Here, we report the identification by differential display polymerase chain reaction (ddPCR) of Abelson (Abl) interactor protein 2 (Abi-2) as a candidate gene for visual cortical plasticity which is regulated by age and dark rearing according to the above criterion. The Abi proteins were originally identified as mediators of the functions of the Abl tyrosine kinase family of proteins in actin dependent cytoskeletal reorganization (Dai and Pendergast, 1995; (Courtney et al. 2000). Recent evidence has implicated Abi-2 in cell migration, dendritic spine formation and learning and memory (Grove et al. 2004) Results presented here implicate Abi-2 in critical period plasticity of visual cortex. The level of Abi-2 protein expression is elevated in normal cats and mice at the peak of the critical period but at the nadir of the critical period in dark reared animals. The laminar distribution of Abi-2 protein expression in cat visual cortex shows correlated differences between granular and extragranular layers.
Materials and methods
Animals
All procedures in cats and mice conformed to the guidelines of the National Institutes of Health and were approved by the University of Louisville Institutional Animal Care and Use Committee. Cats and mice were killed by an overdose of sodium pentobarbital prior to tissue dissection (75 mg/kg, intraperitoneal injection). Fresh tissue samples from cats were used for differential display PCR (ddPCR), cloning, sequencing, reverse transcription PCR and western blotting. Pregnant female cats were purchased from Liberty Research, Inc. (Waverly, NY, USA) and kittens were reared in a normal 12 hour light/dark (N) cycle or in complete darkness from birth to 5 or 20 weeks of age (D). Three animals were used for each of these four rearing/age conditions (N5, D5, N20, D20, total: 12 cats). Visual cortex (all of Area 17 and possibly a small part of 18) and frontal cortex (the anterior quarter of the cerebral hemisphere) were dissected. These fresh tissue samples were immediately frozen on crushed dry ice and stored at −80°C until used for extraction of total RNA and protein.
Mice were used for western blot analysis of Abi-2 expression. They were purchased from The Jackson Laboratory (Bar Harbour, ME, USA) and pups were reared in a normal 12 hour light/dark cycle or in complete darkness from birth to 3.5 or 9.5 weeks of age. These ages were based on previous studies of the time course of susceptibility to MD in mouse visual cortex (Gordon and Stryker 1996, Guire et al. 1999, Sawtell et al. 2003). Three independent groups of mice including all four ages and rearing conditions (N3.5, D3.5, N9.5, D9.5) were raised (12 animals in each group, 36 total mice). Within each group, three animals were pooled for each rearing/age condition to provide sufficient tissue and reduce individual variability. Visual cortex (monocular and binocular regions) and frontal cortex (anterior quarter of cortex) were dissected, immediately frozen on crushed dry ice, and stored at −80°C until used. Additional normally reared mice were identically processed for systematic assessment of changes in Abi-2 expression level throughout postnatal life (1, 2, 6.5 weeks and adult, n=3 at each age).
Paraformaldehyde fixed cat tissues were used for immunohistochemistry. They were reared in a normal 12 hour light/dark cycle until 1 (n=2), 5 (n=3), 10 (n=2), 20 (n=3) weeks or adult (n = 2) or in complete darkness from birth to 5 or 20 weeks of age (n = 3 at each age). Cats were purchased from Liberty Research, Inc. They were raised in the Research Resource Center, University of Louisville. Cats were deeply anesthetized by an overdose of sodium pentobarbital (75 mg/kg i.p). Perfusion was performed intracardially through the left ventricle with 37°C PBS (0.9% NaCl in 0.1 M phosphate buffer, pH=7.4) until fluid from right atrium ran clear, indicating complete flushing of blood. At this point, the perfusion solution was switched to 4% paraformaldehyde in PBS at 4°C for approximately 20 minutes. Brains were removed and blocked into cerebral hemispheres divided into anterior and posterior regions. The tissues were post-fixed in 4% paraformaldehyde in PBS overnight at 4°C then cryoprotected by immersion in 30% sucrose in PBS at 4°C until they sank. The tissue samples were then frozen in crushed dry ice and stored at −80°C until use.
Differential display polymerase chain reaction (ddPCR)
RNA was extracted from cat visual cortical samples (TRIzol Reagents, Life Technologies, Grand Island, NY, USA) and its amount and integrity determined by spectroscopy. DNA contamination was removed from the RNA (MessageClean, GenHunter Corp., Nashville, TN, USA) and cDNA was synthesized (SMART, Clontech, Palo Alto, CA, USA or RNAimage, GenHunter Corp.). PCR on cDNA from each RNA sample was done using the appropriate oligo-dT-X (oligo-dT-C; dT-G; dT-A) primer and 80 arbitrary primers as provided in a commercially available kit (RNAimage, GenHunter Corp.). The ddPCR products showing bidirectional expression due to age and dark rearing were amplified in a PCR reaction using the same primers as in the initial reaction, then cloned (PCR-TRAP, GenHunter Corp.) for use in sequencing. The resultant sequences were run against gene and expressed sequence tag databases to determine similarity to known genes. 5′RACE PCR was used to generate additional sequence for the ddPCR fragment.
Reverse transcription-polymerase chain reaction (rtPCR)
A 2 μl reaction volume of Abi-2 cDNA generated above (corresponding to 200 ng of original total cDNA) was used for each subsequent 50 μl PCR reaction. The rtPCR reaction was carried out as follows: 2 min hot start at 94°C, followed by 25 cycles of 30 sec at 94°C, 30 sec at 55°C, and 40 sec at 72°C). The reaction was completed by a final amplification step at 72°C for 7 min. rt-PCR was also performed for glyceraldehyde 3-phosphate dehydrogenase (GAPDH) as a normalization control in the same solutions and at the same time as Abi-2. The specificity of the amplified products was confirmed by the sizes of the products (Abi-2: 138 bp; GAPDH: 100 bp) and also by performing PCR reactions in the absence of reverse transcribed products. Primer sequence used to amplify cat Abi-2 and GAPDH were as follows: Abi-2, 5′-TCC TGC CGC TGT TTA TTA CC-3′ (forward) and 5′-TGC CTC TCC AGC AGA AAA AT-3′ (reverse); GAPDH, 5′-GAG CTG AAT GGG AAG CTC AC-3′ (forward) and 5′-CGT ATT TGG CAG CTT TCT CC-3′ (reverse).
Western Blot Analysis
For western blots, a rabbit polyclonal antibody against amino acids 271–320 human Abi-2 (Santa Cruz Biotechnology, Inc., Santa Cruz, CA, USA) was used. Homogenates of visual and frontal cortex were prepared in the presence of a standard protease inhibitor cocktail (Sigma-Aldrich Co., St. Louis, MO, USA). Centrifugation was done to yield a crude synaptosomal fraction and equal amounts of protein (20μg) were added to each well of a 4–15% polyacrylamide SDS gel (Bio-Rad Laboratories, Inc., Hercules, CA, USA), separated by electrophoresis, and then electrophoretically transferred to a polyvinylidene fluoride membrane using a Transblot cell (Bio-Rad Laboratories, Inc.). Nonspecific binding sites were blocked with 5% non-fat milk and blots were then incubated with the primary antibody (diluted 1:1000). Blots were extensively washed and incubated with appropriate horseradish peroxidase conjugated secondary antibodies at room temperature for 2 hr. Specific protein bands were visualized by enhanced chemiluminescence (ECL) detection reagents (Amersham Biosciences, Piscataway, NJ, USA). The blots processed for ECL were then stripped and reprobed with a mouse monoclonal antibody to β-actin (Sigma-Aldrich Co.) to control for loading errors. The second antibody reaction was carried out as described above.
Quantification and Statistics
Exposed films from western blots were quantified by computerized densitometry. TIFF images of each film were obtained with an AlphaImager EP, MultiImage I (AlphaInnotech Inc., Santa Clara, CA, USA). Average pixel density of protein expression levels for Abi-2 and β-actin were calculated by AlphaView software (version 2.0.0.9) from AlphaInnotech. All densitometric measures for Abi-2 protein were corrected against β-actin. Statistical analysis included two way ANOVA and Tukey post hoc pairwise comparisons.
Immunohistochemistry
Immunohistochemistry was done on free floating 40μm sections with all steps performed on a shaker table at room temperature unless otherwise specified. Sections from all ages and rearing conditions were run simultaneously in the same solutions to ensure comparability between animals in each run. Triplicate runs were performed to ensure repeatability.
The antibody for immunohistochemical studies was a rabbit monoclonal raised against amino acids 190–220 (#3189-1, Epitomics, Burlingame, CA, USA). As confirmation of antibody specificity for Abi-2, immunohistochemistry, a second Abi-2 antibody directed at amino acids 350–380 was compared (#5397-1, Epitomics). In pilot work, several primary antibody concentrations were assessed to identify a near optimal one (1:1000 for both antibodies). The immunohistochemical protocol began with a series of three 5 minute washes in PBS. Sections were blocked with 10% normal goat serum (NGS) in PBS with 0.1% Triton X-100 for 60 min. The sequence of steps for the immunohistochemical reaction was: incubation in primary antibody diluted in PBS with 1% NGS and 0.1% Triton X-100 at 4°C overnight; treatment with 4% NGS in PBS for 45 min.; incubation in biotinylated secondary antibody (1:200 per Vector ABC Kit, Vector Laboratories, Burlingame, CA, USA) for 45 min.; three 15 min. washes with PBS; incubation in ABC Reagent (per Vector ABC Kit) for one hour; three 15 min. washes with PBS; and finally the DAB reaction (0.05% diaminobenzedine-4 HCl with 0.01% H2O2 in 0.17M Tris-HCl) per DAB kit (Vector Laboratories) for 3–5 min or until clearly visible brown reaction product appeared. Once immunostaining was complete, sections were washed three times with PBS for 15 minutes, mounted onto subbed Superfrost/Plus slides (Fisher Scientific) and air-dried overnight. The sections were then dehydrated through a sequential series of alcohols for 3 minutes each, (70%, 95%, 100%), cleared in xylenes (3 min X 2), and coverslipped with Permount (Fisher Scientific, Pittsburgh, PA, USA). Sections adjacent to those labeled by immunohistochemistry were stained with cresyl violet for determining laminar boundaries. The slides were photographed using a computerized system (SPOT software, v2.2, SPOT Diagnostic Instruments, Inc., Sterling Heights, MI, USA) on a Nikon Eclipse E400 microscope.
Results
Identification of Abi-2 as a Candidate Plasticity Gene in Cat Visual Cortex
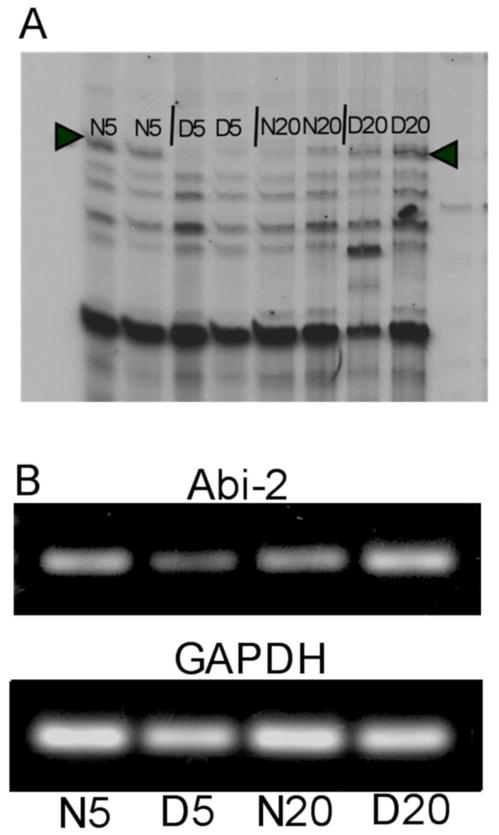
A ddPCR primer pair revealed a band that showed elevated expression in normal (N5) compared to dark reared (D5) cat visual cortex at 5 weeks and in dark reared (D20) compared to normal (N20) cat visual cortex at 20 weeks (Fig. 1A). The band was excised and cloned to generate probes for cloning and sequencing. rtPCR with primers flanking the ddPCR fragment confirmed bidirectional regulation of expression due to age and dark rearing (Fig. 1B). Densitometric analysis, corrected against GAPDH, indicated a 1.8 fold increase in expression in N5 compared to D5 and a 2.2 fold increase in D20 compared to N20 cat visual cortex.
Figure 1.
A. Portion of a sequencing gel showing a ddPCR product (arrowheads) which is expressed more highly at 5 weeks in normal (N5) than dark reared (D5) cat visual cortex and more highly in dark reared (D20) than normal (N20) cat visual cortex at 20 weeks. cDNA samples from two different animals at each rearing/age condition were run together (8 lanes) to help eliminate false positives. B. rtPCR confirming differential expression of the ddPCR fragment. Total visual cortical cDNA from cats not used in the original ddPCR assay in each of the four rearing/age conditions was used in PCR reactions for Abi-2 and GAPDH.
Sequencing established the identity of the bidirectionally regulated gene. The 442 bp ddPCR fragment showed 84% identity with the 3′ end of human Abi-2. 5′ RACE was done to extend the sequence to 1720 bases of the cat gene (GenBank: EU661872.1). Blast search of this sequence indicated a match exclusively with the human Abi-2 gene on chromosome 2.
Bidirectional Regulation of Abi-2 Protein in Cat and Mouse Visual Cortex
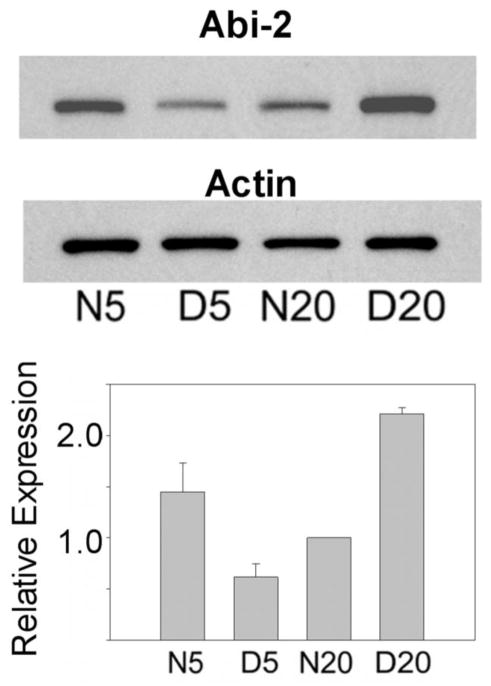
Western blots were done on cat and mouse visual cortex samples to extend the mRNA results to protein. Figure 2 shows western blot and densitometric analysis of Abi-2 protein of the visual cortex of cats at the peak (5 weeks) and the nadir (20 weeks) of the critical period. Analysis of variance showed a significant interaction in cats (F[1,8], p<.001), indicating that the effect of dark rearing depended on age. Abi-2 protein was significantly elevated (Tukey tests, p<.001) in normal compared to dark reared visual cortex at 5 weeks (2.4 fold) and in dark reared compared to normal visual cortex at 20 weeks (2.2 fold). In normal cat development, visual cortical Abi-2 decreased by 33 percent from 5 to 20 weeks.
Figure 2.
Top. Western blots showing levels of Abi-2 and actin protein expression in 5 week normal and dark reared (N5, D5) and 20 week normal and dark reared (N20, D20) cat visual cortex. The same blot was stripped and reprobed with the actin antibody. Bottom. Mean +/− S.E. of protein expression as determined by densitometry (corrected against actin to correct for loading errors) from three independent groups of cats are plotted for each age/rearing condition. Data from each group were normalized against N20 animals.
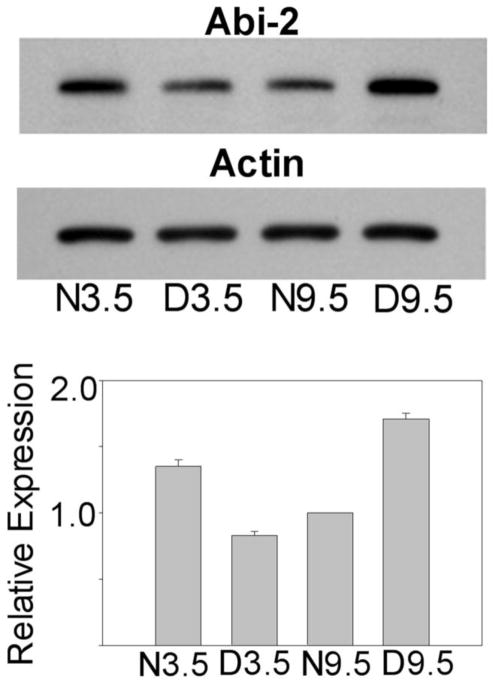
Figure 3 presents western blot and densitometric analysis of visual cortical Abi-2 expression level in normal and dark reared mice at the peak (3.5 weeks: N3.5, D3.5) and nadir (9.5 weeks: N9.5, D9.5) of the critical period. As in cats, analysis of variance showed a significant interaction in mice (F[1,8], p<.001), indicating that the effect of dark rearing depended on age. Abi-2 was significantly elevated (Tukey tests, p<.001) in N3.5 compared to D3.5 mouse visual cortex (1.6 fold) and elevated in D9.5 compared to N9.5 mice (1.7 fold). In normal development, Abi-2 decreased 28 percent from 3.5 to 9.5 weeks of age.
Figure 3.
Top. Western blots showing levels of Abi-2 and actin protein expression in 3.5 week normal and dark reared (N3.5, D3.5) and 9.5 week normal and dark reared (N9.5, D9.5) mouse visual cortex. The same blot was stripped and reprobed with the actin antibody. Bottom. Mean +/− S.E. of protein expression as determined by densitometry (corrected against actin to correct for loading errors) from three independent groups of mice are plotted for each age/rearing condition. Data from each group were normalized against N9.5 animals.
To provide a more complete description of neocortical Abi-2 expression throughout normal postnatal development in mice, additional ages were analyzed and visual and frontal cortex were compared (Fig. 4). Abi-2 expression increased during the rise of the critical period in visual cortex (1 – 3.5 weeks) then declined during the decline of visual cortical plasticity (3.5 weeks – adult). In frontal cortex, expression levels of Abi-2 were constant after 1 week of age.
Figure 4.
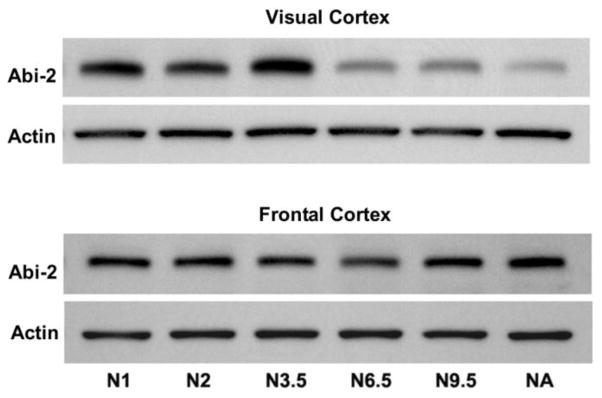
Western blots showing levels of expression of Abi-2 and actin proteins across normally reared postnatal development at 1, 2, 3.5, 6.5, 9.5 weeks and adult (18 weeks) in mouse visual (top) and frontal cortex (bottom). The same blots were stripped and reprobed for Abi-2 and actin.
Bidirectional Regulation of Abi-2 Protein Expression is Not Found in Frontal Cortex
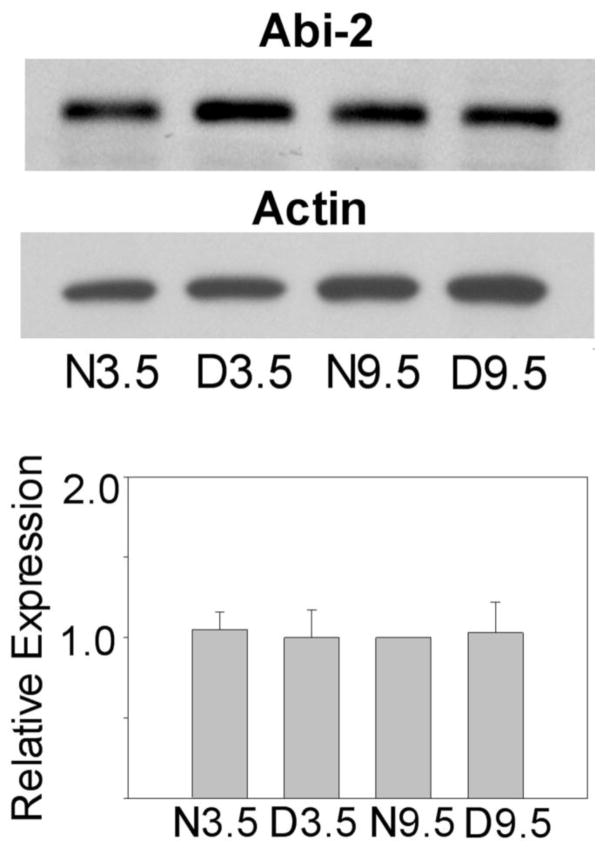
An important issue is whether the bidirectional regulation of Abi-2 by age and dark rearing is specific to visual cortex or some non-specific phenomenon throughout the cortex. If Abi-2 is important for visual cortical plasticity, bidirectional regulation of its expression by age and dark rearing should be specific to or elevated in visual cortex. To answer this, we determined the effects of age and dark rearing on Abi-2 protein expression in mouse frontal cortex, as shown in figure 5. Levels of Abi-2 expression were similar in all rearing/age conditions. Densitometric analysis and ANOVA on three independent groups of mice indicated no statistically significant differences in frontal cortex. Bidirectional regulation of Abi-2 expression due to age and dark rearing was not a generalized effect throughout neocortex.
Figure 5.
Top. Western blots showing levels of Abi-2 and actin protein expression in mouse N3.5, D3.5, N9.5 and D9.5 frontal cortex. Bottom. Mean levels of Abi-2 expression (corrected against actin) as determined by densitometry from three independent groups of mice. Means +/− S.E. are plotted. Data from each group were normalized against N9.5 animals.
Effects of Age and Dark Rearing on Laminar Expression of Abi-2 Protein in Cat Visual Cortex
Our first step in analyzing histological expression of Abi-2 protein was to establish the specificity of the antibodies. As shown in figure 6 (left panel), the rabbit monoclonal antibody to amino acids 190–220 labeled a single band of appropriate molecular weight (75 KDs). Figure 6 also compares immunohistochemical staining using that antibody (middle panel) and another rabbit monoclonal antibody directed at amino acids 350–380 (right panel). Neighboring sections of visual cortex from a 5 week old normally reared cat, an age where layer IV shows reduced cellular and neuropil staining relative to superficial layer III and deep layer V, were used. The pattern of immunostaining is very similar with the two antibodies. These combined western blot and immunohistological results strongly indicate the specificity of the antibodies for Abi-2.
Figure 6.
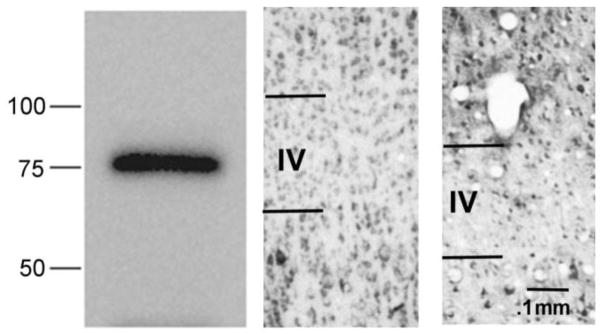
Left. Western blot showing labeling of a single appropriately sized band (approximately 75 kDa) using the Abi-2 rabbit monoclonal antibody against amino acids 190–220. Middle. Immunohistological section in cat visual cortex using the same antibody. Right. Immunohistology section using a different rabbit monoclonal antibody directed against amino acids 350–380. Calibration bar indicates magnification.
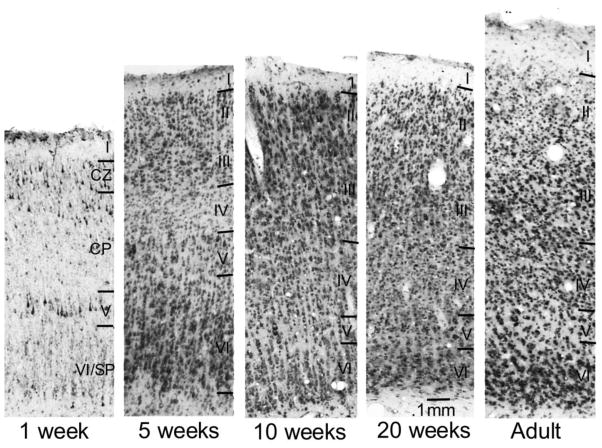
Figure 7 shows development of Abi-2 expression in normally reared cat visual cortex throughout the critical period from postnatal week 1 to adult. To interpret the immunohistochemical laminar staining pattern at 1 week, it is necessary to recognize the immature cortical layering at this age. We followed the standard laminar designations of (Luskin and Shatz, 1985a, b). In neonates (1 week), layers V and VI are identifiable and a significant number of cells in layer VI are remnants of the embryonic subplate. At this age, cells in the superficial cortical plate (CP) are destined for deep layer III in the adult and cells in the deep cortical plate are destined to become layer IV. The remaining cells that will form layers II and the rest of layer III are densely packed in the compact zone (CZ). Layer I, which corresponds to the embryonic marginal zone (MZ) is also identifiable. At 1 week of age, cellular staining is densest in three strata: deep layer VI/subplate, layer V, and the compact zone/superficial cortical plate. Neuropil staining is evident only in layers V and VI/subplate.
Figure 7.
Low magnification photomicrographs showing Abi-2 immunoreactivity in cat visual cortex during postnatal development. Representative coronal sections of area 17 in normally reared 1, 5, 10, 20 week and adult cats are shown. All ages were processed at the same time and in the same solutions. Cortical layers were identified and labeled using cresyl violet staining of adjacent sections to those processed for Abi-2 immunohistochemistry. Calibration bar indicates magnification.
As the cortex develops postnatally, there are dramatic laminar differences in Abi-2 expression. By five weeks of age, when the mature lamination pattern is attained, cellular staining is prominent in all layers but fainter in layers II and IV. Neuropil staining is densest in layers III, V, VI and faint in layers I, II and IV at this age. At 10 weeks of age, there is an increase primarily in neuropil staining in layers I – III and layer IV continues to show lighter combined cellular and neuropil staining than superficial and deep layers. At 20 weeks, cellular and neuropil staining are nearly uniform across cortical layers but still detectably lower in layer IV. In adult cats, staining is uniform across cortical laminae.
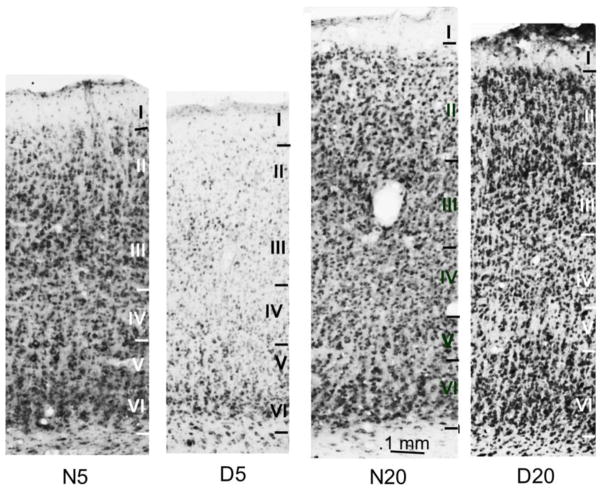
Dark rearing altered the time course of maturation of the laminar expression pattern of Abi-2 as shown in figure 8. In 5 week dark reared visual cortex, cellular and neuropil staining are lightest in layers I, II and IV. Cellular staining is densest in layers III, V, VI and neuropil staining is largely confined to layers V, VI. The staining pattern in 5 week dark reared visual cortex is far more similar to the pattern seen in 1 week than 5 week normally reared visual cortex. At 20 weeks, neuropil and cellular staining is elevated in superficial (II, III) and deep (V, VI) layers of dark reared compared to normal visual cortex but comparable in layer IV. The staining pattern in 20 week dark reared visual cortex is more similar to that seen in 5–10 week than 20 week normally reared visual cortex. The effect of dark rearing on the developmental changes in laminar expression pattern appears to be to slow the entire process throughout the critical period.
Figure 8.
Low magnification photomicrographs showing Abi-2 immunoreactivity in cat visual cortex. Coronal sections of Area 17 were processed for immunohistochemistry at the same time and in the same solutions in normal and dark reared cats at the peak (5 weeks: N5, D5) and nadir (20 weeks: N20, D20) of the critical period. Cortical layers are indicated and were determined from adjacent sections stained with cresyl violet. Calibration bar indicates magnification.
Discussion
Abi-2: a Candidate Visual Cortical Plasticity Gene
The present ddPCR gene screening identified a novel candidate gene, Abi-2, as a candidate for a role in critical period neuronal plasticity of the visual cortex. Western blot analysis confirmed that Abi-2 protein was elevated in normal compared to dark reared cat visual cortex at 5 weeks and elevated in dark reared cat visual cortex at 20 weeks. The effects of age and dark rearing on Abi-2 expression, therefore, matched their bidirectional effects on physiological plasticity in visual cortex, as assessed by monocular deprivation. Abi-2 showed similar bidirectional regulation due to age and dark rearing in cat and mouse visual cortex and this effect did not occur in frontal cortex. These combined results implicate Abi-2 as a candidate molecule for controlling neuronal plasticity during the visual cortical critical period.
Analysis of the laminar pattern of expression of Abi-2 protein provided further evidence for a role of this protein in visual cortical plasticity. The physiological effects of MD were classically thought to result from expansion of open eye thalamocortical afferents and retraction of closed eye thalamocortical afferents to ocular dominance columns in layer IV (Hubel et al. 1977, Shatz and Stryker 1978, LeVay et al. 1980, Antonini and Stryker 1993). Subsequent literature has led to a reassessment of the role of anatomical changes in layer IV ocular dominance territory in visual cortical plasticity. Studies of susceptibility to MD in cats dark reared from birth to the end of the normal critical period (Mower et al. 1985) and of residual plasticity in visual cortex of mature normally reared cats (Daw et al. 1992) indicated dramatic physiological ocular dominance changes in the extragranular layers without significant alterations in layer IV. Moreover, the initial effect of MD was shown to occur in cells located in extragranular layers, prior to physiological effects within layer IV (Trachtenberg et al. 2000). In normal development, plasticity in response to monocular deprivation first appears in extragranular layers during the rise of the critical period, is evident in layer IV subsequently, and persists longer in extragranular layers during the decline of the critical period. Dark rearing selectively prolongs plasticity in extragranular layers. Because these laminar differences in plasticity have been described in cats, we focused our immunohistochemical studies on cat visual cortex. In rodents, geniculocortical afferents are widespread across superficial and deep layers as well as layer IV and there are no ocular dominance columns (Antonini and Stryker 1993). The present immunohistochemical results for laminar expression of Abi-2 protein in cats indicate that in normal development during the rise of plasticity, Abi-2 is most intense in extragranular layers until about 20 weeks and uniform across cortical layers by adulthood. The effect of dark rearing is to slow the time course of these postnatal developmental changes in laminar expression such that 5 week dark reared visual cortex is similar to 1 week normal visual cortex and 20 week dark reared visual cortex shows enhanced staining in superficial and deep layers, similar to 5–10 week normal visual cortex. Dark rearing slows the time course of normal developmental changes in laminar expression pattern of Abi-2, the same effect it has on physiologically assessed critical period neuronal plasticity (Mower 1991, Beaver et al. 2001).
Abi-2 in Nervous System Development and Plasticity
Abi-2 was originally identified as a regulator of the oncogenic activity of the Abl tyrosine kinase. Abi-2 is a target of Abl tyrosine kinases and is required for regulation of the pathway linking Abl tyrosine kinase with the downstream Rac GTPase. This pathway is involved in reorganization of the actin cytoskeleton (Dai and Pendergast, 1995). Developmental studies of Abi-2 expression level and cellular localization indicate that in prenatal development, Abi-2 expression is elevated in the central and peripheral nervous system. In postnatal brain, it is most highly expressed in neocortical projection neurons (Courtney et al. 2000). Cytochemically, Abi-2 is concentrated in cell bodies, neuropil, synaptosomes and growth cones. Abi-2 has been implicated in neuronal morphogenesis and migration. Mutant mice with a deletion of Abi-2 show pockets of abnormally migrated neurons in cortex and hippocampus (Grove et al. 2004). Normally, developing neurons rely in an interaction between growth cones and radial glia which triggers a transition from multipolar to bipolar neuronal morphology and initiates glia guided migration. Abi-2 drives this process and interference with this growth cone activity results in the abnormally superficial cell migration in neocortex (Xie et al. 2012). Abi-2 has also been implicated in postnatal synaptic plasticity related processes. Mutation of Abi-2 results in decreased density and abnormal morphology of dendritic spines in hippocampus and neocortex. Behaviorally, these mutants show severe deficits in short- and long-term memory (Grove et al. 2004). The present results implicate Abi-2 and the Abl/Rac pathway in the postnatal critical period in visual cortex and provide the foundation for mechanistic studies of the role of Abi-2 in ocular dominance plasticity in mutant mice.
Acknowledgments
This work was supported by NIH R01 016724.
References
- Antonini A, Stryker MP. Rapid remodeling of axonal arbors in the visual cortex. Science. 1993;260:1819–1821. doi: 10.1126/science.8511592. [DOI] [PubMed] [Google Scholar]
- Beaver CJ, Ji Q, Daw NW. Layer differences in the effect of monocular vision in light- and dark-reared kittens. Vis Neurosci. 2001;18:811–820. doi: 10.1017/s0952523801185147. [DOI] [PubMed] [Google Scholar]
- Courtney KD, Grove M, Vandongen H, Vandongen A, LaMantia AS, Pendergast AM. Localization and phosphorylation of Abl-interactor proteins, Abi-1 and Abi-2, in the developing nervous system. Mol Cell Neurosci. 2000;16:244–257. doi: 10.1006/mcne.2000.0865. [DOI] [PubMed] [Google Scholar]
- Cynader M, Mitchell DE. Prolonged sensitivity to monocular deprivation in dark-reared cats. J Neurophysiol. 1980;43:1026–1040. doi: 10.1152/jn.1980.43.4.1026. [DOI] [PubMed] [Google Scholar]
- Dai Z, Pendergast AM. Abi-2, a novel SH3-containing protein interacts with the c-Abl tyrosine kinase and modulates c-Abl transforming activity. Genes Dev. 1995;9:2569–2582. doi: 10.1101/gad.9.21.2569. [DOI] [PubMed] [Google Scholar]
- Daw NW. Visual Development. New York, NY: Springer Science+Business Media, Inc; 2006. [Google Scholar]
- Daw NW, Fox K, Sato H, Czepita D. Critical period for monocular deprivation in the cat visual cortex. J Neurophysiol. 1992;67:197–202. doi: 10.1152/jn.1992.67.1.197. [DOI] [PubMed] [Google Scholar]
- Fagiolini M, Katagiri H, Miyamoto H, Mori H, Grant SG, Mishina M, Hensch TK. Separable features of visual cortical plasticity revealed by N-methyl-D-aspartate receptor 2A signaling. Proc Natl Acad Sci U S A. 2003;100:2854–2859. doi: 10.1073/pnas.0536089100. [DOI] [PMC free article] [PubMed] [Google Scholar]
- Fagiolini M, Pizzorusso T, Berardi N, Domenici L, Maffei L. Functional postnatal development of the rat primary visual cortex and the role of visual experience: dark rearing and monocular deprivation. Vision Res. 1994;34:709–720. doi: 10.1016/0042-6989(94)90210-0. [DOI] [PubMed] [Google Scholar]
- Gordon JA, Stryker MP. Experience-dependent plasticity of binocular responses in the primary visual cortex of the mouse. J Neurosci. 1996;16:3274–3286. doi: 10.1523/JNEUROSCI.16-10-03274.1996. [DOI] [PMC free article] [PubMed] [Google Scholar]
- Grove M, Demyanenko G, Echarri A, Zipfel PA, Quiroz ME, Rodriguiz RM, Playford M, Martensen SA, Robinson MR, Wetsel WC, Maness PF, Pendergast AM. ABI2-deficient mice exhibit defective cell migration, aberrant dendritic spine morphogenesis, and deficits in learning and memory. Mol Cell Biol. 2004;24:10905–10922. doi: 10.1128/MCB.24.24.10905-10922.2004. [DOI] [PMC free article] [PubMed] [Google Scholar]
- Guire ES, Lickey ME, Gordon B. Critical period for the monocular deprivation effect in rats: assessment with sweep visually evoked potentials. J Neurophysiol. 1999;81:121–128. doi: 10.1152/jn.1999.81.1.121. [DOI] [PubMed] [Google Scholar]
- Hubel DH, Wiesel TN, LeVay S. Plasticity of ocular dominance columns in monkey striate cortex. Philos Trans R Soc Lond B Biol Sci. 1977;278:377–409. doi: 10.1098/rstb.1977.0050. [DOI] [PubMed] [Google Scholar]
- Imbert M, Buisseret P. Receptive field characteristics and plastic properties of visual cortical cells in kittens reared with or without visual experience. Exp Brain Res. 1975;22:25–36. doi: 10.1007/BF00235409. [DOI] [PubMed] [Google Scholar]
- LeVay S, Wiesel TN, Hubel DH. The development of ocular dominance columns in normal and visually deprived monkeys. J Comp Neurol. 1980;191:1–51. doi: 10.1002/cne.901910102. [DOI] [PubMed] [Google Scholar]
- Luskin MB, Shatz CJ. Neurogenesis of the cat’s primary visual cortex. J Comp Neurol. 1985a;242:611–631. doi: 10.1002/cne.902420409. [DOI] [PubMed] [Google Scholar]
- Luskin MB, Shatz CJ. Studies of the earliest generated cells of the cat’s visual cortex: cogeneration of subplate and marginal zones. J Neurosci. 1985b;5:1062–1075. doi: 10.1523/JNEUROSCI.05-04-01062.1985. [DOI] [PMC free article] [PubMed] [Google Scholar]
- Mower GD. The effect of dark rearing on the time course of the critical period in cat visual cortex. Brain Res Dev Brain Res. 1991;58:151–158. doi: 10.1016/0165-3806(91)90001-y. [DOI] [PubMed] [Google Scholar]
- Mower GD, Berry D, Burchfiel JL, Duffy FH. Comparison of the effects of dark rearing and binocular suture on development and plasticity of cat visual cortex. Brain Res. 1981;220:255–267. doi: 10.1016/0006-8993(81)91216-6. [DOI] [PubMed] [Google Scholar]
- Mower GD, Caplan CJ, Christen WG, Duffy FH. Dark rearing prolongs physiological but not anatomical plasticity of the cat visual cortex. J Comp Neurol. 1985;235:448–466. doi: 10.1002/cne.902350404. [DOI] [PubMed] [Google Scholar]
- Sawtell NB, Frenkel MY, Philpot BD, Nakazawa K, Tonegawa S, Bear MF. NMDA receptor-dependent ocular dominance plasticity in adult visual cortex. Neuron. 2003;38:977–985. doi: 10.1016/s0896-6273(03)00323-4. [DOI] [PubMed] [Google Scholar]
- Shatz CJ, Stryker MP. Ocular dominance in layer IV of the cat’s visual cortex and the effects of monocular deprivation. J Physiol. 1978;281:267–283. doi: 10.1113/jphysiol.1978.sp012421. [DOI] [PMC free article] [PubMed] [Google Scholar]
- Trachtenberg JT, Trepel C, Stryker MP. Rapid extragranular plasticity in the absence of thalamocortical plasticity in the developing primary visual cortex. Science. 2000;287:2029–2032. doi: 10.1126/science.287.5460.2029. [DOI] [PMC free article] [PubMed] [Google Scholar]
- Xie MJ, Yagi H, Kuroda K, Wang CC, Komada M, Zhao H, Sakakibara A, Miyata T, Nagata KI, Oka Y, Iguchi T, Sato M. WAVE2-Abi2 Complex Controls Growth Cone Activity and Regulates the Multipolar-Bipolar Transition as well as the Initiation of Glia-Guided Migration. Cereb Cortex. 2012 doi: 10.1093/cercor/bhs123. [Epub ahead of print] [DOI] [PubMed] [Google Scholar]


