

Summary
The Clock mutation lengthens periodicity and reduces amplitude of circadian rhythms in mice. The effects of Clock are cell intrinsic and can be observed at the level of single neurons in the suprachiasmatic nucleus. To address how cells of contrasting genotype functionally interact in vivo to control circadian behavior, we have analyzed a series of Clock mutant mouse aggregation chimeras. Circadian behavior in Clock/ Clock + wild-type chimeric individuals was determined by the proportion of mutant versus normal cells. Significantly, a number of intermediate phenotypes, including Clock/+ phenocopies and novel combinations of the parental behavioral characteristics, were seen in balanced chimeras. Multivariate statistical techniques were used to quantitatively analyze relationships among circadian period, amplitude, and suprachiasmatic nucleus composition. Together, our results demonstrate that complex integration of cellular phenotypes determines the generation and expression of coherent circadian rhythms at the organismal level.
Introduction
The circadian organization of locomotor behavior in mammals is governed by the suprachiasmatic nuclei (SCN), a defined pair of cell clusters in the anteroventral hypothalamus (Klein et al., 1991). As the master circadian pacemaker, the SCN controls the period of the overt activity rhythm (Ralph et al., 1990). In vitro studies have shown that circadian periodicity is an intrinsic property of individual cells in the SCN (Welsh et al., 1995; Herzog et al., 1997, 1998; Liu et al., 1997; Honma et al., 1998). It is not known, however, which of these oscillatory cells actually function as essential pacemakers, determining fundamental circadian parameters of output rhythms. Although considerable progress has been made in understanding the molecular and electrophysiological basis of single-cell circadian oscillators within the SCN, it is still not clear how these intracellular circadian phenomena are incorporated into a multioscillator pacemaking system that controls coherent rhythms in the behavior of the whole animal.
We used mouse aggregation chimeras to probe the functional organization of the SCN. Chimera analysis in mice is one example of a “confrontation analysis”, in which cells of contrasting genotype are juxtaposed in vivo to observe how they interact (Sidman, 1982). Confrontation analysis has been applied to study the physiology behind circadian behavior in the form of SCN tissue transplantation, using the tau mutation, to show that the circadian period of activity rhythms always reflects the genotype of the SCN (Ralph et al., 1990). Furthermore, when SCN tissue of a contrasting tau genotype was introduced into hamsters with disrupted SCN function, behavior was organized into two concurrent but distinct circadian rhythmic components that did not interact (Vogelbaum and Menaker, 1992; Hurd et al., 1995). An intricate network of connections and feedback underlies the generation and expression of circadian locomotor behavior. Mouse chimeras are genetic composites, each containing a unique mixture of cells derived from more than one zygote. In chimeras, in contrast to SCN transplant models, intercellular connections, projections to and from other brain regions, and neural connectivity to centers controlling locomotor output are preserved.
We generated chimeras by pairing wild-type (WT) embryos with Clock mutant embryos. Identified in an ENU mutagenesis screen, the Clock mutant mouse exhibits robust and specific alterations in circadian rhythmic behavior (Vitaterna et al., 1994). The semidominant Clock mutation causes a lengthening in period, a decrease in amplitude (or strength) of the circadian rhythm, and an exaggerated response to resetting stimuli (Vitaterna et al., 1994; Challet et al., 2000). These effects of the Clock mutation on period and amplitude are expressed at the level of individually oscillating SCN cells in vitro (Herzog et al., 1998). The point mutation in the basic-helix-loop-helix-PAS CLOCK protein (King et al., 1997b) compromises its transcriptional activity (Gekakis et al., 1998), interfering with a circadian molecular feedback loop sustained in cells within the SCN (reviewed by King and Takahashi, 2000). We describe the use of this unique behavioral mutant as a tool to genetically dissect circadian function at a cellular level in vivo.
Our study covered a wide range of behavioral output produced by the interactions among a population of cellular oscillators in the SCN. Specifically, we wanted to test whether the influence of either WT or Clock mutant cells always predominates in the behavioral phenotype of chimeras. If not, do the relative proportions of cells of the two genotypes determine circadian behavior, and is the dose relationship linear? Is there behavioral evidence for interaction between the two cell genotypes? Do the circadian phenotypic traits that characterize WT versus mutant mice always covary? By analyzing the behavioral consequences of closely combining cells of contrasting Clock genotypes within the SCN, we address how the cellular composition of the SCN determines its primary circadian pacemaking function.
Results
Circadian Behavior in Control Mice
Our goal was to explore the circadian behavioral effects of combining WT and Clock mutant cells in single chimeric mice. To this end, we selected two parental mouse strains to serve as resources for WT and Clock mutant embryos: (1) a line of ROSA 26 mice, WT at the Clock locus, with a pigmented coat color, carrying a LacZ cell marker (Friedrich and Soriano, 1991), and (2) a line of albino Clock/Clock mice that lacked a cell marker (Figure 1). The protocol for production and testing of Clock/ Clock + WT (Clock/Clock) chimeras is illustrated in Figure 1A. Clock mutant and WT mice differ in three specific quantitative measures of circadian pacemaker function expressed in wheel-running behavior: circadian period, amplitude, and phase-shift responses to light (Table 1; Figure 1B). The average free-running circadian period of control WT mice is about 23.7 hr, whereas Clock heterozygotes exhibit about 24.5 hr periods. Detectable periods in homozygous mutants are approximately 27–29 hr in length; however, most of the Clock homozygotes from our albino line became arrhythmic immediately upon release into constant conditions from a light-dark (LD) cycle. Circadian amplitude is high in WT mice, whereas homozygous Clock mutants show low amplitude (as measured by Fourier analysis; see Experimental Procedures). Finally, WT mice exhibit smaller phase shifts (4 hr) in response to light pulses compared to Clock heterozygotes, which exhibit phase shifts greater than 6 hr to the same stimulus.
Figure 1. Clock Chimera Genotypic Components.

(A) Construction of Clock chimeras. Crosses are performed to produce two classes of embryo that differ in coat color, Clock genotype, and presence or absence of a LacZ cell marker. Embryos of contrasting genotype are fused to form a chimeric blastocyst that develops into a chimeric mouse, identifiable by its variegated coat color. Testing of circadian behavior is followed by SCN histological analysis. The bilaterally paired SCN is indicated by yellow arrows.
(B) Component strain controls. The three genetic differences between component embryos are illustrated. Examples of pigmented and albino coat colors are shown. Examples of control SCN are also shown, in which all of the cells are either LacZ positive (blue) or LacZ negative. Activity records show examples of circadian behavioral phenotypes for both component genotypes (WT and Clock/Clock), as well as a Clock heterozygote genetic control (F1) for comparison. All activity records are displayed double plotted on a 24 hr scale. Days of activity recording are indicated on the vertical axis. All mice in this study were exposed to an identical lighting schedule, which is encoded by the colored bar to the left: yellow represents LD 12:12, black represents DD, yellow arrows represent CT17–23 light pulses. Fourier analyses of circadian amplitude (relative power spectral density; rPSD), applied to the 20 days interval between the two light pulses, show a clear peak at one cycle/day for the WT and Clock/+ mice, but not in the arrhythmic Clock/Clock mouse. The peaks of the X2 periodogram analyses for the same interval identify the dominant circadian periods for the WT and Clock/+ mice; the Clock/Clock activity record lacks a detectable circadian periodicity.
Table 1.
Summary Data for Experimental Chimera and Control Mice
| Phenotypic Measure |
Clock/Clock Controls |
N | AR | Clock/+ Controls | N | AR | Wilt-Type Controls |
N | AR |
|---|---|---|---|---|---|---|---|---|---|
| Period DD1A | 26.69 ± 1.32 | 21 | 48.8% | 23.94 ± 0.49 | 13 | 0.0% | 23.65 ± 0.27 | 39 | 1ia |
| Period DD1B | 27.47 ± 1.63 | 7 | 82.9% | 24.30 ± 0.47 | 12 | 7.7% | 23.72 ± 0.24 | 40 | 0.0% |
| Period DD2 | 28.17 ± 1.20 | 20 | 51.2% | 24.50 ± 0.44 | 12 | 7.7% | 23.69 ± 0.23 | 40 | 0.0% |
| Period DD3 | 28.71 ± 1.05 | 5 | 87.8% | 24.54 ± 0.49 | 12 | 7.7% | 23.76 ± 0.20 | 39 | 1ia |
| Period DD4 | 28.08 ± 1.14 | 33 | 19.5% | 24.65 ± 0.52 | 13 | 0.0% | 23.75 ± 0.27 | 40 | 0.0% |
| Period LL | 28.26 ± 3.68 | 19 | 53.7% | 26.24 ± 0.86 | 10 | 23.1% | 24.78 ± 0.60 | 38 | 2ia |
| Phase advances 1 | 10.76 | 1 | 85.4% | — | 0 | 15.4% | 0.73 ± 0.37 | 4 | 0.0% |
| Phase delays 1 | 5.72 ± 5.39 | 5 | 5.66 ± 3.70 | 11 | 3.04 ± 1.7 | 36 | |||
| Phase advances 2 | 7.38 ± 2.05 | 2 | 82.9% | 14.07 ± 0.62 | 2 | 7.7% | — | 1 | 1ia |
| Phase delays 2 | 7.13 ± 5.88 | 5 | 6.75 ± 2.87 | 10 | 2.8 ± 1.75 | 38 | |||
| Amplitude (rPSD %) DD1 | 3.01 ± 3.45 | 41 | 15.40 ± 4.84 | 13 | 17.64 ± 5.24 | 40 | |||
| Amplitude (rPSD %) DD4 | 7.02 ± 4.58 | 41 | 14.14 ± 5.4 | 13 | 16.48 ± 5.81 | 40 | |||
| Amplitude (rPSD %) LL | 2.41 ± 1.45 | 41 | 3.82 ± 4.43 | 13 | 8.68 ± 5.62 | 39 | 1ia | ||
| Phenotypic Measure |
Clock/Clock Chimeras |
N | AR |
Clock/+ Chimeras |
N | AR | Wild-Type Chimeras |
N | AR |
| Period DD1A | 23.71 ± 0.79 | 125 | 8.8% | 23.72 ± 0.22 | 44 | 0.0% | 23.75 ± 0.18 | 19 | 0.0% |
| Period DD1B | 23.78 ± 0.88 | 111 | 19.0% | 23.77 ± 0.26 | 44 | 0.0% | 23.72 ± 0.15 | 19 | 0.0% |
| Period DD2 | 24.29 ± 1.61 | 121 | 11.7% | 23.85 ± 0.27 | 44 | 0.0% | 23.64 ± 0.20 | 19 | 0.0% |
| Period DD3 | 23.79 ± 1.00 | 103 | 24.8% | 23.89 ± 0.31 | 44 | 0.0% | 23.66 ± 0.22 | 19 | 0.0% |
| Period DD4 | 24.70 ± 1.95 | 129 | 5.8% | 23.91 ± 0.33 | 44 | 0.0% | 23.57 ± 0.23 | 19 | 0.0% |
| Period LL | 25.16 ± 2.01 | 120 | 12.4% | 24.98 ± 1.33 | 41 | 6.8% | 24.91 ± 0.64 | 18 | 1ia |
| Phase advances 1 | 4.55 ± 3.72 | 17 | 20.4% | 0.68 ± 0.42 | 3 | 0.0% | — | 0 | 0.0% |
| Phase delays 1 | 5.72 ± 3.52 | 92 | 3.86 ± 3.62 | 41 | 2.23 ± 1.32 | 19 | |||
| Phase advances 2 | 6.08 ± 4.02 | 23 | 27.7% | 1.01 ± 0.78 | 3 | 0.0% | 0.60 ± 1.01 | 4 | 0.0% |
| Phase delays 2 | 4.99 ± 3.26 | 76 | 4.57 ± 2.81 | 41 | 2.73 ± 1.64 | 15 | |||
| Amplitude (rPSD %) DD1 | 12.84 ± 7.88 | 137 | 15.70 ± 4.66 | 44 | 14.27 ± 5.51 | 19 | |||
| Amplitude (rPSD %) DD4 | 12.98 ± 7.28 | 137 | 14.27 ± 5.94 | 44 | 12.92 ± 6.01 | 19 | |||
| Amplitude (rPSD %) LL | 6.01 ± 5.31 | 137 | 6.01 ± 4.99 | 44 | 6.46 ± 4.35 | 19 | |||
Format: mean ± standard deviation. N: number of cases included in the calculation, AR: cases of arrhythmicity stated as a percentage of the group total, ia: insufficient activity to measure. Total numbers in each group: Clock/Clock controls: 41; Clock/+ controls: 13; WT controls: 40; Clock/Clock chimeras: 137; Clock/+ chimeras: 44; WT chimeras: 19. Measurement intervals are described in the Experimental Procedures. Period (free-running circadian period measured by least-squares regression) and phase shift values are measured in hours. rPSD (relative power spectral density) amplitude values are percentage measures of relative spectral power at the circadian peak in a Fourier analysis. Amplitude measures are available for all cases. The magnitudes of phase shift responses to light pulses are sorted by direction of shift (phase delays are negative, phase advances are positive). Cases of arrhythmicity for phase shifts 1 and 2 are grouped.
To control for effects of strain background, we tested genetic control mice: the product of mating mice of the parental strains, in contrast to the production of chimeras by aggregating embryos from these lines (F1 Clock/+ phenotype shown in Figure 1B). Circadian behavior among genetic controls did not differ from that of component strain controls (see Experimental Procedures). Furthermore, the circadian behavior of a control population of 19 WT chimeras, produced by aggregating pairs of WT embryos, did not differ from that of normal WT mice (Table 1; Supplemental Figure S1 at http://www.cell.com/cgi/content/full/105/1/25/DC1). WT chimeras also exhibited a range of LacZ staining similar to that of the Clock/Clock chimeras (Supplemental Figure S1). These results indicated that there is no circadian behavioral consequence of either chimerism per se or of chimeric LacZ expression within the SCN.
Circadian Behavioral Phenotypes in Clock Chimeras Span a Range from WT-like to Clock Mutant-like
Here, we focus on the group of 137 Clock/Clock chimeras, which most dramatically exhibited the behavioral effects of combining mutant and WT cells into single animals. A group of 40 Clock/+ chimeras displayed effects equivalent to those of the Clock/Clock chimeras, although within the smaller range delimited by the less severe behavioral phenotype of their Clock heterozygous mutant component (Table 1; Supplemental Figure S2 on Cell website).
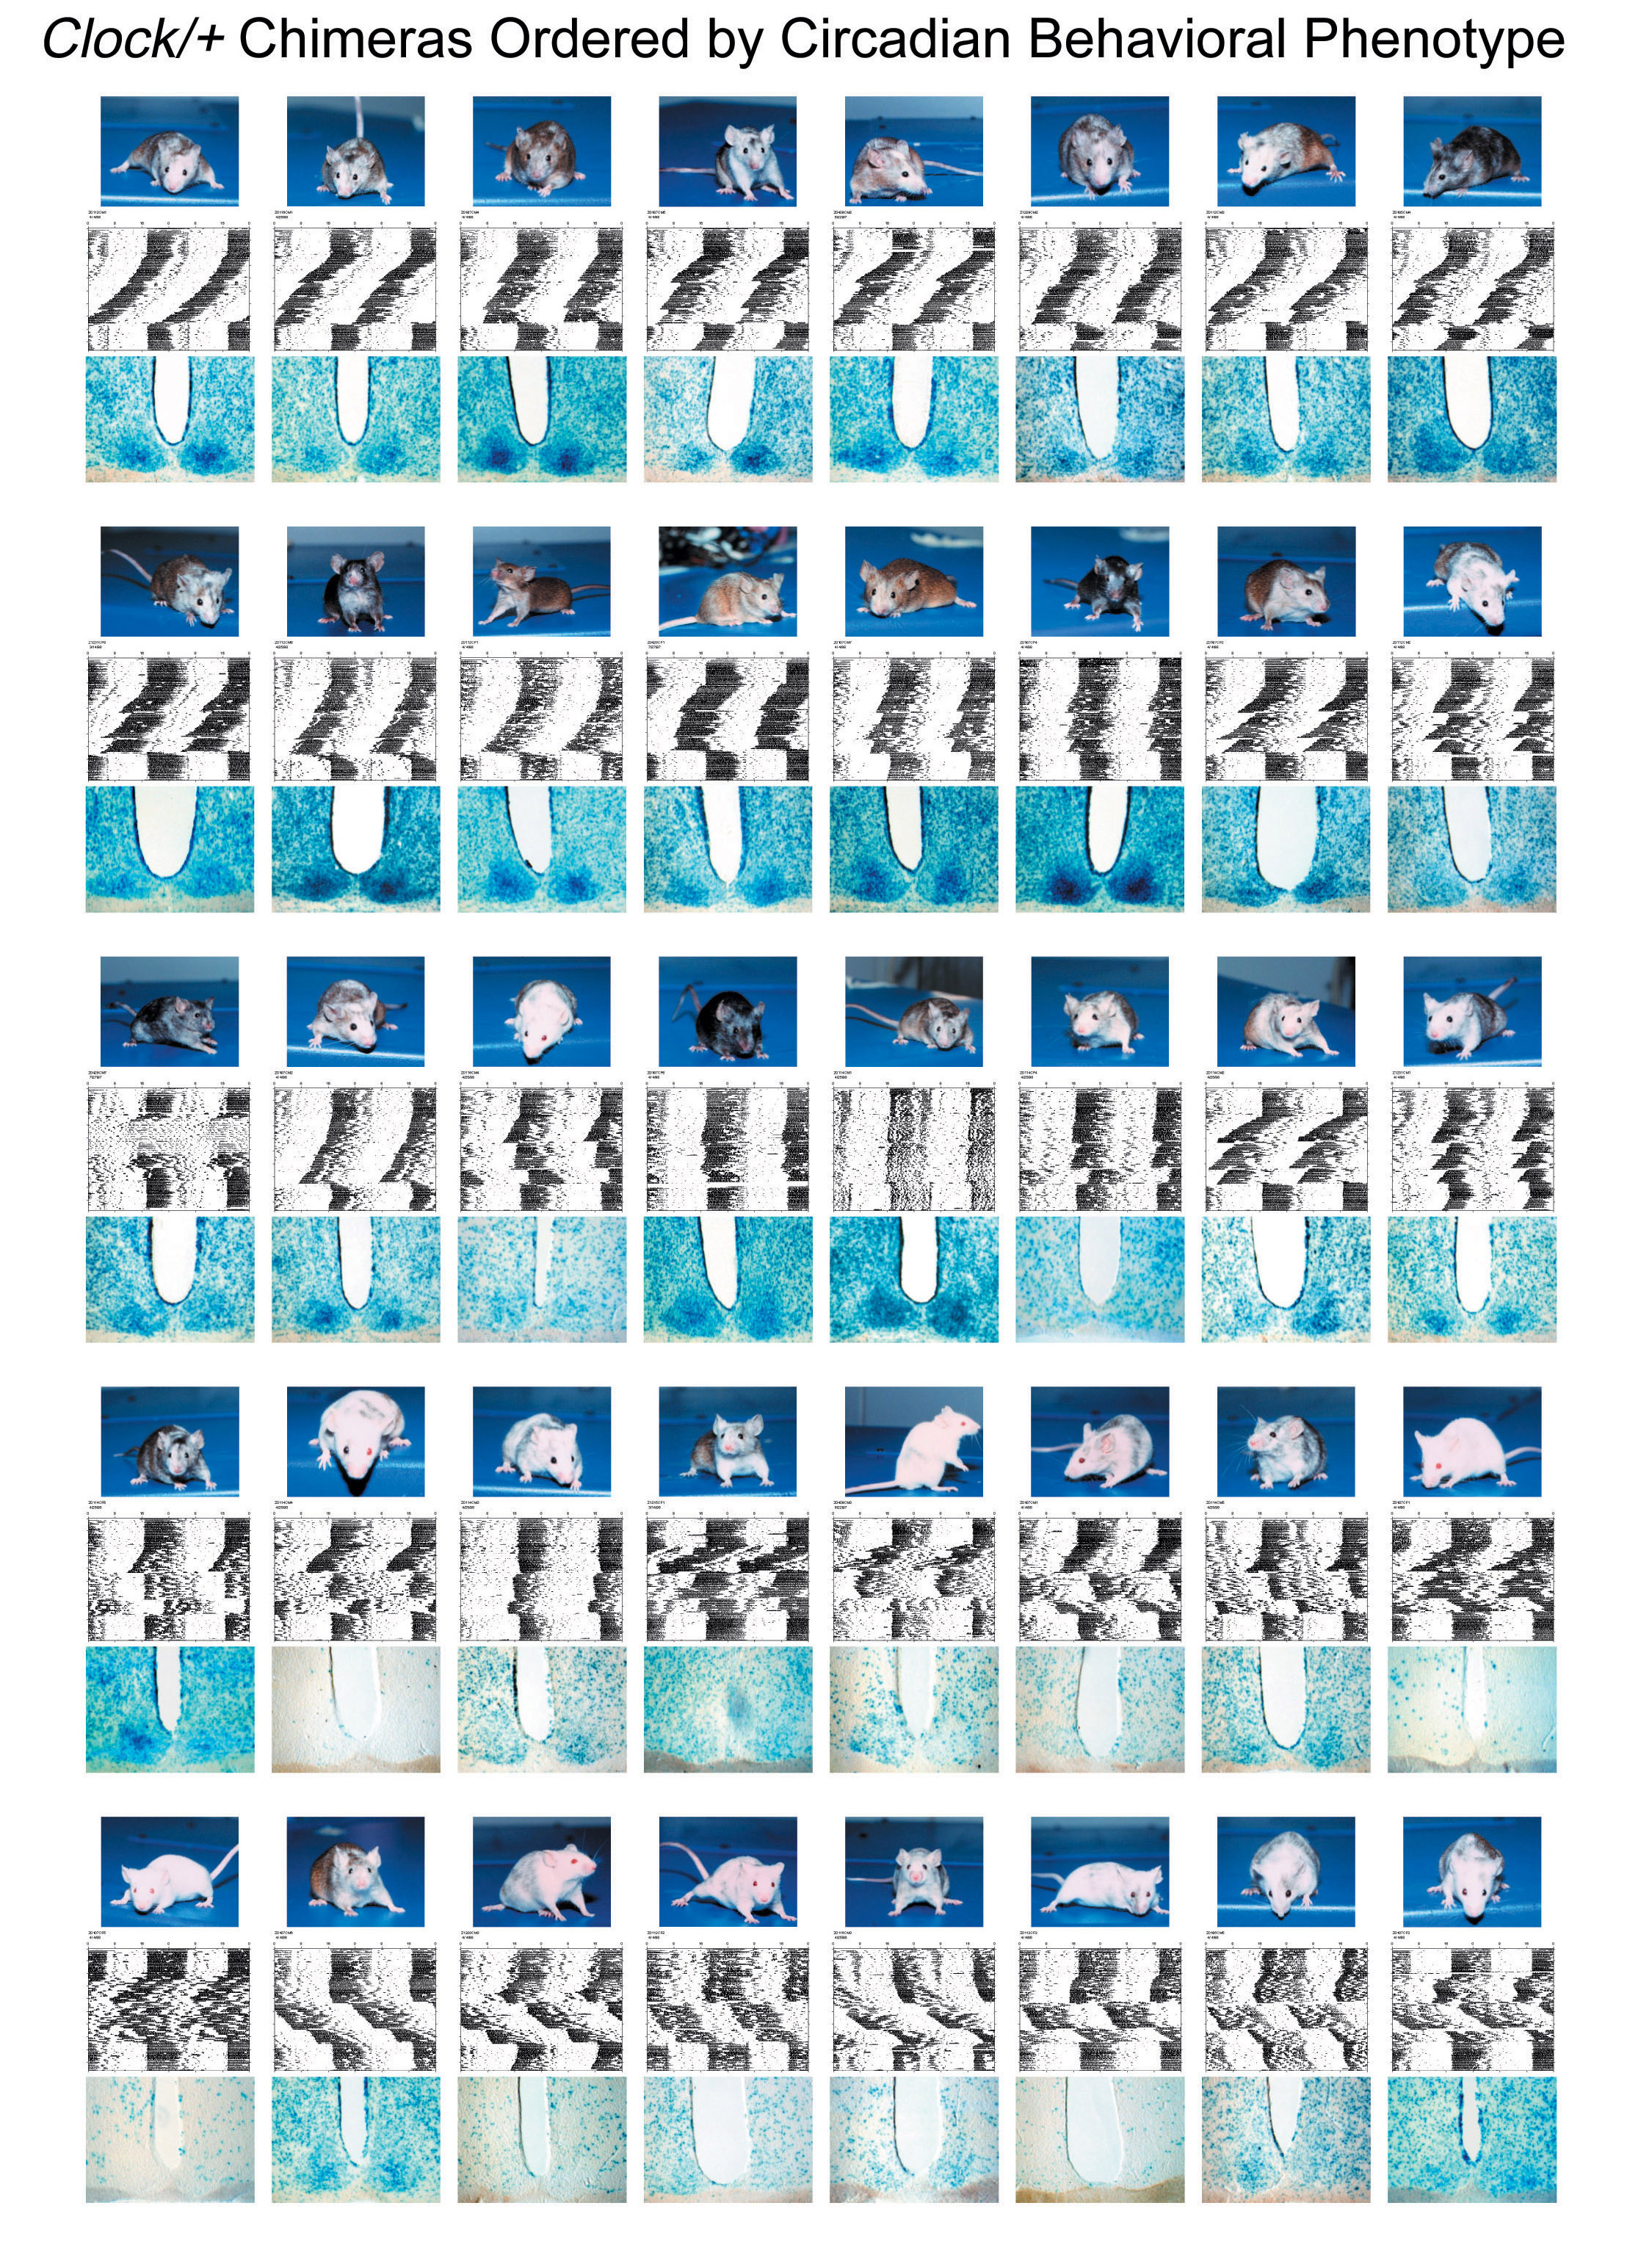
Clock mutant versus WT cell contributions varied among Clock/Clock chimeras. Three corresponding panels of mouse portraits, activity records, and representative SCN sections are shown, ordered by circadian behavior because behavioral phenotypes can be -most completely represented in this format (Figures 2 and 3; Supplemental Figures S3–S5 on Cell website). Patterns of behavior in Clock/Clock chimeras spanned a range encompassing the extremes of the two parental strains (Figure 2).
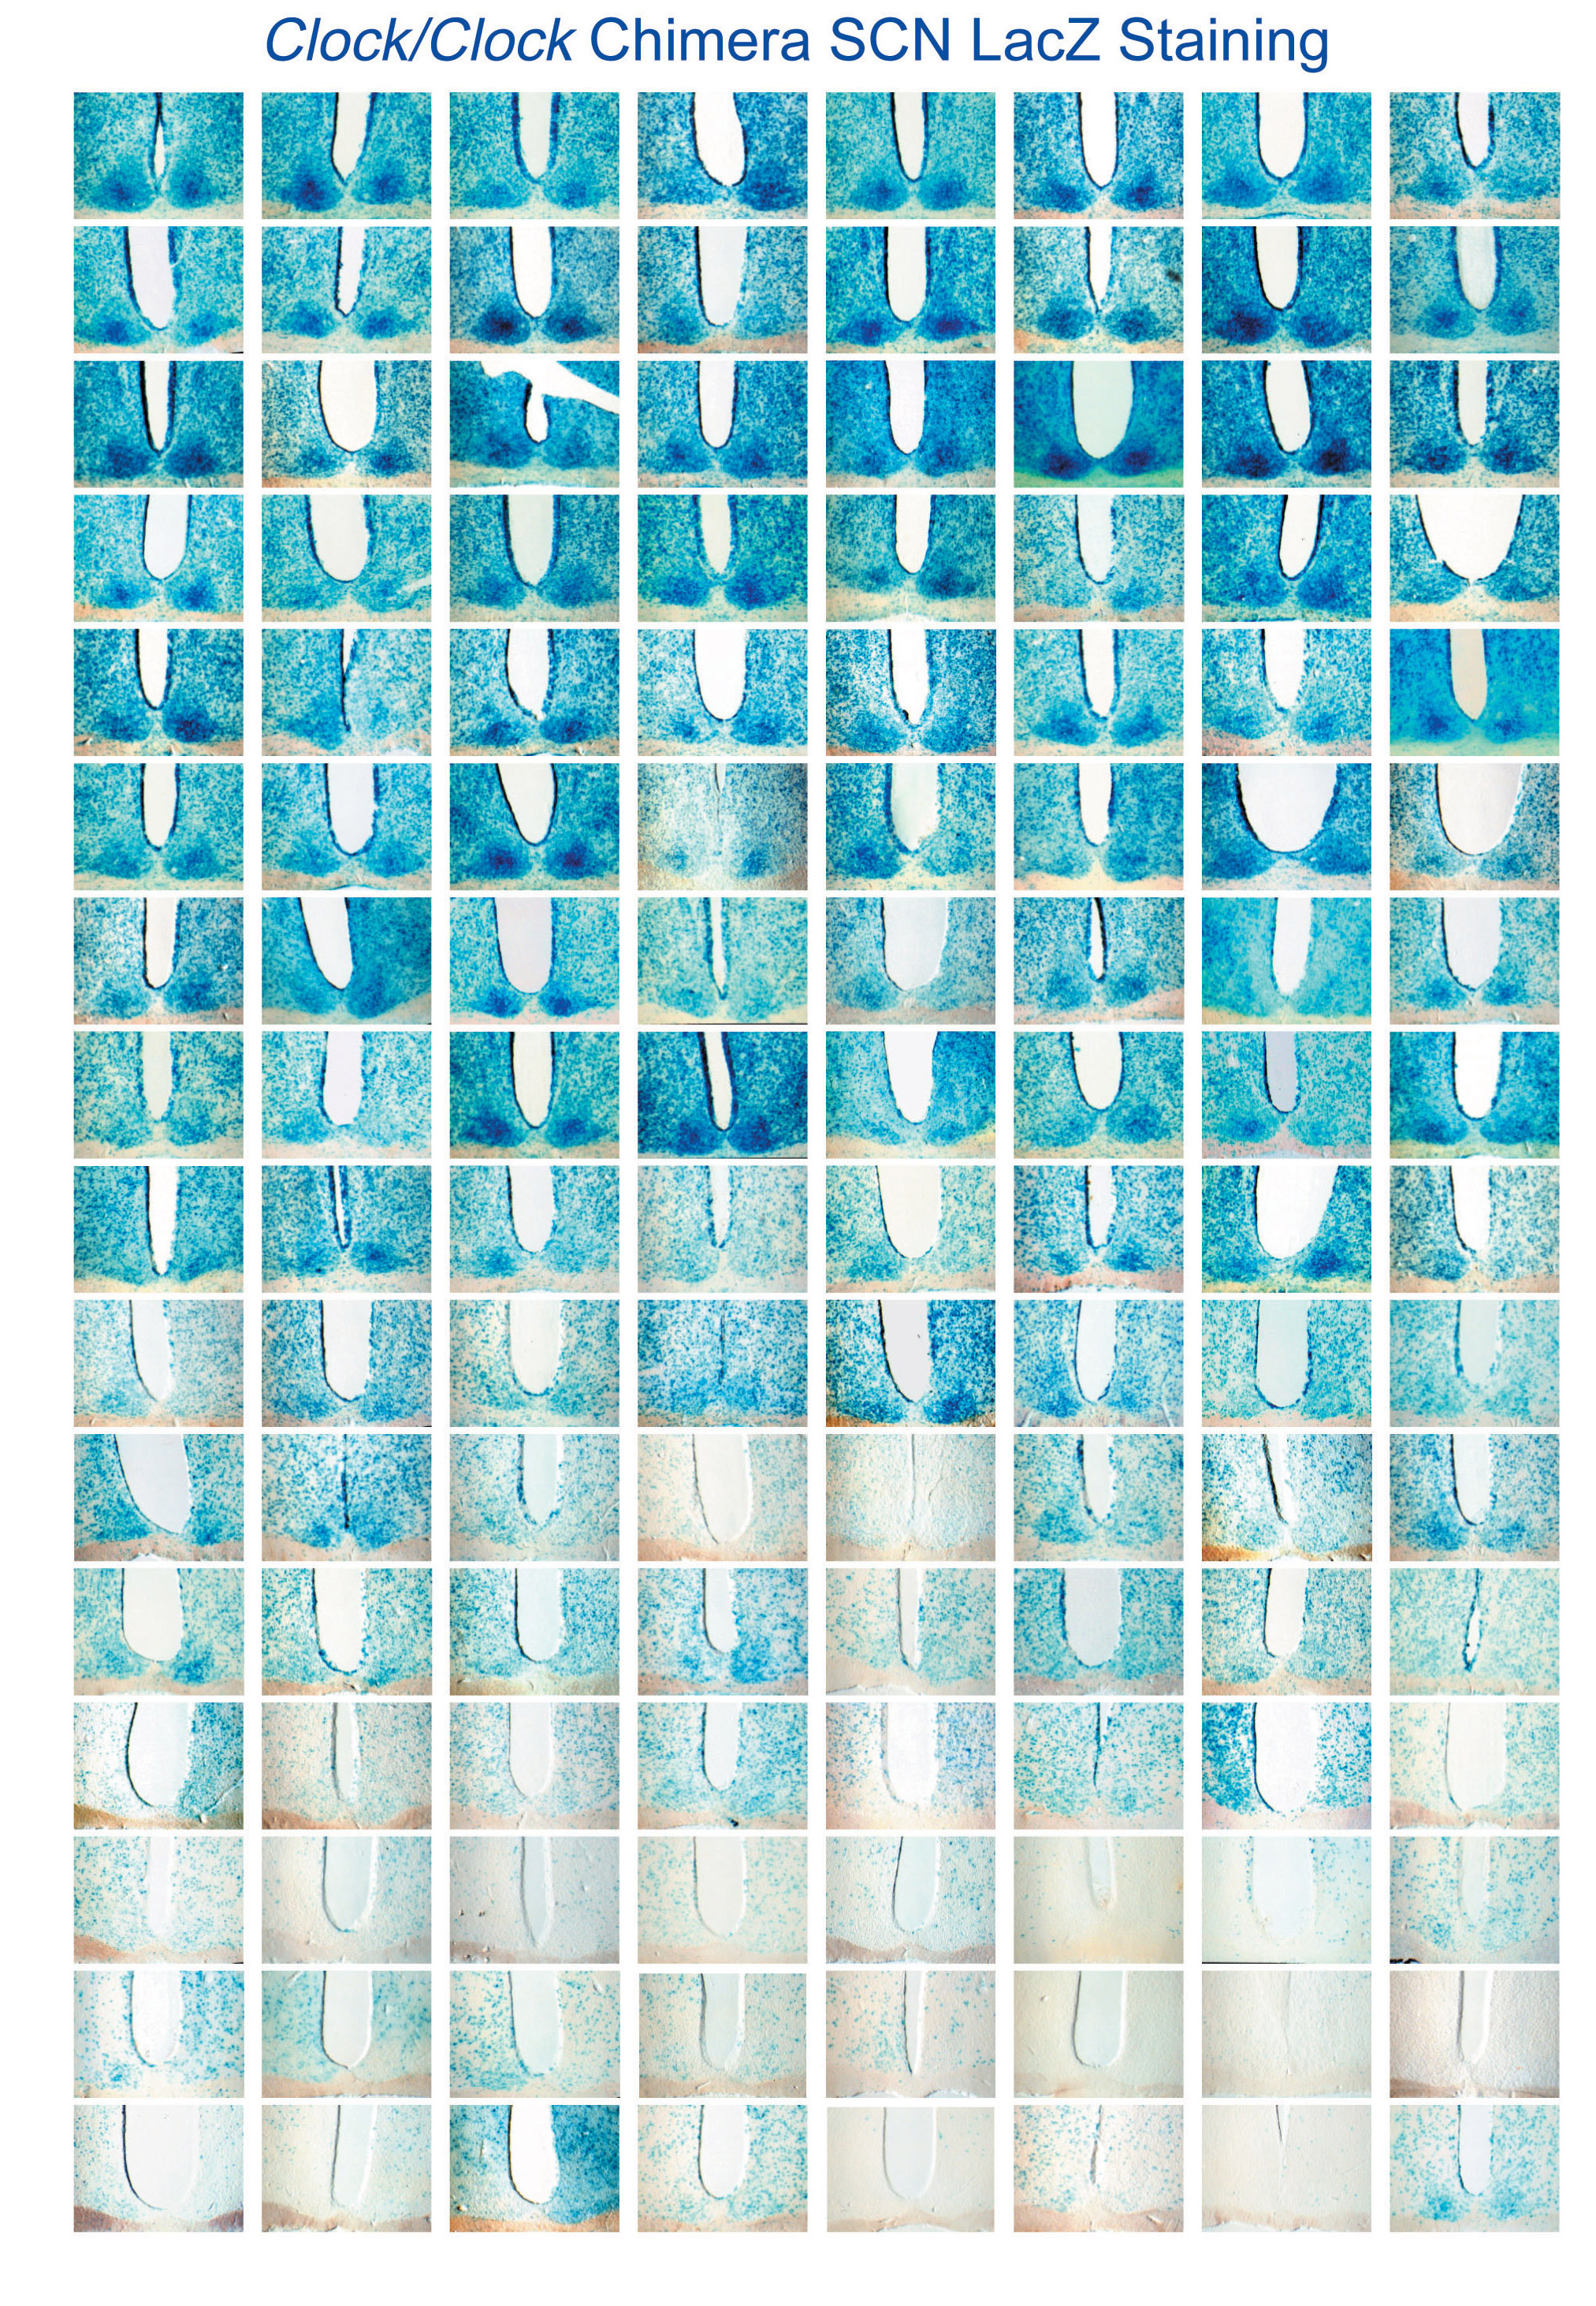
Figure 3. SCN of Clock/Clock Chimeras Show a Gradient of LacZ-Positive (WT) Cells when Ordered by Circadian Behavioral Phenotype.

A single, central section through the SCN of each chimera is shown; chimeric individuals are represented in the same order and configuration as in Figure 2. Notably aberrant cases of SCN LacZ staining: row 10 column 5, row 11 columns 4 and 5, row 13 column 7, row 16 columns 3 and 8. Figures 2 and 3 (and Supplemental Figures S3–S5 on the Cell web-site) show data from 128 Clock/Clock chimeras; 9 individuals were excluded due to premature death or inadequate histological processing.
Figure 2.

Clock Chimeras Show a Range of Circadian Behavioral Phenotypes Activity records are arranged from left to right, top to bottom, showing more subjectively WT-like to more mutant-like behavior. We initially ranked phenotypic traits according to a sequence of progressive mutant severity that we have observed in Clock heterozygotes and homozygotes on various genetic backgrounds. Mutant phenotypes tend to escalate from aberrant responses to light pulses, to period lability, amplitude instability, sustained period changes, and finally, to a loss of circadian rhythmicity. Guided by these criteria, we qualitatively ordered the activity records in this panel according to the degree to which we judged their activity to be WT-like versus Clock mutant-like. Behaviorally equivalent individuals were ordered by date of birth.
The circadian behavior of the chimeras appearing in the upper rows of Figure 2 was indistinguishable from that of normal mice. The SCN corresponding to these chimeras that displayed WT-like rhythmicity are shown to contain a majority of WT cells (Figure 3). However, virtually all of these chimeras also contained mutant SCN cells. From this we conclude that interspersed Clock mutant cells do not necessarily interfere physiologically with the rhythm generative mechanism of WT SCN cells, or with their ability to convey timing information to center(s) generating locomotor activity. The circadian behavior represented in the lower rows (Figure 2) was indistinguishable from that of Clock homozygous mutant animals. While these animals contained a majority of Clock mutant SCN cells, we note that the presence of a few scattered blue WT cells within the extent of each of these SCN is not necessarily sufficient to confer overt behavioral rhythmicity (Figure 3). This result refutes widely the notion that a few faster, higher amplitude (WT) oscillators might dominate rhythmicity, whether through direct electrical entrainment or some diffusible factor (CLOCK protein is not known to convey information between cells). In summary, we conclude that small numbers of either WT or mutant SCN cells cannot dominate circadian rhythmic behavioral output.
Intermediate Behavioral Phenotypes and Coherent Rhythmic Output Indicate Interaction and Functional Integration between WT and Clock Mutant Cells in Chimeras
Significantly, roughly a third of the Clock/Clock chimeras, located in the central region of the array (Figure 2), showed intermediate degrees of mutant phenotypic severity. The corresponding SCN (Figure 3) illustrate that intermediate behavioral phenotypes result when WT and mutant cells are more closely matched in number. Intermediate phenotypes indicate that the cells of the two different genotypes within the SCN of these mice can functionally interact. The strongest evidence of such functional interaction was the emergence of instances of stable, sustained period lengths intermediate between the 23.7 hr and 28 hr averages characteristic of WT and Clock/Clock mice (Figures 4A and 4B). Mice exhibiting intermediate periods often showed large phase-shift responses similar to those seen in Clock/+ mice. These chimeras were behavioral phenocopies of Clock/+ mice, yet not a single cell in these individuals was heterozygous for the Clock gene (Figure 4A). Furthermore, neither visual inspection nor quantitative analyses of rhythmic chimeras revealed clear cases of multiple distinct circadian components of activity. We found no behavioral evidence for like-genotype cells synchronizing together or oscillating as segregated populations in chimeric mice. Rather, the opposing periodic influences from the two genotypically different populations of cells were integrated in the behavioral output of chimeras. The close apposition of the two cellular genotypes in the SCN of chimeras is expected to enhance the potential for their functional interaction.
Figure 4. Examples of Circadian Behavior in Clock/Clock Chimeras.

(A) Phenocopies of Clock/+mice. Clock/Clock chimeras can show circadian behavior indistinguishable from that of Clock heterozygotes (example in Figure 1B).
(B) Stable intermediate period lengths. Data shown is in DD5; periodogram analyses for intervals shown indicate the dominant periodicity.
(C) Lability of circadian period and amplitude.
(D) Phase shifts in Clock/Clock chimeras are larger relative to period length and amplitude compared to control mice. Only data from animals with measurable periods flanking light pulses were used (based on error of line-fit measures 2.5). Phase shifts 1 and 2 are displayed together.
(E) Light pulses can temporarily destabilize wild-type-like rhythmicity.
(F) Short period, low-amplitude rhythmicity.
Circadian Behavior Is Correlated with the Genotypic Composition of SCN Tissue
An overall gradient of dark to light staining across the SCN sections (Figure 3) points to a general correlation between the proportion of WT LacZ-staining cells in the SCN and the degree of WT behavior. Despite slight variations in histological processing and photographic conditions among the SCN images in this array, there are several valid exceptions to the general staining gradient (Figure 3 legend). Close examination of the SCN in these mice did not lead us to an explanation for their incongruous behavioral phenotypes.
From visual inspection of the proportions of LacZ- positive cells in 12 spatial regions of the SCN of each chimera, we assigned a score from 1 through 5 (fewer to more β-galactosidase-positive SCN cells) for each region. The 12 SCN regions roughly correspond to cyto-architectural and neurochemical divisions within the SCN. Examples of SCN representing these LacZ scores are shown in Figure 5. We found that free-running period length correlates with the proportion of WT SCN cells in chimeras, such that period is shorter when there are more WT SCN cells (R2 =−0.72; Figure 5A). The shape of the function is consistent with a threshold requirement for WT cells to produce a WT period. In addition, rhythm amplitude is higher in chimeras with more WT SCN cells (R2 =0.72; Figure 5B). These results quantitatively demonstrate that among Clock/Clock chimeras, there is an overall dose relationship between the genotypic composition of SCN tissue and circadian behavior.
Figure 5. Circadian Period Is Shorter and Amplitude Is Higher with More LacZ-Positive (WT) Cells.

Examples of SCN representing each average score from 1 to 5 are shown. Both free-running period in DD4 (A) and circadian amplitude (rPSD) in DD1 (B) are correlated with the average of 12 regional SCN LacZ-staining scores (period R2 =−0.72; amplitude R2 = 0.72).
Lability of Circadian Rhythmicity in Chimeras
A novel feature of a number of chimeras was the high degree of period and amplitude lability exhibited in constant conditions (Figure 4C). Such spontaneous and dramatic switching between patterns of behavior is unprecedented in nonchimeric mice. Lability is a characteristic of a destabilized circadian clock. The phase-shifting effect of light pulses was more variable among those chimeric mice with measurable rhythmicity, compared to control animals. Maximal phase shifts were measured in chimeric mice with otherwise WT-appearing period and amplitude (Figure 4D). Large phase shifts and the induction of temporary arrhythmicity by light pulses in chimeras with otherwise WT-appearing rhythmicity (Figure 4E) are also symptomatic of clock destabilization.
The Effects of the Clock Mutation on Circadian Period, Amplitude, and Phase Shifts Are Separable
Strikingly, within the series of Clock/Clock chimeric mice, we observed novel combinations of behavioral parameters. For example, several chimeras exhibited rhythms with short periods, but low-amplitude rhythmicity that graded into arrhythmicity over time in DD (Figure 4F). The behavior of these chimeras, then, included phenotypic properties that normally characterize either WT (short period) or Clock mutant (low amplitude) mice. We refer to cases like these, in which contrasting phenotypic properties were simultaneously expressed as mixed phenotypes. They demonstrate that the effects of the Clock mutation on circadian period, amplitude, and phase shifts do not necessarily covary in Clock chimeras.
SCN Tissue Chimerism
We did not identify obvious patterns of cellular mosaicism outlining functional units within the SCN. Clock mutant and WT cells appeared equally able to contribute to SCN tissue, and we saw no propensity for cells of like-genotype to spatially group together. Aggregation of mouse embryos early in development has been shown to result in fine-grained cellular mosaicism in all tissues, including the central nervous system (Dewey et al., 1976; Oster-Granite and Gearhart, 1981; Goldowitz, 1987). Correspondingly, we observed a fine interspersion of the contrasting cellular genotypes in every SCN we examined, reflecting extensive cell mixing during SCN morphogenesis. We decided to forgo a more detailed counting of cells in favor of semi-quantitative scoring because the variable number and size of β-galactosidase-positive inclusions in ROSA 26 cells (Friedrich et al., 1993) complicates their precise quantification in a non-uniform, three-dimensional tissue. Moreover, the fine-grained consistency of cellular genotypic proportions in mouse chimeras has been found to hamper the identification of tissue foci for behavior (Mullen and Herrup, 1979; Gardner, 1984), which has been achieved in studies of mosaic Drosophila whose tissues are instead composed of large clonal patches. We similarly observed a high internal consistency of genotypic proportions in regions throughout the SCN. The most systematic regional disparities occurred between the left and right SCN. We perceived a tendency for the SCN of chimeras with labile phenotypes, and those that were phenocopies of Clock heterozygotes, to be bilaterally asymmetric, although counterexamples indicate that bilateral asymmetry is neither necessary nor sufficient for these behavioral profiles. Finally, we noted that the composition of the SCN in chimeras was approximated by coat color mosaicism (Figure 3 and Supplemental Figure S3 at http://www.cell.com/cgi/content/full/105/1/25/DC1), as has been documented for other regions of the central nervous system (Musci and Mullen, 1992); melanocytes are neural crest derivatives of the neuroectoderm, which forms the central nervous system (Rawles, 1947).
Principal Components Analysis
We have used principal components analysis to evaluate relationships among the period, amplitude, and SCN scores in Clock/Clock chimeras, and to facilitate comparison of the multidimensional behavior of chimeras with that of the control genotypic groups. A principal components analysis yields a unique solution of weighted linear composites of the observed variables. These components, or factors, account for a maximal portion of the total variance represented by the original variables. Ideally, however, correlations between the variables permit a reduction in the dimensionality of the data set by eliminating negligible variation. Reducing a multivariate data set to fewer components can make the data easier to visualize and understand. Since principal components lie orthogonal to one another, they are expected to reflect different underlying biological processes. In our principal components analyses, we used period (TAU) and amplitude (FFT) measures corresponding to various intervals in DD and constant light (LL). These measurement intervals and our use of variables in these analyses are described in the Experimental Procedures; in short, we selected behavioral variables with the intent of balancing incidences of arrhythmicity (missing period data) with the descriptive value of each measure.
We found that amplitude measurements and period measurements invariably group together and load highly on two different principal components. Figure 6A shows a plot of loadings on a two-component solution for four period variables (TAUDD1A, TAUDD2, TAUDD4, TAULL) and three amplitude variables (FFTDD1, FFTDD4, FFTLL), using Clock/Clock chimera data. Component loadings are the co-variances of the original variables with the derived principal components. The two components explained 68% of the total original variance. The period measures load highly on Factor 1, whereas the amplitude measures are mostly weighted on Factor 2. This result indicates that circadian period and circadian amplitude measures largely vary independently.
Figure 6. Principal Components Analyses.

(A) A principal components factor loading plot shows that circadian period and circadian amplitude measures share little common variance in Clock/Clock chimeras.
(B) A principal components factor for amplitude plotted against a factor for period permits comparison of multiple dimensions of Clock/Clock chimera behavior with control genotypic groups. The plot demonstrates that chimera scores are distributed beyond the ranges of the control groups, reflecting novel period-amplitude combinations among chimeras. Sample ellipses p =0.683.
(C) Principal components analysis of Clock/ Clock chimera data indicates that amplitude shares more common variance with regional SCN scores than does period. The plot suggests that amplitude is more related than is period to SCN cellular composition.
(D) A plot of a circadian behavior (period-amplitude) factor by an SCN LacZ-staining factor shows that the two are correlated in Clock/Clock chimeras: R2 =−0.72.
Single-factor principal components solutions for the same four period variables and for the three amplitude variables were obtained using data from the control genotypic groups (accounting for 90% and 80% of the variance of the original variable sets). When factor scores for both controls and Clock/Clock chimeras are plotted, the three control genotypic groups separate from one another (Figure 6B). Chimera scores not only cover the ranges of each of the control groups, but are also distributed beyond them, reflecting novel behavioral phenotypic profiles with respect to circadian period and amplitude.
To analyze the relationships among period, amplitude, and SCN composition, a principal components analysis was performed using two period variables (TAUDD2, TAUDD4) and two amplitude variables (FFTDD1, FFTDD4), in combination with the 12 SCN regional scores for the Clock/Clock chimeras. A factor loadings plot of the two-factor solution (explaining 80% of the variance) indicates that SCN score variables share more common variance with amplitude measures than with period measures (Figure 6C). This result illustrates that circadian amplitude correlates more closely with regional SCN scores than does circadian period. The SCN scores cluster together in their factor loadings due to their high inter-correlation.
The same two period and two amplitude variables were used to calculate a single, combined circadian behavior (period-amplitude) factor for the Clock/Clock chimeras (explaining 78% of the variance). An additional SCN factor was derived from principal components analysis applied to the 12 SCN regional scores (explaining 87% of the variance). The scores for the Clock/ Clock chimeras for each of these independently derived factors were plotted (Figure 6D) and quantitatively demonstrated that SCN LacZ staining and circadian behavior are linearly correlated (R2 =−0.72).
Cluster Analyses
Cluster analysis is a statistical procedure for detecting natural groupings in multivariate data. The method is based on measures of dissimilarity between objects, expressed as distances in a multidimensional space defined by the number of variables taken into account. We employed agglomerative hierarchical clustering (Hartigan, 1975; Gruvaeus and Wainer, 1972), an effective exploratory technique since neither the number nor members of the groups are predetermined. Each object begins as a single-member cluster, then the two clusters considered to be the most similar (closest) are iteratively joined until a single group remains containing all objects. Similar objects should appear in the same cluster, dissimilar objects in different clusters. Objects are displayed linked by lines whose lengths reflect the degree of similarity.
In a cluster analysis based on all seven measures of circadian period and amplitude in DD, individuals of each of the three control genotypes, homozygous Clock, heterozygous Clock, and WT, cluster together phenotypically (Figure 7A). This demonstrates the effectiveness of clustering algorithm in grouping mice according to phenotypic similarity. Figure 7B depicts the result of the same cluster analysis performed on the Clock/Clock chimera behavioral data. In this graph, the colored dots indicate the control genotype with which each chimera was found to cluster most closely in a separate analysis (data not shown). The majority of Clock/Clock chimera phenotypic profiles clustered closely with Clock/Clock or WT control mice. Several Clock/Clock chimeras, however, clustered phenotypically most closely with Clock heterozygotes, and show a tendency to cluster together in this figure. Finally, there are groups of chimeras that cluster by similarity with one another, but did not cluster with any of the control phenotypes. These animals represent novel behavioral profiles. Thus, the clustering algorithm provided independent, quantitative confirmation that Clock/Clock chimeras can behave as phenocopies of Clock heterozygotes, and that they can exhibit novel patterns of circadian behavior that do not resemble those of either parental strain. In addition, these cluster diagrams provided valuable perspective on similarities and differences between groups of behavioral profiles. We have found that clustering algorithms can define inherent structure in complex behavioral data and be of heuristic value for comparing multidimensional behavioral profiles.
Figure 7. Cluster Analysis of Controls and Chimeras.

Complete linkage hierarchical cluster analysis was used, based on all 7 measures of circadian period and amplitude in DD: TAUDD1A, TAUDD1B, TAUDD2, TAUDD3, TAUDD4, FFTDD1, FFTDD4 (in the cluster tree, branch color changes by 0.25 distance metric length of terminal nodes).
(A) Cluster analysis performed on control groups demonstrates the effectiveness of the procedure for sorting multidimensional behavioral phenotypes. The Clock genotypes of the control mice are indicated by the colored dots. The appearance of the cluster of Clock/+ controls amidst the WT controls is an artifact of the way the statistical program positioned the branches of the dendrogram (at each bifurcation of the dendrogram, the position of the clusters can be reversed).
(B) Novel and Clock/+-like phenotypes are quantitatively detected among Clock/Clock chimeras using cluster analysis. The colored dots indicate the control genotype with which each chimera clustered most closely (within a 0.5 distance metric, in a separate cluster analysis combining chimeras and controls).
SCN Regional Analysis
Finally, we calculated the correlations of various SCN divisions with period, amplitude, and a combined period-amplitude factor (Table 2). Using averaged scores for seven SCN divisions (dorsal, ventral, left, right, anterior, medial, and posterior), we found that the anterior SCN average was most highly correlated with the period the factor (R2 =−0.51), and that the ventral SCN average correlated most highly with the amplitude factor (R2 = 0.54). The anterior (R2 =−0.66) and ventral (R2 =−0.67) SCN averages were most highly correlated with the period-amplitude circadian behavior factor. To assess if groups of animals with similar global distributions of WT versus Clock mutant cells in their SCN showed detectable behavioral similarities, we subjected the 12 SCN regional score variables to a cluster analysis. Figure 8 depicts the result of this analysis on a two-dimensional representation of the patterns and proportions of WT cell distribution among Clock/Clock chimeric SCN. We observed that chimeras showing the most mutant-like behavior are represented at the top of the matrix, which corresponds to cases with the fewest WT cells, and those behaving like WT mice are located at the bottom. Instances of chimeras that behave as heterozygote phenocopies, animals that show labile rhythmicity, and those that exhibit the short, low-amplitude mixed phenotype, and other intermediate and mixed phenotypes, were always located in the central portion of this SCN LacZ-staining matrix. We did not observe distinct phenotypic patterns such as these obviously corresponding to particular SCN staining patterns. A cluster analysis applied to the 12 SCN regional variables (Figure 8) demonstrates that the left and the right SCN divisions show the most obvious internal correlations.
Table 2.
Correlational Analysis of a Period-Amplitude Factor with SCN Divisional Averages
| Period Factor |
Amplitude Factor |
Period-Amplitude Factor |
|
|---|---|---|---|
| Dorsal SCN | −0.456 | 0.508 | −0.645 |
| Ventral SCN | −0.464 | 0.542 | −0.669 |
| Left SCN | −0.466 | 0.509 | −0.649 |
| Right SCN | −0.432 | 0.515 | −0.633 |
| Anterior SCN | −0.506 | 0.524 | −0.660 |
| Medial SCN | −0.448 | 0.515 | −0.640 |
| Posterior SCN | −0.406 | 0.512 | −0.644 |
| F-statistic | 4.960 | 5.929 | 12.591 |
| Probability | 0.000 | 0.000 | 0.000 |
Period and amplitude principal components factors are derived from two measures each (TAUDD2, TAUDD4 and FFTDD1, FFTDD4). The period-amplitude factor is derived from all four of these variables. F-statistics refer to significance tests for prediction of factor variables.
Figure 8.

Novel and Mixed Phenotypes of Clock/Clock Chimeras Annotated on a Cluster Analysis of Regional SCN Scores Single linkage hierarchical cluster analysis was used. The cluster tree diagram for the cellular genotype distribution patterns is on the vertical axis of the matrix. SCN LacZ staining increases from the top to the bottom—scores 1–5 indicate fewer to more WT cells. Cluster analysis applied to the 12 SCN regional variables is shown in the dendrogram on the horizontal axis of the matrix. Abbreviations for SCN regions: D = dorsal, V = ventral, L = left, R = right, A = anterior, M = medial, P = posterior. Instances of chimeras that behave as Clock heterozygote phenocopies, animals that show labile rhythmicity, and those that exhibit the short, low-amplitude mixed phenotype are annotated to the left of the matrix.
Complex biological phenomena like behavior are most effectively described by multiple quantitative measures. As we have shown, multivariate statistics can be used to simplify, organize, and reveal structure in large behavioral and anatomical data sets. These tools have allowed us to test hypotheses about how the relationships between variables reveal SCN functional organization. Strategies adopted in this study to analyze circadian behavioral function are relevant and applicable to the genetic analysis of complex biological processes in general.
Discussion
Clock Mutant Cell Dosage Effects on Circadian Behavior in Chimeras
In Clock/Clock chimeras, both WT and Clock mutant cells were capable of influencing circadian behavior. This was made evident by the representation among chimeras of both component-strain phenotypes. That the component cellular genotypes could jointly influence circadian behavior was shown in the incidence of intermediate and novel mixed phenotypic profiles. A phenotypic gradient across this series of chimeras (Figure 2) reflects an incremental dissection of the effects of Clock mutant cell dosage on circadian behavior. A majority of either WT or mutant cells was required to dominate whole-animal behavior. That circadian behavior was generally representative of SCN composition as a whole contrasts with the dynamics of other rhythmic cellular networks like the myogenic pacemaker, in which the fastest cell sets the heart rate. Populations of Clock/Clock and Clock/+ chimeras collectively contain equivalent numbers of WT cells—that Clock/Clock chimeras produced a greater range of mutant severity than Clock/+ chimeras indicates that it is not simply the number of WT SCN cells in a chimera that determines its circadian behavior. Instead, in chimeras, we find that Clock mutant cells play an active role in lengthening the period and reducing the amplitude of the overt behavioral rhythm. Further, the difference between Clock/ Clock and Clock/+ chimeras demonstrates a dosage effect of mutant alleles on circadian cellular physiology in the intact animal.
Clock Heterozygote Phenocopies Show that Intercellular Allelic Distribution Can Mimic Intracellular Allelic Effects on Behavior
The dosage and distribution of the Clock mutant allele in the average Clock/Clock chimera contrasts with regular, non-chimeric, Clock heterozygotes. A Clock/Clock chimera carries two copies of the Clock mutant allele in half of their cells, on average, and no mutant alleles in the remaining cells; Clock heterozygotes, on the other hand, carry a single mutant and a single WT allele in every cell. Collectively, across the cells within the SCN, then, the average Clock/Clock chimera carries the same total number of Clock mutant alleles as a Clock heterozygote, but the allelic content of individual cells differs; Clock heterozygotes and Clock/Clock chimeras will also differ in CLOCK protein intracellular distribution. In heterozygotes, the Clock mutation behaves as an anti-morph (King et al., 1997a), consistent with the dominant-negative effect of the transcriptionally deficient mutant protein (Gekakis et al., 1998). In addition, the presence of the normal CLOCK protein within pacemaker cells has appeared to be rate limiting such that Clock gene dosage in transgenic mice influences the shortness of period of the behavioral rhythm (Antoch et al., 1997). A series of chimeras has allowed us to address whether the mitigating effect of the mutant allele by a WT allele in the same cell (as in Clock/+ mice) could also occur when WT alleles were in neighboring cells (as in chimeras), for a range of allelic proportions. We were surprised to find that Clock/Clock chimeras could behave as phenocopies of Clock/+ mice; that is, amelioration of the behavioral effects of the mutant allele at an intercellular or tissue level in chimeras can resemble allelic interaction at an intracellular level. However, this only occurs in a fraction of chimeric specimens (10%), indicating that this intercellular interaction is dependent upon the relative proportions and distributions of Clock/Clock mutant and WT cells within individual SCN.
Intermediate Periods Demonstrate Cell Interaction in Period Determination
Clock/Clock chimeras demonstrated a capacity for sustained, high-amplitude periods intermediate between the 23.7 hr and 28 hr average periods, characteristic of their component genotypes. Intermediate values for a given phenotypic trait among chimeras indicate that more than one cell (and more than one clonal population) determines the behavior, and that cells determining the trait can interact to produce an intermediate tissue-level outcome. A number of studies have established that the circadian period in the whole animal roughly corresponds to the numerical average of more variable periods of individual cellular oscillators, as measured by single-cell recordings in vitro (Welsh et al., 1995; Liu et al., 1997; Herzog et al., 1998; Honma et al., 1998). Furthermore, normal SCN tissue organization is known to decrease the variability of expressed period lengths and enhance synchrony among oscillatory cells (Meijer et al., 1997; Herzog et al., 1998), although not all such oscillatory cells in the SCN necessarily act as central pacemakers. The SCN, then, is functionally organized to produce a coherent, intermediate period from more variable component oscillations, even in nonchimeric animals. We have shown, using Clock chimeras, that this mechanism can integrate a larger range of period lengths than occurs in normal animals. That intermediate periods were not evident in all Clock chimeras, however, shows that the ability to achieve intermediate periods depends upon the proportion and distribution of the two genotypes of SCN oscillators. Electrophysiological recordings in chimeric SCN could be used to discern at what level period restriction occurs, that is, whether single oscillatory cells are induced to express the intermediate periods seen in overt activity, or if the averaging effect is a tissue-or systems-level property.
Coherent Behavioral Rhythms in Chimeras Demonstrate Integration of Cellular Output Signals
The opposing rhythmic influences from the two cellular genotypes, in chimeras with detectable circadian rhythmicity, almost always produced a single daily activity bout. We observed little behavioral evidence for multiple, competing circadian output signals, or indications that like-genotype cells synchronize with one another preferentially. Earlier studies have shown that hamsters with genetically composite SCN through transplantation (Vogelbaum and Menaker, 1992; Hurd et al., 1995), mosaic Drosophila (Konopka et al., 1983), and cockroaches with one transplanted optic lobe oscillator (Page, 1983) often simultaneously express the two distinct periodicities characteristic of their tissue components in their activity rhythms. The dual rhythmic components in these animals have not been observed to interact to produce integrated functional outcomes. Continuous patches of like-genotype cells are common to both Drosophila mosaics and tissue transplant recipients, whereas in Clock chimeras, WT and mutant cells were both intimately interconnected and closely physically apposed. This suggests that the spatial configuration of mixed oscillators, and/or their physical coupling relationships, affect their ability to achieve an integrated output signal. Mouse chimeras also differ from mammalian SCN transplant models in that the intrinsic connectivity between SCN and area(s) generating locomotor output in chimeras remain intact.
It was proposed of period (per) mosaic flies that each side of the brain could produce a rhythm and express it independently (Konopka et al., 1983). Equivalently, the left and right mammalian SCN have been demonstrated to be capable of generating independent circadian rhythms (Zhang and Aguilar-Roblero, 1995; de la Iglesia et al., 2000). The most dramatic and frequent cell composition contrasts in chimeric SCN occurred between the left and the right sides (SCN variables cluster by left and right divisions, Figure 8). Given that it is possible for these two most obviously anatomically separable oscillators to produce different output signals, and in light of the previous findings of dual periodicities in mosaic animals, it is surprising that we rarely saw multiple concurrent periodicities in locomotor activity output.
How does the SCN communicate with the site(s) that generate locomotor activity behavior? Prior evidence supports roles for both diffusible signals (Silver et al., 1996) as well as neural transfer of timing information (Inouye and Kawamura, 1979; Schwartz et al., 1987). Whether neural or diffusible, in the vast majority of chimeric mice, the two cell genotypes seemed to access the same pathway(s) to activity output in an integrated manner.
Phenotypic Lability in Chimeras Reveals a Complex, Multi-oscillator Circadian System
The incidence among Clock chimeras of dramatic lability in both period and amplitude of the circadian rhythm implies spontaneous ongoing adjustment of the relative amplitudes or strength of coupling between individual oscillators, or in the interactions between the circadian oscillators with the behavioral output system. Alternating of the dominant periodicity of behavior has also been seen in hamsters carrying a combination of native SCN tissue and contrasting tau genotype SCN transplants (Vogelbaum and Menaker, 1992; Hurd et al., 1995). The relative roles of individual circadian cellular oscillators, multicellular oscillators, and their network interactions in determining circadian behavior of mammals have not yet been determined. Mouse chimeras potentially express a range of relative amplitudes of multicellular oscillator components. Since all proportions and distributions of the component cellular genotypes are possible in aggregation chimeras (Falconer and Avery, 1978), one potentially covers all types of cellular interaction between two genetically distinct cell populations in a series of chimeras. Perturbation by light pulses was also able to alter the period and/or amplitude of the activity rhythm in chimeras. The temporary disruption by light pulses of otherwise WT-appearing rhythms in some cases indicates that underlying circadian oscillators in Clock chimeras may be less stably synchronized than in normal WT mice.
The Effects of Clock on Circadian Period, Amplitude, and Phase Shifts Are Mediated by Different Sets of Cells
The effects of the Clock mutation on circadian period, amplitude, and phase shifts did not necessarily covary in Clock chimeras. In particular, principal components analysis indicated that period and amplitude largely vary independently (Figure 6A). These observations support the idea that the circadian clock comprises separable functional units, and suggest that different sets of cells may be primary determinants of the period and amplitude of circadian behavioral rhythms. We have also shown evidence that phase-shifting behavior in chimeras is not reliably predicted by prior circadian period or amplitude (Figure 4D), suggesting that phase shifts are not determined by the same complements of cells as those that determine period and amplitude. This may reflect an effect of Clock on cells on the light input pathway, and/or on a set of pacemaker cells that are responsive to light. We also cannot rule out possible effects of the Clock mutation on tissues extrinsic to the SCN that influence the overt rhythm of activity, although in DD we expect extra pacemaker influences to be minimal. Although Clock is expressed in tissues throughout the body (King et al., 1997b; Steeves et al., 1999), pleiotropic effects of the Clock mutation are not readily apparent. We imagine that the specific distribution of WT versus mutant cells in each chimera determined which aspects of the mutant phenotype it expressed.
Circadian period, amplitude, and phase have been considered intrinsic properties of the central circadian pacemaker. To varying degrees, these circadian properties have been shown to reside within individual SCN cells. Circadian periodicity is a property of a majority of individual SCN cells (Welsh et al., 1995; Herzog et al., 1997, 1998; Liu et al., 1997; Honma et al., 1998). Circadian amplitude is expressed at a single-cell level; for example, diminished amplitude in Clock/Clock mutants manifests in the electrical activity of single SCN cells (Herzog et al., 1998). Phase-dependent rhythm modulation in the SCN can also occur at the single-cell level, in response to light (Meijer et al., 1998) and to GABA (Liu and Reppert, 2000).
In chimeric individuals of more balanced genotypic proportions, phenotypic parameters occasionally diverged from the overall chimerism of the SCN (Figure 5), or from general somatic chimerism as indicated by coat color (Figure 2 and Supplemental Figure S3 on Cell website). Statistically, this argues that the populations of cells underlying period and amplitude are relatively small; the smaller a group of cells, the more frequently will its genotypic composition be biased away from the chimerism of the whole. That period variables were less correlated with regional SCN scores than were amplitude variables, as illustrated using principal components analysis (Figure 6C), further suggests that period may be determined by a smaller number of cells than amplitude.
We propose that the novel phenotypic combinations seen among our chimeras reflect unique combinations of the cellular composition of a group of central pacemaker oscillators that primarily determines circadian period, and another non-identical set of oscillators that predominantly influences the amplitude of locomotor output rhythms. Together, our observations lead us to hypothesize that the pacemaker tissue determining the period, phase, and amplitude seen in overt circadian rhythms of activity is rendered as a multicellular, functionally distributed construct.
Functional Anatomy of the SCN
In the search for “essential” SCN pacemaker cells, which by definition determine properties of period, phase, and amplitude, many studies have been interpreted as indicating equipotentiality rather than localization of function. Might this be because the tissue substrate mediating these properties is diffuse? As our analyses have indicated, the foci for different properties of circadian behavior may be spatially separated in the SCN.
Though well-characterized, the anatomical structure of the SCN has not explained its physiology. Cellular heterogeneity in ultrastructure, cytochemistry, anatomical connectivity, response to environmental stimuli, and electrical properties are well documented in the SCN (reviewed in Klein et al., 1991; Pennartz et al., 1998). The functional consequences of this heterogeneity, however, are not yet understood. Interpretation of lesion experiments (van den Pol and Powley, 1979; Harrington et al., 1993) and requirements for restoration of function by SCN transplant (Lehman et al., 1987; DeCoursey and Buggy, 1989; Aguilar-Roblero et al., 1994) remain unresolved. Moreover, the intrinsic organization of the SCN does not appear to be strictly necessary for circadian rhythmic behavior (Silver et al., 1990; Earnest et al., 1999).
Accumulated data have led to the hypothesis that the light-responsive ventral SCN conveys entrainment information to central pacemaking neurons in the dorsal SCN, from which signals arise to temporally organize output rhythms such as locomotor activity (Moore, 1996; Leak et al., 1999). Vasoactive intestinal polypeptide (VIP) and arginine vasopressin (AVP)-producing cells characterize the ventral and dorsal SCN subregions, respectively, although neither of these neuropeptides seems to be exclusively necessary and sufficient for rhythm generation. Given that AVP can modulate the amplitude of the SCN firing rate rhythm (Ingram et al., 1998), it is feasible that the AVP cells correspond with the set of oscillators determining locomotor output amplitude, and that the reduced amplitude of behavioral rhythmicity in Clock mutants results from alterations in this neuropeptide (Jin et al., 1999; Silver et al., 1999; Herzog et al., 2000). It is also possible that the oscillators determining output amplitude coincide with the Calbindin-D28K-positive region, in the caudal SCN, which has been reported to be essential for locomotor output rhythmicity in hamsters (LeSauter and Silver, 1999). The central pacemaker cells that determine period might comprise those that express the most accurate 24 hr periods—a core population of circadian oscillators with highly uniform 24 hr periods has been supported by at least one model of SCN function (Bouskila and Dudek, 1995). In our analyses, correlations calculated using principal components scores summarizing circadian period and amplitude measures hinted at roles for the anterior and ventral SCN regions in determining these circadian parameters (Table 2).
As an interesting parallel, mosaic analysis in Drosophila has suggested that these animals may not have a single discrete neural focus for circadian behavioral control (Ewer et al., 1992). Moreover, comparison of circadian periodicity and population circadian amplitude among various per-transformant lines led Liu et al. (1991) to propose that different per-expressing central nervous system locations may determine the period and the strength of the circadian rhythm of activity in flies.
Our study demonstrates benefits of chimera analysis for separating effects that arise from different physiological processes in complex mutant phenotypes. Promising new tools allowing the visualization of SCN cellular activity (Kuhlman et al., 2000; Yamazaki et al., 2000) are also rendering the SCN more accessible to studies addressing regional specialization of function, which could contribute to the identification of the pacemaker components that we have proposed.
Prospectus
In the 40 years since the first mouse aggregation chimeras were created (Tarkowski, 1961; Mintz, 1962), the applicability of chimera analysis has been restricted. The evolution of new effective transgenic cell-marker strains and a wealth of new mutations, however, have brought new relevance to this analytical tool for exploring the organismal effects of genetic mutations (see Rossant and Spence, 1998). In chimera studies, existing mutants can be recruited to produce entirely unique and novel, developmentally intact, experimental animals that can potentially exhibit new biological properties. As each chimera is a new permutation of cell genotypic proportions and distributions, chimera analysis is a numbers game—the more complex the physiology, the greater the gains in analytical power and resolution achieved with larger numbers of chimeras. One of the major expected sources of new mutants is ENU mutagenesis screens (see Takahashi et al., 1994; Hrabe´ de Angelis et al., 2000; Nolan et al., 2000). Large- scale mutagenesis efforts call for strategies to perform the critical function of dissecting and defining mutant phenotypes (Balling et al., 2000). In many ways, chimera analysis is a natural partner to mutagenesis screening. Neither requires prior assumptions about gene function, and chimera analysis can be profitably undertaken without knowing the sequence or expression pattern of a gene —the initiation of this study preceded the mapping and cloning of Clock. Aggregation chimera analysis can also be quite efficient—the first and last of 200 chimeras produced for this study were born within 10 months of one another. The sensitivity of chimera analysis may be most suited to mutations that alter complex processes like behavior.
In summary, we expect that the simplicity of the technique and its utility in asking and answering functional genetics questions will make the analysis of mouse chimeras particularly useful in an age of large-scale mutagenesis for the wholesale analysis of new mutant phenotypes.
Experimental Procedures
Source Mouse Colonies
All Clock mutant mice used in this experiment were produced in two separate breeding colonies of albino mutants, one maintained in specific pathogen-free (SPF) conditions and the other in conventional housing conditions in the Center for Experimental Animal Resources at Northwestern University. The SPF albino Clock mutant colony was originated by embryo-deriving seven albino Clock heterozygote founders ((C57BL/6J × BALB/cJ)F3 or F4; not necessarily siblings), which were then intercrossed. At this stage, separate breeding lines of Clock mutant and WT mice were established. We were subsequently able to reliably maintain a Clock mutant line through Clock/Clock × Clock/Clock (homozygous) matings. Previous attempts to produce Clock homozygotes through homozygous matings in the laboratory had been almost completely unsuccessful due to an as yet uncharacterized parturition defect. We had similar success in being able to establish an albino Clock mutant breeding colony in our conventional housing facility from an original five male and two female (C57BL/6J × BALB/cJ)F2 or F3 albino Clock homozygote founders, where we were also able to produce Clock/Clock mice through homozygous matings.
All ROSA 26 mice used were produced in our SPF colony, which was derived from two original breeding pairs purchased from The Jackson Laboratory. The ROSA 26 mouse strain was generated by the insertion of a LacZ promoter trap construct into an unspecified locus (since characterized; Zambrowicz et al., 1997), using 129Sv embryonic stem cells from which the transgenic line was derived (Friedrich and Soriano, 1991). The line has since been bred onto a primarily C57BL/6J genetic background and has a black coat color, either agouti or nonagouti.
C57BL/6J females used as embryo donors were purchased from The Jackson Laboratory.
Outbred CD-1 mice, which served as vasectomized stud males and foster mothers, were either purchased from Charles River Laboratories or derived onsite from such animals.
Embryos
Clock/Clock embryos (C57BL/6J, BALB/cJ; albino) were produced by crossing Clock/Clock females with Clock/Clock stud males. Clock/+ embryos (C57BL/6J, BALB/cJ; albino) were produced by crossing females from the albino WT colony with Clock/Clock stud males. WT embryos (C57BL/6J, BALB/cJ; albino) were derived from crosses within the albino WT colony. Albino embryos of each of these three Clock genotypes were aggregated with hemizygous ROSA 26 (C57BL/6J, 129Sv; pigmented) embryos, which were produced by crossing C57BL/6J females with homozygous ROSA 26 stud males. The three genotypes of aggregation chimeras that we produced by embryo aggregation are conventionally designated: (1) Clock/Clock; +/+; albino ↔ +/+; ROSA 26; pigmented (Clock/ Clock chimeras); (2) Clock/+; +/+; albino ↔ +/+; ROSA 26; pigmented (Clock/+ chimeras); and (3) +/+; +/+; albino ↔ +/+; ROSA 26; pigmented (WT chimeras).
Generation of Chimeras and Controls
Chimeras were generated using standard methods of aggregating two 8 cell embryos, or morulae (Hogan et al., 1994). Female mice were super-ovulated with 5–7 IU pregnant mares’ serum gonadotropin (Sigma) followed 46 hr later by 5 IU human chorionic gonadotropin (Sigma), then paired overnight with stud males. Morulae were flushed into M2 medium from dissected oviducts on embryonic day 2.5 (E2.5; vaginal plug = E0.5). Embryos were briefly incubated in acidic Tyrode’s solution (Specialty Media) to remove the zonae pellucidae. Pairs of embryos were then aggregated in CZB+ medium (Specialty Media) under mineral oil and cultured overnight at 37°C, −5% CO2. The following day, the aggregated embryos and, in some cases, excess unpaired embryos were surgically transferred into the uterine horns of 2.5 day pseudopregnant CD-1 foster mothers under Metofane anesthesia. Pseudopregnant recipient females were produced by mating naturally cycling females with vasectomized CD-1 males. Chimeric pups were identified by the presence of variegated coat and eye pigmentation.
Among all chimeras produced for this study, the sex ratio, based on visual inspection of animals at about 3 and 8 weeks of age, was 144 males:56 females. This ~3:1 ratio is consistent with previous observations that most chimeras comprising embryos of opposite sex, about half of all chimeras, appear outwardly male (Tarkowski, 1961; Mullen and Whitten, 1971); the control population consisted of 50 males:44 females. We observed a number of instances of chimeras with three coat colors that indicated contributions from two different ROSA 26 embryos expressing black and black agouti pigmentation. The quantity of ROSA 26 WT embryos was usually limiting during these experiments, and we presume these three-color chimeras resulted from attempts to salvage incomplete embryos by combining them in aggregations. We saw no systematic differences in the behavior of these three-color chimeras compared with other chimeras and they are included in our analyses.
Overtly nonchimeric littermates of chimeras served as component strain controls: WT (C57BL/6J, BALB/cJ; albino, or B6/129Sv; LacZ positive; pigmented), Clock/+ (C57BL/6J, BALB/cJ; albino), and Clock/Clock (C57BL/6J, BALB/cJ; albino). These component strain controls were unaggregated embryos of the kinds used to produce chimeras in this experiment. In addition, a certain percentage of aggregations, though successful, do not result in mice with somatic chimerism (Falconer and Avery, 1978). Both of these cases would give rise to mice that we categorized as component strain controls, all of which were littermates of chimeric mice. Homozygous Clock mutants from the albino line that we produced for this experiment exhibited increased severity of the Clock mutant phenotype compared to those described previously (Vitaterna et al., 1994), in that most became arrhythmic immediately upon release into DD, and their entrainment to an LD 12:12 cycle was often weak. ROSA 26 mice show no apparent (or reported) defects, and we found their circadian locomotor activity rhythm to be normal and robust, indicating that LacZ expression throughout the SCN does not affect circadian behavior. The WT control statistics in Table 1 include both hemizygous ROSA 26 WT controls (n = 16) and albino WT controls (n = 2). Mice were initially identified as nonchimeric by the visual assessment of uniform coat and eye color, and confirmed as such by postmortem examination of retinal pigmentation and SCN staining in dissected tissues. Tissue chimerism was not detected in any mice identified as having a single coat color.
Genetic control mice were bred by mating either Clock/Clock or WT albino females with ROSA 26 stud males, to yield WT genetic controls (C57BL/6J, BALB/cJ,129Sv; LacZ-positive; pigmented) and Clock/+ genetic controls (C57BL/6J, BALB/cJ,129Sv; LacZ-positive; pigmented). The genetic background of these controls approximates the strain background of the average chimera. Genetic controls were also hemizygous for the LacZ transgene. We detected no significant quantitative differences between the behavior of genetic control mice (Clock/+ n = 9; WT n = 22) and component strain controls, so they were grouped, by Clock genotype, in the summary statistics (Table 1).
Upon weaning at 3 weeks of age, mice were group housed by overt sex (up to 5 per cage) in LD 12:12 (lights on at 5 a.m. Central Standard Time (CST)) in SPF conditions, up until the time of behavioral testing. All animal procedures were approved by the Northwestern University Animal Care and Use Committee.
Circadian Behavioral Testing
At 8–11 weeks of age, chimeras and control mice were individually housed in cages equipped with running wheels for activity monitoring. Batches of 12 mice were placed in ventilated, light-controlled boxes by order of birth date, such that chimeras and controls of different genotypes and sexes were combined in single boxes. Food and water were available at all times. Wheel-running activity was continuously monitored by an online PC computer system (Chronobiology Kit, Stanford Software Systems). Seven mice died during behavioral recording; all were Clock/Clock chimeras. Data from these mice were not used in the following analyses. A few of these mice appeared to be hermaphroditic and showed abnormal formation of the reproductive tract.
LD cycles (GE 40W cool white fluorescent light 4 in above cages; lights on at 6 a.m. CST) were controlled by automatic timers. Mice were transferred from LD to DD at their scheduled time for lights off. Light pulses were manually administered by moving individual cages at circadian time (CT)17 to a lighted box until CT23. CTs were calculated from extrapolated eye-fit activity onset times; arrhythmic animals were light pulsed randomly. Constant green light (LL) intensity ranged from 10 to 170 lux (GE 40W green fluorescent light).
Mice were exposed to the following schedule, divided by intervals used in subsequent analyses (annotated in italics):
Days 1–21: 21days in LD 12:12
Days 22–31: DD1A, 10 days in DD
Days 32–41: DD1B, 10 days in DD
Day 41/42: LP1, 6 hr light pulse from CT17–23
Days 42–51: DD2, 10 days in DD
Days 52–61: DD3, 10 days in DD
Day 61/62: LP2, 6 hr light pulse from CT17–23
Days 62–71: DD4, 10 days in DD
Days 72–93: 21days in LD 12:12
Days 94–121: LL, 28 days in LL
Days 122 → (variable period in LD 12:12—up to 7 days) DD5 (variable period in DD)
Each of DD1A, DD1B, DD2, DD3, and DD4 represents a 10 day measurement period. TAULL was calculated based on a floating 10 day window of the most steady-state period during the 28 days in LL, where applicable. The FFT amplitude and periodogram calculations for DD1 were based on the initial 20 days in DD; the FFT amplitude and periodogram calculations for LL were based on the entire 28 day duration.
Measurement of Circadian Behavior
Circadian behavior was viewed and analyzed using the ClockLab software package (Actimetrics, Evanston, IL), developed in MatLab (The Mathworks).
Free-running circadian periods were measured using two different methods, which, combined, helped to detect periodicity even in animals with weak rhythmicity. The first used a X2 periodogram (Sokolove and Bushell, 1978) to detect periodicities ranging from 10 to 36 hr, with a 6 min step size. The second method used the slope of a least-squares regression line, fit to daily activity onset estimates. Clocklab assigns activity onset times by detecting a 6 hr period of inactivity followed by a 6 hr period of high activity, under supervision of the user.
Circadian amplitude was defined as the relative magnitude of the peak circadian periodicity in a Fourier analysis of the activity data. Using Clocklab, we quantitated circadian amplitude by applying a Blackman-Harris window to the data, followed by a Fast Fourier transform (FFT). The total power (area under the FFT curve) was normalized to 1, to calculate relative power spectral densities (rPSD), for frequencies ranging from 0 to 1 cycles/hr (Takahashi and Menaker, 1982). We measured the magnitude of the highest peak in relative power for periodicities in the circadian range (18 to 36 hr or 0.056 to 0.028 cycles/hr). Cases of arrhythmic activity (Table 1) were assessed based on visual inspection of the activity record, considered in conjunction with results of FFT and X2 periodogram analysis (examples of analyses in Figure 1B). Instances of arrhythmicity were excluded from all period calculations.
Phase shifts in response to light pulses were quantified as the number of circadian hours between the points at which extrapolated regression lines, fit to the activity onsets for the two flanking 10 day intervals, intersected with the day of the light pulse. Given that the circadian time of light exposure was indeterminate for arrhythmic Clock homozygotes, the salient difference in this phenotypic parameter is between WT and heterozygous mice. When the direction of a phase shift was ambiguous, as is usually the case in mice, we measured in the direction of smallest magnitude, such that large phase delays and large advances will often be indistinguishable. As indicated by the decrease in arrhythmic animals in DD4, and less so in DD2 (each measured over 10 days following a light pulse), light exposure induced a large proportion of arrhythmic Clock homozygotes to recover a detectable circadian activity rhythm (Table 1).
Statistical Analyses
Statistical analyses were performed using SYSTAT 9.0 (SPSS). For principal components analysis, we used all factors with eigenvalues ≥1, and varimax rotation was applied to all solutions to enhance interpretability of the factors. Euclidean distances were employed and standardized to adjust for differences in scale between variables. Principal components analyses were performed using period variables that corresponded to intervals of activity for which we had the most complete data. Some Clock/Clock chimeras, and most of the Clock/Clock control mice, were arrhythmic in constant conditions, resulting in a lack of numerical circadian period measurements for these durations. Exposure to light pulses frequently restored a measurable rhythm to otherwise arrhythmic animals. As a result, period data measured following light pulses (TAUDD2 and TAUDD4), in addition to the initial period in DD (TAUDD1A), were the most complete period variable sets. For cluster analyses, we used either complete or single linkage rules (as indicated) to determine the degree of similarity between groups. Complete linkage considers the distance between the most distant members of clusters, whereas single linkage uses the closest pair of objects. The linkage algorithms selected were the most effective in coherently clustering control data (Figure 7), or were most appropriate for the limited range of numerical SCN score values (Figure 8). We obtained similar clustering of control genotypes using other linkage algorithms and variable combinations (data not shown).
Histological Processing and Analysis
Mice were deeply anesthetized with sodium pentobarbital then transcardially perfused with chilled phosphate-buffered saline (PBS) with 0.1% heparin (pH 7.3), followed by fresh 4% paraformaldehyde in PBS. Brains were removed and postfixed for 30 min in the same fixative on ice, then stored overnight in 20% sucrose PBS at 4°C. Brains were frozen on dry ice, embedded in M-1 embedding matrix (Lipshaw), and sectioned coronally at 50 µm thickness through the SCN region. Alternate free-floating sections were collected in 24well plates containing a wash buffer (PBS with 2 mM MgCl2, 0.0002% NP-40 (Sigma); pH 7.3).
Sections were incubated for 24 hr at 37°C in an X-gal staining solution containing 1 mg/mL X-gal (5-bromo-4-chloro-3-indolyl-D-galactoside (Gold Biochemical) dissolved in dimethyl sulfoxide), 5mM K3Fe(CN)6, and 5 mM K4Fe(CN)6, in wash buffer. Finally, sections were rinsed three times in wash buffer, twice in ddH2O, and mounted in aqueous mounting medium (3:1 glycerol:PBS) on gelatin-coated glass slides. Stained sections were viewed and photographed under bright-field illumination, with phase contrast adjusted to visualize low-staining specimens. Controls were processed histologically alongside chimeras.
ROSA 26 mice show widespread, constitutive -β-galactosidase expression (Friedrich and Soriano, 1991; Zambrowicz et al., 1997) that appears to include every neuron in the SCN in individuals hemizygous for the LacZ transgene. In our hands, X-gal produced no staining of LacZ-negative SCN tissue (Figure 1B). When processed for X-gal histochemistry, a characteristic granular cytoplasmic staining is detected in neurons (Friedrich et al., 1993), whereas glial cells derived from ROSA 26 mice express only low levels of histochemically detectable LacZ (Brüstle et al., 1995).
β-galactosidase expression in chimeras was judged relative to that of hemizygous ROSA 26 control SCN. For semiquantitative scoring, each bilateral pair of nuclei was partitioned by: left/right, dorsal/ventral, and anterior/medial/posterior. Given that it is most straightforward to visually quantitate the stained than the unstained cells, our scoring system can be described by the following: 1, few stained cells; 2, fewer stained than unstained; 3, about equal proportions; 4, many stained cells but fewer than in the ROSA 26 control; 5, not differentiable from ROSA 26 control.
Supplementary Material
Acknowledgments
We are grateful to Dr. P. Iannaccone and his laboratory for instruction in embryo aggregation techniques; Dr. D. Ferster for data analysis software support; Drs. A. Bejsovec, K. Herrup, P. DeCoursey, W. Schwartz, F. Davis, E. Herzog, M. Lehman, and members of the Takahashi laboratory for useful discussions and advice during the course of this experiment; Drs. M. Hurd and M. Ralph for their X-gal staining protocol; and the excellent services of the animal caretakers in the Center for Experimental Animal Resources, Northwestern University. Thanks to David Zeddies for comments on the manuscript, and for encouragement. Supported by the NSF Center for Biological Timing, an Unrestricted Grant in Neuroscience from the Bristol-Myers Squibb Foundation and the National Institute of Mental Health. J. S. T. is an Investigator in the Howard Hughes Medical Institute.
References
- Aguilar-Roblero R, Morin LP, Moore RY. Morphological correlates of circadian rhythm restoration induced by transplantation of the suprachiasmatic nucleus in hamsters. Exp. Neurol. 1994;130:250–260. doi: 10.1006/exnr.1994.1203. [DOI] [PubMed] [Google Scholar]
- Antoch MP, Song EJ, Chang A-M, Vitaterna MH, Zhao Y, Wilsbacher LD, Sangoram AM, King DP, Pinto LH, Takahashi JS. Functional identification of the mouse circadian Clock gene by transgenic BAC rescue. Cell. 1997;89:655–667. doi: 10.1016/s0092-8674(00)80246-9. [DOI] [PMC free article] [PubMed] [Google Scholar]
- Balling R, Brown S, Hrabe´ de Angelis M, Justice M, Nadeau J, Peters J. Great times for mouse genetics: getting ready for large-scale ENU-mutagenesis. Mamm. Genome. 2000;11:471. [Google Scholar]
- Bouskila Y, Dudek FE. Can a population of suprachiasmatic nucleus neurons with different period lengths produce a stable circadian rhythm? Brain Res. 1995;670:333–336. doi: 10.1016/0006-8993(94)01356-m. [DOI] [PubMed] [Google Scholar]
- Brüstle O, Maskos U, McKay RDG. Host-guided migration allows targeted introduction of neurons into the embryonic brain. Neuron. 1995;15:1275–1285. doi: 10.1016/0896-6273(95)90007-1. [DOI] [PubMed] [Google Scholar]
- Challet E, Takahashi JS, Turek FW. Nonphotic phase-shifting in Clock mutant mice. Brain Res. 2000;859:398–403. doi: 10.1016/s0006-8993(00)02040-0. [DOI] [PubMed] [Google Scholar]
- DeCoursey PJ, Buggy J. Circadian rhythmicity after neural transplant to hamster third ventricle: specificity of suprachiasmatic nuclei. Brain Res. 1989;500:263–275. doi: 10.1016/0006-8993(89)90322-3. [DOI] [PubMed] [Google Scholar]
- de la Iglesia HO, Meyer J, Carpino A, Jr., Schwartz WJ. Antiphase oscillation of the left and right suprachiasmatic nuclei. Science. 2000;290:799–801. doi: 10.1126/science.290.5492.799. [DOI] [PubMed] [Google Scholar]
- Dewey MJ, Gervais AG, Mintz B. Brain and ganglion development from two genotypic classes of cells in allophenic mice. Dev. Biol. 1976;50:68–81. doi: 10.1016/0012-1606(76)90068-3. [DOI] [PubMed] [Google Scholar]
- Earnest DJ, Liang FQ, Ratcliff M, Cassone VM. Immortal time: circadian clock properties of rat suprachiasmatic cell lines. Science. 1999;283:693–695. doi: 10.1126/science.283.5402.693. [DOI] [PubMed] [Google Scholar]
- Ewer J, Frisch B, Hamblen-Coyle MJ, Rosbash M, Hall JC. Expression of the period clock gene within different cell types in the brain of Drosophila adults and mosaic analysis of these cells’ influence on circadian behavioral rhythms. J. Neurosci. 1992;12:3321–3349. doi: 10.1523/JNEUROSCI.12-09-03321.1992. [DOI] [PMC free article] [PubMed] [Google Scholar]
- Falconer DS, Avery PJ. Variability of chimeras and mosaics. J. Emb. Exp. Morph. 1978;43:195–219. [PubMed] [Google Scholar]
- Friedrich G, Soriano P. Promoter traps in embryonic stem cells: a genetic screen to identify and mutate developmental genes in mice. Genes Dev. 1991;5:1513–1523. doi: 10.1101/gad.5.9.1513. [DOI] [PubMed] [Google Scholar]
- Friedrich VL, Jr., Holstein GR, Li X, Gow A, Kelley KA, Lazzarini RA. Intracellular distribution of transgenic bacterial -β-galactosidase in central nervous system neurons and neuroglia. J. Neurosci. Res. 1993;36:88–98. doi: 10.1002/jnr.490360110. [DOI] [PubMed] [Google Scholar]
- Gardner RL. Mammalian chimeras—future perspectives. In: Le Douarin N, McLaren A, editors. Chimeras in Developmental Biology. London: Academic Press; 1984. pp. 431–441. [Google Scholar]
- Gekakis N, Staknis D, Nguyen HB, Davis FC, Wilsbacher LD, King DP, Takahashi JS, Weitz CJ. Role of the CLOCK protein in the mammalian circadian mechanism. Science. 1998;280:1564–1569. doi: 10.1126/science.280.5369.1564. [DOI] [PubMed] [Google Scholar]
- Goldowitz D. Cell partitioning and mixing in the formation of the CNS: analysis of the cortical somatosensory barrels in chimeric mice. Dev. Brain Res. 1987;35:1–9. doi: 10.1016/0165-3806(87)90002-2. [DOI] [PubMed] [Google Scholar]
- Gruvaeus G, Wainer H. Two additions to hierarchical cluster analysis. Br. J. Math. Stat. Psychol. 1972;25:200–206. [Google Scholar]
- Harrington ME, Rahmani T, Lee CA. Effects of damage to SCN neurons and efferent pathways on circadian activity rhythms of hamsters. Brain Res. Bull. 1993;30:655–659. doi: 10.1016/0361-9230(93)90097-u. [DOI] [PubMed] [Google Scholar]
- Hartigan JA. Clustering Algorithms. New York: John Wiley and Sons; 1975. [Google Scholar]
- Herzog ED, Geusz ME, Khalsa SBS, Straume M, Block GD. Circadian rhythms in mouse suprachiasmatic nucleus explants on multimicroelectrode plates. Brain Res. 1997;757:285–290. doi: 10.1016/s0006-8993(97)00337-5. [DOI] [PubMed] [Google Scholar]
- Herzog ED, Takahashi JS, Block GD. Clock controls circadian period in isolated suprachiasmatic nucleus neurons. Nat. Neurosci. 1998;1:708–713. doi: 10.1038/3708. [DOI] [PubMed] [Google Scholar]
- Herzog ED, Grace MS, Harrer C, Williamson J, Shinohara K, Block GD. The role of Clock in the developmental expression of neuropeptides in the suprachiasmatic nucleus. J. Comp. Neurol. 2000;424:86–98. doi: 10.1002/1096-9861(20000814)424:1<86::aid-cne7>3.0.co;2-w. [DOI] [PubMed] [Google Scholar]
- Hogan B, Beddington R, Costantini F, Lacy E. Manipulating the Mouse Embryo. Cold Spring Harbor, New York: Cold Spring Harbor Press; 1994. [Google Scholar]
- Honma S, Shirakawa T, Katsuno Y, Namihira M, Honma K. Circadian periods of single suprachiasmatic neurons in rats. Neurosci. Lett. 1998;250:157–160. doi: 10.1016/s0304-3940(98)00464-9. [DOI] [PubMed] [Google Scholar]
- Hrabe´ de Angelis M, Flaswinkel H, Fuchs H, Rathkolb B, Soewarto D, Marschall S, Heffner S, Pargent W, Wuensch K, Jung M, et al. Genome-wide, large-scale production of mutant mice by ENU mutagenesis. Nat. Genet. 2000;25:444–447. doi: 10.1038/78146. [DOI] [PubMed] [Google Scholar]
- Hurd MW, Zimmer KA, Lehman MN, Ralph MR. Circadian locomotor rhythms in aged hamsters following suprachiasmatic transplant. Am. J. Physiol. 1995;38:R958–R956. doi: 10.1152/ajpregu.1995.269.5.R958. [DOI] [PubMed] [Google Scholar]
- Ingram CD, Ciobanu R, Coculescu IL, Tanasescu R, Coculescu M, Mihai R. Vasopressin neurotransmission and the control of circadian rhythms in the suprachiasmatic nucleus. Prog. Brain Res. 1998;119:351–364. doi: 10.1016/s0079-6123(08)61580-0. [DOI] [PubMed] [Google Scholar]
- Inouye ST, Kawamura H. Persistence of circadian rhythmicity in a mammalian hypothalamic “island” containing the suprachiasmatic nucleus. Proc. Natl. Acad. Sci. USA. 1979;76:5962–5966. doi: 10.1073/pnas.76.11.5962. [DOI] [PMC free article] [PubMed] [Google Scholar]
- Jin X, Shearman LP, Weaver DR, Zylka MJ, De Vries GJ, Reppert SM. A molecular mechanism regulating rhythmic output from the suprachiasmatic circadian clock. Cell. 1999;96:57–68. doi: 10.1016/s0092-8674(00)80959-9. [DOI] [PubMed] [Google Scholar]
- King DP, Takahashi JS. Molecular genetics of circadian rhythms in mammals. Annu. Rev. Neurosci. 2000;23:713–742. doi: 10.1146/annurev.neuro.23.1.713. [DOI] [PubMed] [Google Scholar]
- King DP, Vitaterna MH, Chang A-M, Dove WF, Pinto LP, Turek FW, Takahashi JS. The mouse Clock mutation behaves as an antimorph and maps within the W19H deletion, distal of Kit. Genetics. 1997a;146:1049–1060. doi: 10.1093/genetics/146.3.1049. [DOI] [PMC free article] [PubMed] [Google Scholar]
- King DP, Zhao Y, Sangoram AM, Wilsbacher LD, Tanaka M, Antoch MP, Steeves TDL, Vitaterna MH, Kornhauser JM, Lowrey PL, et al. Positional cloning of the mouse circadian Clock gene. Cell. 1997b;89:641–653. doi: 10.1016/s0092-8674(00)80245-7. [DOI] [PMC free article] [PubMed] [Google Scholar]
- Klein DC, Moore RY, Reppert SM. Suprachiasmatic Nucleus: The Mind’s Clock. Oxford: University Press; 1991. [Google Scholar]
- Konopka R, Wells S, Lee T. Mosaic analysis of a Drosophila clock mutant. Mol. Gen. Genet. 1983:284–288. [Google Scholar]
- Kuhlman SJ, Quintero JE, McMahon DG. GFP fluorescence reports Period 1 circadian gene regulation in the mammalian biological clock. Neuroreport. 2000;11:1479–1482. [PubMed] [Google Scholar]
- Leak RK, Card JP, Moore RY. Suprachiasmatic pacemaker organization analyzed by viral transynaptic transport. Brain Res. 1999;819:23–32. doi: 10.1016/s0006-8993(98)01317-1. [DOI] [PubMed] [Google Scholar]
- Lehman MN, Silver R, Gladstone WR, Kahn RM, Gibson M, Bittman EL. Circadian rhythmicity restored by neural transplant. Immunocytochemical characterization of the graft and its integration with the host brain. J. Neurosci. 1987;7:1626–1638. doi: 10.1523/JNEUROSCI.07-06-01626.1987. [DOI] [PMC free article] [PubMed] [Google Scholar]
- LeSauter J, Silver R. Localization of a suprachiasmatic nucleus subregion regulating locomotor rhythmicity. J. Neurosci. 1999;19:5574–5585. doi: 10.1523/JNEUROSCI.19-13-05574.1999. [DOI] [PMC free article] [PubMed] [Google Scholar]
- Liu C, Reppert SM. GABA synchronizes clock cells within the suprachiasmatic circadian clock. Neuron. 2000;25:123–128. doi: 10.1016/s0896-6273(00)80876-4. [DOI] [PubMed] [Google Scholar]
- Liu C, Weaver DR, Strogatz SH, Reppert SM. Cellular construction of a circadian clock: period determination in the suprachiasmatic nuclei. Cell. 1997;91:855–860. doi: 10.1016/s0092-8674(00)80473-0. [DOI] [PubMed] [Google Scholar]
- Liu X, Yu Q, Huang Z, Zwiebel LJ, Hall JC, Rosbash M. The strength and periodicity of D. melanogaster circadian rhythms are differentially affected by alterations in period gene expression. Neuron. 1991;6:753–766. doi: 10.1016/0896-6273(91)90172-v. [DOI] [PubMed] [Google Scholar]
- Meijer JH, Schaap J, Watanabe K, Albus H. Multiunit activity recordings in the suprachiasmatic nuclei: in vivo versus in vitro models. Brain Res. 1997;753:322–327. doi: 10.1016/s0006-8993(97)00150-9. [DOI] [PubMed] [Google Scholar]
- Meijer JH, Watanabe K, Schaap J, Albus H, Detari L. Light responsiveness of the suprachiasmatic nucleus: long-term multiunit and single-unit recordings in freely moving rats. J. Neurosci. 1998;18:9078–9087. doi: 10.1523/JNEUROSCI.18-21-09078.1998. [DOI] [PMC free article] [PubMed] [Google Scholar]
- Mintz B. Formation of genotypically mosaic mouse embryos. Am. J. Zool. 1962;4:432. [Google Scholar]
- Moore RY. Entrainment pathways and the functional organization of the circadian system. Prog. Brain Res. 1996;111:103–119. doi: 10.1016/s0079-6123(08)60403-3. [DOI] [PubMed] [Google Scholar]
- Mullen RJ, Whitten RK. Relationship of genotype and degree of chimerism in coat color to sex ratios and gametogenesis in chimeric mice. J. Exp. Zool. 1971;178:165–176. doi: 10.1002/jez.1401780203. [DOI] [PubMed] [Google Scholar]
- Mullen RJ, Herrup K. Chimeric analysis of mouse cerebellar mutants. In: Breakefield XO, editor. Neurogenetics: Genetic Approaches to the Nervous System. New York: Elsevier; 1979. pp. 173–196. [Google Scholar]
- Musci TS, Mullen RJ. Cell mixing in the spinal cords of mouse chimeras. Dev. Biol. 1992;152:133–144. doi: 10.1016/0012-1606(92)90163-b. [DOI] [PubMed] [Google Scholar]
- Nolan PM, Peters J, Strivens M, Rogers D, Hagan J, Spurr N, Gray IC, Vizor L, Brooker D, Whitehill E, et al. A systematic, genome-wide, phenotype-driven mutagenesis programme for gene function studies in the mouse. Nat. Genet. 2000;25:440–443. doi: 10.1038/78140. [DOI] [PubMed] [Google Scholar]
- Oster-Granite ML, Gearhart J. Cell lineage analysis of cerebellar Purkinje cells in mouse chimeras. Dev. Biol. 1981;85:199–208. doi: 10.1016/0012-1606(81)90251-7. [DOI] [PubMed] [Google Scholar]
- Page TL. Effects of optic-tract regeneration on internal coupling in the circadian system of the cockroach. J. Comp. Physiol. 1983;153:353–363. [Google Scholar]
- Pennartz CMA, De Jeu MTG, Geurtsen AMS, Sluiter AA, Hermes MLHJ. Electrophysiological and morphological heterogeneity of neurons in slices of rat suprachiasmatic nucleus. J. Physiol. 1998;506:775–793. doi: 10.1111/j.1469-7793.1998.775bv.x. [DOI] [PMC free article] [PubMed] [Google Scholar]
- Ralph MR, Foster RG, Davis F, Menaker M. Transplanted suprachiasmatic nucleus determines circadian period. Science. 1990;247:975–978. doi: 10.1126/science.2305266. [DOI] [PubMed] [Google Scholar]
- Rawles ME. Origin of pigment cells from the neural crest in the mouse embryo. Physiol. Zool. 1947;20:248–266. doi: 10.1086/physzool.20.3.30151958. [DOI] [PubMed] [Google Scholar]
- Rossant J, Spence A. Chimeras and mosaics in mouse mutant analysis. Trends Genet. 1998;14:358–363. doi: 10.1016/s0168-9525(98)01552-2. [DOI] [PubMed] [Google Scholar]
- Schwartz WJ, Gross RA, Morton MT. The suprachiasmatic nucleus contains a tetrodotoxin-resistant pacemaker. Proc. Natl. Acad. Sci. USA. 1987;84:1694–1698. doi: 10.1073/pnas.84.6.1694. [DOI] [PMC free article] [PubMed] [Google Scholar]
- Sidman RL. Mutations affecting the central nervous system in the mouse. In: Schmitt FO, Bird SJ, Bloom FE, editors. Molecular Genetic Neuroscience. New York: Raven Press; 1982. pp. 389–400. [Google Scholar]
- Silver R, Lehman MN, Gibson M, Gladstone WR, Bittman EL. Dispersed cell suspensions of fetal SCN restore circadian rhythmicity in SCN-lesioned adult hamsters. Brain Res. 1990;525:45–58. doi: 10.1016/0006-8993(90)91319-c. [DOI] [PubMed] [Google Scholar]
- Silver R, LeSauter J, Tresco PA, Lehman MN. A diffusible coupling-signal from the transplanted SCN controlling circadian locomotor rhythms. Nature. 1996;382:810–813. doi: 10.1038/382810a0. [DOI] [PubMed] [Google Scholar]
- Silver R, Sookhoo AI, LeSauter J, Stevens P, Jansen HT, Lehman MN. Multiple regulatory elements result in regional specificity in circadian rhythms of neuropeptide expression in mouse SCN. Neuroreport. 1999;10:3165–3174. doi: 10.1097/00001756-199910190-00008. [DOI] [PubMed] [Google Scholar]
- Sokolove PG, Bushell WN. The chi square periodogram: its utility for analysis of circadian rhythms. J. Theor. Biol. 1978;72:131–160. doi: 10.1016/0022-5193(78)90022-x. [DOI] [PubMed] [Google Scholar]
- Steeves TD, King DP, Zhao Y, Sangoram AM, Du F, Bow-cock AM, Moore RY, Takahashi JS. Molecular cloning and characterization of the human CLOCK gene: expression in the suprachiasmatic nuclei. Genomics. 1999;57:189–200. doi: 10.1006/geno.1998.5675. [DOI] [PubMed] [Google Scholar]
- Takahashi JS, Menaker M. Role of the suprachiasmatic nuclei in the circadian system of the house sparrow, Passer domesticus. J. Neurosci. 1982;2:815–828. doi: 10.1523/JNEUROSCI.02-06-00815.1982. [DOI] [PMC free article] [PubMed] [Google Scholar]
- Takahashi JS, Pinto LH, Vitaterna MH. Forward and reverse genetic approaches to behavior. Science. 1994;264:1724–1732. doi: 10.1126/science.8209253. [DOI] [PMC free article] [PubMed] [Google Scholar]
- Tarkowski AK. Mouse chimaeras developed from fused eggs. Nature. 1961;190:857–860. doi: 10.1038/190857a0. [DOI] [PubMed] [Google Scholar]
- van den Pol AN, Powley T. A fine-grained anatomical analysis of the rat suprachiasmatic nucleus in circadian rhythms of feeding and drinking. Brain Res. 1979;160:307–326. doi: 10.1016/0006-8993(79)90427-x. [DOI] [PubMed] [Google Scholar]
- Vitaterna MH, King DP, Chang A-M, Kornhauser JM, Lowrey PL, McDonald JD, Dove WF, Pinto LH, Turek FW, Takahashi JS. Mutagenesis and mapping of a mouse gene, Clock essential for circadian behavior. Science. 1994;264:719–725. doi: 10.1126/science.8171325. [DOI] [PMC free article] [PubMed] [Google Scholar]
- Vogelbaum MA, Menaker M. Temporal chimeras produced by hypothalamic transplants. J. Neurosci. 1992;12:3619–3627. doi: 10.1523/JNEUROSCI.12-09-03619.1992. [DOI] [PMC free article] [PubMed] [Google Scholar]
- Welsh DK, Logothetis DE, Meister M, Reppert SM. Individual neurons dissociated from rat suprachiasmatic nucleus express independently phased circadian firing rhythms. Neuron. 1995;14:697–706. doi: 10.1016/0896-6273(95)90214-7. [DOI] [PubMed] [Google Scholar]
- Yamazaki S, Numano R, Abe M, Hida A, Takahashi R-I, Ueda M, Block GD, Sakaki Y, Menaker M, Tei H. Resetting central and peripheral circadian oscillators in transgenic rats. Science. 2000;288:682–685. doi: 10.1126/science.288.5466.682. [DOI] [PubMed] [Google Scholar]
- Zambrowicz BP, Imamoto A, Fiering S, Herzenberg LA, Kerr WG, Soriano P. Disruption of overlapping transcripts in the ROSA geo 26 gene trap strain leads to widespread expression of β-galactosidase in mouse embryos and hematopoietic cells. Dev. Biol. 1997;94:3789–3794. doi: 10.1073/pnas.94.8.3789. [DOI] [PMC free article] [PubMed] [Google Scholar]
- Zhang L, Aguilar-Roblero R. Asymmetrical electrical activity between the suprachiasmatic nuclei in vitro. Neurore. 1995 doi: 10.1097/00001756-199502000-00032. [DOI] [PubMed] [Google Scholar]
Associated Data
This section collects any data citations, data availability statements, or supplementary materials included in this article.