

Abstract
Short leukocyte telomere length (LTL) is associated with atherosclerosis in adults and diminished survival in the elderly. LTL dynamics are defined by LTL at birth, which is highly variable, and its age-dependent attrition thereafter, which is rapid during the first 20 years of life. We examined whether age-dependent LTL attrition during adulthood can substantially affect individuals’ LTL ranking (e.g., longer or shorter LTL) in relation to their peers. We measured LTL in samples donated 12 years apart on average by 1156 participants in four longitudinal studies. We observed correlations of 0.91–0.96 between baseline and follow-up LTLs. Ranking individuals by deciles revealed that 94.1% (95% confidence interval of 92.6–95.4%) showed no rank change or a 1 decile change over time. We conclude that in adults, LTL is virtually anchored to a given rank with the passage of time. Accordingly, the links of LTL with atherosclerosis and longevity appear to be established early in life. It is unlikely that lifestyle and its modification during adulthood exert a major impact on LTL ranking.
Keywords: human, leukocytes, longitudinal, Southern blots, telomeres
Introduction
In the general population, short telomere length (TL) in leukocytes is associated with increased risk of atherosclerosis and predicts diminished survival in the elderly (Aviv, 2012). In addition, telomeropathies are typically presented with short leukocyte telomere length (LTL). These include rare monogenic diseases such as dyskeratosis congenita, which stems from catastrophic mutations in telomere-regulating genes, and more common diseases, for example, pulmonary fibrosis and some forms of aplastic anemia (Armanios, 2009; Calado … Young, 2009; Walne et al., 2012). The question that follows is to what extent can the interindividual variation in age-dependent LTL attrition during adulthood explain the wide range of LTL among persons of similar age and the associations of LTL with atherosclerosis and longevity in the population at large. Smoking (Valdes et al., 2005; Vasan et al., 2008; Mirabello et al., 2009; Du et al., 2012), high body mass index (BMI; Valdes et al., 2005), and sedentary life style (Cherkas et al., 2008; Du et al., 2012) have been shown in some studies to be associated with a shorter LTL. Because reverse causality, for example, a short LTL drives people to smoke, is unlikely, these and other unhealthy forms of lifestyle might accelerate the rate of age-dependent LTL attrition. Although a number of longitudinal studies, ranging from 6 months to 13 years (Gardner et al., 2005; Aviv et al., 2009; Ehrlenbach et al., 2009; Nordfjäll et al., 2009; Farzaneh-Far et al., 2010; Chen et al., 2011; Svenson et al., 2011; Kark et al., 2012), have been performed with the goal of measuring the individual’s rate of LTL attrition, they have not directly addressed the fundamental question of whether LTL attrition during adulthood can substantially affect individuals’ LTL ranking (e.g., longer or shorter LTL) in relation to their peers. In addition, commercial entities have been promoting the measurements of LTL by suggesting that lifestyle changes and behavioral modifications (e.g., regular exercise, stopping smoking, reducing weight) might help individuals with a short LTL manage their ‘biological aging’ by slowing down their rate of LTL attrition (Leslie, 2011). For these reasons, we examined the tracking and ranking of LTL in subjects from four longitudinal studies that jointly covered 6 decades of adult life. Our conclusion is that the overwhelming majority of individuals maintain their LTL ranking during adulthood, that is, their LTL ranking is ostensibly fixed prior to adulthood.
Results
Subject characteristics
Leukocyte telomere length was measured on two occasions, at baseline and follow-up examinations in 1156 adult (44% women) in four studies: in Israel, the Jerusalem Lipid Research Clinic (LRC; Kark et al., 2012); in the USA, the Bogalusa Heart Study (BHS; Aviv et al., 2009); in France, the Evolution de la Rigidite Arterielle (ERA; Benetos et al., 2001); and in Denmark, the Longitudinal Study of Aging Danish Twins (LSADT; Bathum et al., 2001). The mean ages at the baseline examination and the duration of follow-up for participants from the four groups studied were as follows: LRC, 30 years/13 years; the BHS, 31 years /12.4 years; the ERA, 58 years/9.5 years; and the LSADT, 75 years /10.8 years (Table 1). Variation in the mean LTL at baseline and follow-up between the study samples reflected the age differences of their participants. The average rate of LTL attrition ranged between 23.6 and 31.2 base pairs (bp) per year and was not dependent on the age of the cohort (Table 1). Overall, participants from the LRC, BHS, and ERA showed a higher mean BMI at follow-up versus baseline examinations, while the elderly participants of the LSADT displayed the opposite trend. In all groups, the percentage of smokers was lower at follow-up than at the baseline examinations.
Table 1.
Characteristics of the 4 cohorts
| Cohorts | |||||
|---|---|---|---|---|---|
| Parameter | All | LRC | BHS | ERA | LSADT |
| N | 1156 | 620 | 271 | 185 | 80 |
| Females % | 44 | 33 | 66 | 33 | 70 |
| Age (years) | |||||
| Baseline | 38 ± 15 | 30 ± 1 | 31 ± 5 | 58 ± 10 | 75 ± 2 |
| Follow-up | 50 ± 14 | 43 ± 1 | 43 ± 4 | 68 ± 10 | 86 ± 2 |
| Follow-up duration | 12.1 ± 1.7 | 13.0 ± 0.8 | 12.4 ± 1.8 | 9.5 ± 0.5 | 10.8 ± 0.0 |
| LTL (kb) | |||||
| Baseline | 7.06 ± 0.81 | 7.34 ± 0.67 | 7.22 ± 0.73 | 6.45 ± 0.56 | 5.85 ± 0.60 |
| Follow-up | 6.73 ± 0.77 | 7.00 ± 0.63 | 6.83 ± 0.72 | 6.23 ± 0.54 | 5.51 ± 0.64 |
| LTL attrition (bp/year) | 27.3 ± 16.8 | 25.7 ± 14.8 | 32.2 ± 17.8 | 23.6 ± 15.6 | 31.2 ± 24 |
| BMI (Kg/m2) | |||||
| Baseline | 25.7 ± 4.8 | 24.8 ± 3.7 | 27.0 ± 6.7 | 26.5 ± 4.2 | 26.5 ± 4.1 |
| Follow-up | 27.6 ± 5.4 | 27.2 ± 4.6 | 29.8 ± 7.3 | 26.8 ± 4.3 | 24.9 ± 3.7 |
| Difference | 1.88 ± 3.14 | 2.36 ± 2.62 | 2.76 ± 3.73 | 0.33 ± 1.66 | −1.60 ± 3.62 |
| Smoking (%) | |||||
| Baseline | 31 | 37 | 31 | 15 | 23 |
| Follow-up | 23 | 28 | 22 | 10 | 11 |
Tracking
Leukocyte telomere length showed robust tracking in the four cohorts, such that individuals with a relatively longer (or a shorter) LTL at baseline also showed a relatively longer (or a shorter) LTL at follow-up (Fig. 1). The Pearson correlations were as follows: LRC, r = 0.96; BHS, r = 0.95; ERA, r = 0.96; and LSADT, r = 0.91. The correlation for the LSADT significantly differed from those of the other three cohorts (P < 0.05).
Figure 1.
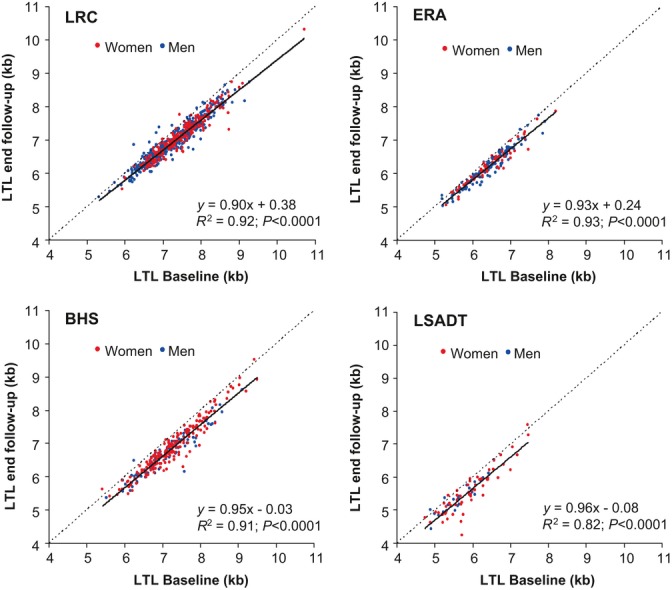
Tracking of leukocyte telomere length (LTL) between baseline and follow-up examinations. Correlation between baseline LTL and follow-up LTL in the Jerusalem Lipid Research Clinic (LRC), the Bogalusa Heart Study (BHS), the Evolution de la Rigidite Arterielle (ERA), and the Longitudinal Study of Elderly Danish Twins (LSADT). The dotted lines are the identity lines, while the continuous lines are the linear regressions of the data. The R2 (based on Pearson correlations) ranged from 0.82 for the LSADT to 0.93 for the ERA.
Ranking
To further examine tracking in the context of the ranking of the individual’s LTL among his/her peers, we divided the LTL distributions at baseline and follow-up examinations into deciles (Fig. 2, left panel) and examined LTL rank changes in the 4 cohorts combined by decile for the entire LTL distribution (Fig. 2, right panel) and for each decile (Fig. 3, Table S1). These data were also examined separately for each of the four cohorts (Fig. S1 and Table S2). In addition, we also examined LTL rank changes by subdividing the LTL distributions at baseline and follow-up examinations into 0.5-kb increments and examined rank changes accordingly in the four cohorts combined (Fig. S2 and Table S3).
Figure 2.
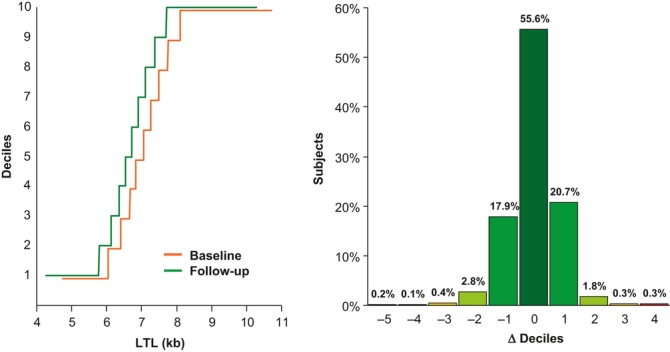
Ranking of leukocyte telomere length (LTL) by deciles for the baseline and follow-up examinations (left panel) and the percentage of subjects experiencing change (Δ) in decile rank at follow-up examination (right panel). Data are from all cohorts jointly. Left panel shows shift to a shorter LTL between baseline and follow-up examinations for each decile. Right panel shows the distribution of Δ between baseline and follow-up examinations. Negative sign denotes a downward shift in ranking, while positive sign indicates an upward shift in ranking. Additional data regarding individual cohorts are provided online in Supplementary Information, Fig. S1, and Table S2 (Supporting information).
Figure 3.
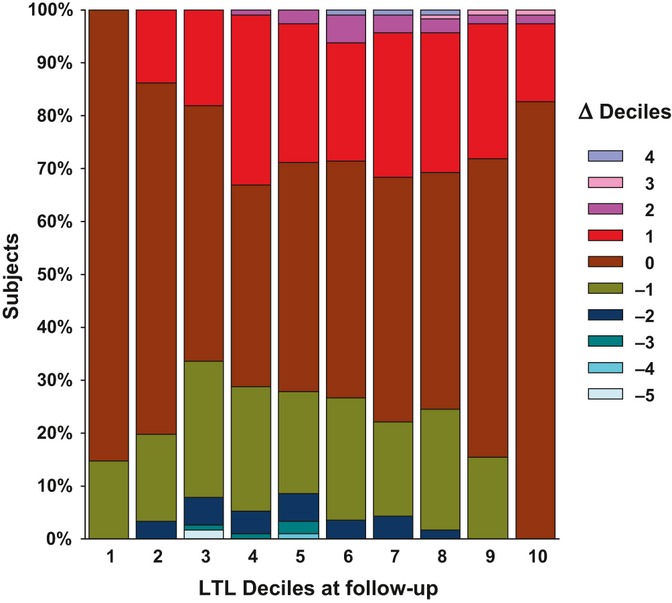
The percentage of subjects in each decile experiencing change (Δ) in rank at follow-up examination. Data are from all cohorts jointly. The following are illustrations of the display: consider decile # 1 (the lowest decile), 14.7% of individuals ranked in this decile at follow-up were ranked in decile #2 at baseline (i.e., one decile downward shift). Now consider decile 2, 16.4% of individuals ranked in this decile at follow-up were ranked at baseline in decile #3 (i.e., one decile downward shift), 3.4% were ranked in decile # 4 (i.e., two deciles downward shift), and 13.8% in decile #1 (i.e., one decile upward shift). The same principle holds across all deciles.
Shifts in LTL ranking by one decile up or down are expected to be quite common between baseline and follow-up examinations, that is, because individuals at the interface between two LTL deciles can readily oscillate up/down by one decile, even in the presence of tiny differences in their age-dependent LTL attrition and small measurement error of LTL. Thus, a key appraisal for change in LTL ranking is a ≥ 2 decile shift between the baseline and follow-up examinations.
Jointly, for all deciles and study cohorts, individuals largely maintained their ranks between baseline and follow-up examinations with 55.6% unchanged, 38.6% showing an increase/decrease of one decile (20.7% up/17.9% down), and only 5.9% showing a change of 2 or more deciles in either direction (2.4% up/3.5% down) (Fig. 2, right panel). Thus, 94.1% (95% confidence interval of 92.6–95.4%) showed no change in rank or a change of 1 decile.
When changes in LTL ranking were analyzed by LTL deciles at follow-up, there was a striking stability in the ranking of individuals in the 1st and 2nd deciles, that is, the lower range of the LTL distribution and in the 9th and 10th deciles, that is, the higher range of the LTL distribution (Fig. 3, Table S1). Individuals whose LTL was in the midrange of the distribution also showed stability in their ranking, because only infrequently they experienced a ≥ 2 decile shift between the baseline and follow-up examinations.
Similar results were observed when each cohort was analyzed separately (Fig. S1 and Table S2), and when the baseline and follow-up LTL distributions were subdivided by 0.5-kb increments: 37.4% of the subjects did not change their rank and 57.8% changed rank by only 0.5 kb (Fig. S2 and Table S3).
The effects of age, sex, smoking, and BMI on ranking
The determinants of the LTL ranking at the follow-up examination were evaluated in a model that included baseline LTL ranking, age, sex, smoking (yes/no), and BMI. LTL ranking at baseline examination was the most important ranking determinant at follow-up examination (regression coefficient (RC) = 0.96 ± 0.01 (SEM), R2 = 91.3%, P < 0.0001). Sex (RC = −0.11 ± 0.05, R2 = 0.03%, P =0.04) and smoking at baseline (RC = −0.15 ± 0.05, R2 = 0.06%, P =0.005) showed minor but statistically significant effects. Age and BMI at baseline exerted no significant effect on ranking at the follow-up examination.
We further examined the effect of change in smoking status on LTL attrition and ranking between baseline and follow-up examinations. As the periods between the two examinations were not identical among participants within a given study and across studies, we also examined the impact of smoking status on LTL shortening with adjustment for follow-up years (Table 2). Overall, smoking was associated with slightly heightened LTL attrition between baseline and follow-up. It also was associated with a small downward shift in ranking between the baseline and follow-up examinations. We observed no significant effect of change in BMI on LTL attrition or ranking in this study.
Table 2.
The association of change in smoking status during follow-up with change in LTL
| ANOVA P-value* | 0.004 | 0.006 | 0.057 | ||
|---|---|---|---|---|---|
| Baseline | Follow up | N | Δ LTL (kb) | Δ LTL/year (bp) | Δ Decile LTL |
| No | No | 750 | 0.317 ± 0.007 | 26.2 ± 0.6 | 0.053 ± 0.031 |
| No | Yes | 45 | 0.352 ± 0.030 | 28.6 ± 2.5 | −0.015 ± 0.127 |
| Yes | No | 145 | 0.380 ± 0.017** | 31.3 ± 1.4** | −0.125 ± 0.071 |
| Yes | Yes | 216 | 0.345 ± 0.014 | 28.1 ± 1.1 | −0.077 ± 0.058 |
Values are age- and sex-adjusted.
LTL, leukocyte telomere length.
Overall smoking comparison for each outcome.
P <0.05 vs. No-No smoking. No significant difference between the groups Yes-No and Yes-Yes. Values are mean ± SD.
Discussion
Our findings indicate that the individual’s LTL is virtually anchored to a given LTL rank as he/she moves across the adult life course. This is remarkably evident for individuals in the extreme deciles of the distribution. Individuals ranked at the 1st and 10th deciles can shift rank only unidirectionally, that is, upward and downward, respectively. Still, at follow-up, no individual ranked in the 1st decile at baseline exhibited a ≥ 2 decile upward shift and similarly only 1.8% of individuals ranked in the 10th decile at baseline showed a ≥ 2 decile downward shift.
These findings challenge the conventional paradigm that links variation in LTL dynamics during adult life to human aging and aging-related diseases (Aviv, 2012). The basis for this paradigm is that inflammation and oxidative stress are distinctive features of atherosclerosis and aging in general. Chronic inflammation entails an increase in leukocyte turnover, which is perpetuated by pro-inflammatory factors and sustained by increased replication of hematopoietic stem cells (HSCs). As telomerase, the reverse transcriptase that adds telomere repeats to the ends of chromosomes, is largely repressed in somatic cells, including HSCs (Broccoli et al., 1995; Chiu et al., 1996; Yui et al., 1998), more frequent HSC replication would augment the rate of LTL shortening. While inflammation impacts LTL attrition through the number of HSC replications, oxidative stress might interfere with telomere biology, because the G triplets of telomeres, which in mammals comprise repeats of TTAGGG nucleotide sextets, are highly sensitive to the hydroxyl radical (Houben et al., 2008).
This prevailing view considers LTL as a biomarker of the cumulative burden of inflammation and oxidative stress. It is based on the premise that LTL attrition proceeds in tandem with the accruing burden of inflammation/oxidative stress and predicts the progression of atherosclerosis. Thus, a shorter LTL reflects a higher cumulative burden of inflammation and oxidative stress, increased atherosclerotic risk, and diminished survival. However, our analysis of LTL dynamics does not support such a paradigm. This analysis suggests that most of the interindividual variation in LTL among adults arises early in life, because the ranking of individuals according to their LTL barely changes across 6 decades of adult life.
A constellation of findings support this supposition, including the following: (i) the range of the distribution of LTL at birth amounts to ∼5000 bp (Okuda et al., 2002; Akkad et al., 2006); (ii) LTL undergoes extremely rapid attrition early in life in humans (Frenck et al., 1998; Sidorov et al., 2009; Aubert et al., 2012) and other mammals (Baerlocher et al., 2007; Benetos et al., 2011), and by the age of 20 years, human LTL has shortened by approximately 3000 bp; and (iii) on the average, the rate of LTL shortening during adult life amounts to only ∼ 30 bp/year, although with a wide interindividual variation (as shown in Table 1). It is reasonable to propose therefore that the main determinants of LTL in adulthood are LTL at birth and its attrition during the first 20 years of life. This premise is further supported by the finding that the gap in TL between leukocytes, that is, LTL, and TLs in minimally proliferative tissues such as skeletal muscle and subcutaneous fat is established during the first two decades of the human life course (Daniali et al., 2013). Accordingly, in many individuals, a short LTL is an early antecedent of health outcomes in adult life. Although environmental factors and lifestyle might alter the rate of LTL attrition during adult life (Valdes et al., 2005; Cherkas et al., 2008; Vasan et al., 2008; Mirabello et al., 2009; Du et al., 2012), their overall impact on the individual’s LTL (and his/her ranking across the adult lifespan) is expected to be modest compared with the effects of LTL at birth and its attrition during growth and development. This is displayed in the present study with respect to the effects of smoking. To put the smoking effect in perspective, whether or not statistically significant, on average smoking (at baseline, follow-up or both examinations) was associated with acceleration of the rate of LTL attrition by ∼ 3 bp/year and a downward shift of ∼ 0.1 LTL decile ranking between baseline and follow-up examinations (Table 2). Everything else being equal, and assuming causality, it would take 120 years (the average period of ∼ 12 years of follow-up × 10) of smoking to bring about a downward shift of 1 LTL decile.
That being said, the present study was not primarily designed to explore the impact of lifestyle and environmental factors on LTL tracking and ranking. What is more, the absolute TL might not be the only factor through which telomere biology exerts an impact on human aging and disease. Telomeres do not have to be critically short, or even shorter than the average TL in a given cell, to trigger cellular senescence. As double-stranded DNA breaks in telomeres are irreparable, potentially even long telomeres could become dysfunctional in response to genotoxic stresses such as hydroxyl radicals (Fumagalli et al., 2012). This could result in an increased accumulation of senescent cells with dysfunctional telomeres in tissue and consequently facilitate aging and disease development in the absence of significant telomere erosion. Indeed, an aging-associated increase in cells displaying dysfunctional telomeres that, on average, were not shorter compared with other telomeres in the same tissue was observed in postmitotic cells of mice and nonhuman primates (Fumagalli et al., 2012). Therefore, even a relatively small amount of telomere attrition during adulthood might tip the balance from health to disease without altering the individual’s ranking.
The low measurement error of LTL by Southern blots of the terminal restriction fragments (TRFs; Kimura et al., 2010; Aviv et al., 2011), the method used to measure LTL in this study, and a sample size of 1156 individuals bolster the validity of our findings. However, ideally, tracking and ranking of LTL with a view to understanding human LTL dynamics (LTL at birth and its age-dependent attrition) should include repeated measurements of LTL in the same individuals followed from birth onward, covering the entire human lifespan. Nonetheless, based on our analysis of four different cohorts, which together cover a broad segment of the adult lifespan, it is evident that close tracking of LTL in adults is the rule.
A main cause of mortality and morbidity in the elderly is atherosclerotic cardiovascular disease. As the proportion of elderly persons is increasing in most modern societies, the quest to understand the mechanisms whereby LTL dynamics explain some of the interindividual variation in susceptibility to atherosclerosis and in survival is pertinent to population health. However, we suggest that to gain further insight into the LTL-aging nexus in humans, future research should also focus on the mechanisms that fashion LTL at birth and its rate of shortening during infancy and childhood. In this context, a recent study showed that in zebra finches, TL at the age of 25 days strongly predicted lifespan (Heidinger et al., 2012).
Finally, there is a compelling reason for TL measurements in diagnosing telomeropathies (Armanios, 2009; Calado … Young, 2009; Walne et al., 2012). However, the value of LTL measurements in the general population is uncertain. Commercial entities offer these measurements to physicians and the public under the assumption that individuals with a short LTL must have an accelerated age-dependent LTL attrition and that lifestyle modification, such as smoking cessation and regular exercise, might attenuate the rate of LTL attrition. We do not doubt that healthy lifestyle changes can reduce one’s cardiovascular risk and affect longevity, but argue against the view that these outcomes are mediated primarily through LTL change in adulthood.
Experimental procedures
Measurements of LTL
Leukocyte telomere length was measured by Southern blots of the TRFs, as previously described (Kimura et al., 2010). Briefly, DNA integrity was verified in all samples. To this end, samples (10 ng each) were resolved on a 1% (wt/vol) agarose gel. The TRFs were generated by 16-hour digestion (37°C) using restriction enzymes HinfI and RsaI. A 0.6% (wt/vol) agarose gel, which allows a greater resolution of shorter telomeres, was used in LTL measurements of the elderly participants in the LSADT. A 0.5% (wt/vol) agarose gel was used in LTL measurements of participants in the LRC, the BHS, and the ERA. Each sample was measured in duplicate (3 μg DNA/run) on different occasions (performed on different gels).
Personnel in the laboratory that measured LTLs were ‘blind’ with respect to participants. Only numerically coded samples were provided to the laboratory. For longitudinal evaluations, the laboratory was also provided with designations, such A and B, to indicate that samples belong to the same individual. However, such designations varied between baseline and follow-up samples. The baseline and follow-up samples from each individual were run in adjacent lanes, as shown in the illustrative gel (Fig. 4). The interassay coefficient of variations (CV%) was LRC = 2.2%; BHS = 2.4%; ERA = 2.1%; and LSADT = 2.4%.
Figure 4.
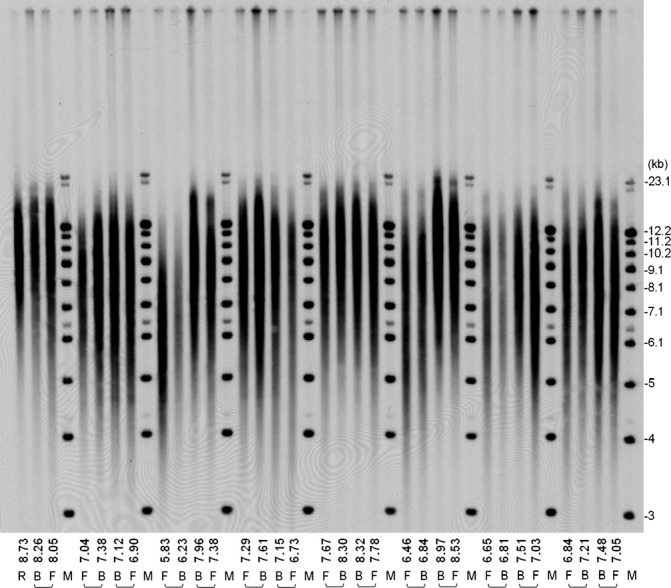
Illustrative gel of Southern blots of the terminal restriction fragments (TRFs) from the Jerusalem Lipid Research Clinic study. A sample of known TRF length serves as an internal reference (R). Eight molecular weight (M) ladders are resolved at intervals across the gel, and the one that is closest to a given sample is used for the computation of the mean TRF for that sample. Baseline (B) and follow-up (F) of the mean TRFs (i.e., leukocyte telomere lengths) are shown (in kb) at the bottom of the lanes.
Statistical analysis
Pearson correlations and linear regression were used to assess associations between LTL measurements. Deciles of LTL values for individuals in each cohort and for individuals in all cohorts combined were created to measure the individual’s change in rank between the baseline measurement and that at the follow-up. All subjects were also classified by individual changes in 0.5-kb LTL categories. The determinants of the LTL ranking at the follow-up examination were assessed using multiple regression analysis, including in the model the baseline LTL ranking, age, sex, present smoking (yes/no), and BMI. Correlation coefficients (baseline vs. follow-up LTLs) between cohorts were compared with a chi-squared test. One-way ANOVA, followed by a Fisher’s multiple-comparison test, was used to determine the effect of smoking status (adjusted for age and sex) on LTL attrition and change in LTL decile ranking.
Acknowledgments
This work has been supported by NIH grants AG16592, AG030678, the US-Israel Binational Science Foundation, the Israel Science Foundation, the Fondation pour la Recherche Medicale (FRM DCV- 20070409250), the Caisse Nationale d’Assurance Maladie; the Agence Nationale de la Recherche (ANR 09-GENO-010-01) and the Plan Pluri-Formation (French Ministry of Research). The Danish Twin Registry is supported by a grant from The National Program for Research Infrastructure, and the Danish Aging Research Center is supported by a grant from the VELUX foundation.
Author contributions
Athanase Benetos, MD, PhD, and Jeremy D. Kark, MD, PhD, participated in study design, collected and analyzed data, and participated in writing of the manuscript; Ezra Susser, MD, PhD, and Utz Herbig, PhD, participated in writing of the manuscript; Masayuki Kimura, MD, PhD, measured LTL; Ronit Sinnreich, PhD, collected and analyzed data; Wei Chen, PhD, Troels Steenstrup, PhD, and Jacob v. B. Hjelmborg, PhD, analyzed data; Kaare Christensen, MD, PhD, Sathanur R. Srinivasan, PhD, and Gerald S. Berenson, MD, collected data; Carlos Labat, BSc, analyzed data and participated in writing of the manuscript; and Abraham Aviv, MD, oversaw the oversaw design, data analysis, and writing of the manuscript.
Supporting Information
Additional Supporting Information may be found in the online version of this article at the publisher’s web-site.
Table S1 Percentage of subjects experiencing change (Δ) in decile rank at follow-up examination in the four chorts jointly.
Table S2 Percentage of subjects experiencing change (Δ) in decile rank at follow-up examination in each of the four cohorts.
Table S3 Percentage of subjects experiencing change (Δ) in LTL rank at follow-up examination (each rank corresponding to 0.5 kb) in the four cohorts jointly.
Fig S1 Percentage of subjects experiencing change (Δ) in decile rank at follow-up examination in each of the four cohorts.
Fig S2 Number of subjects experiencing changes in LTL ranking at follow-up (each rank corresponding to a 0.5 kb) in the four cohorts jointly.
References
- Akkad A, Hastings R, Konje JC, Bell SC, Thurston H, Williams B. Telomere length in small-for-gestational-age babies. BJOG. 2006;113:318–323. doi: 10.1111/j.1471-0528.2005.00839.x. [DOI] [PubMed] [Google Scholar]
- Armanios M. Syndromes of telomere shortening. Annu. Rev. Genomics Hum. Genet. 2009;10:45–61. doi: 10.1146/annurev-genom-082908-150046. [DOI] [PMC free article] [PubMed] [Google Scholar]
- Aubert G, Baerlocher GM, Vulto I, Poon SS, Lansdorp PM. Collapse of telomere homeostasis in hematopoietic cells caused by heterozygous mutations in telomerase genes. PLoS Genet. 2012;8:e1002696. doi: 10.1371/journal.pgen.1002696. [DOI] [PMC free article] [PubMed] [Google Scholar]
- Aviv A. Genetics of leukocyte telomere length and its role in atherosclerosis. Mutat. Res. 2012;730:68–74. doi: 10.1016/j.mrfmmm.2011.05.001. [DOI] [PMC free article] [PubMed] [Google Scholar]
- Aviv A, Chen W, Gardner JP, Kimura M, Brimacombe M, Cao X, Srinivasan SR, Berenson GS. Leukocyte telomere dynamics: longitudinal findings among young adults in the Bogalusa Heart Study. Am. J. Epidemiol. 2009;169:323–329. doi: 10.1093/aje/kwn338. [DOI] [PMC free article] [PubMed] [Google Scholar]
- Aviv A, Hunt SC, Lin J, Cao X, Kimura M, Blackburn E. Impartial comparative analysis of measurement of leukocyte telomere length/DNA content by Southern blots and qPCR. Nucleic Acids Res. 2011;39:e134. doi: 10.1093/nar/gkr634. [DOI] [PMC free article] [PubMed] [Google Scholar]
- Baerlocher GM, Rice K, Vulto I, Lansdorp PM. Longitudinal data on telomere length in leukocytes from newborn baboons support a marked drop in stem cell turnover around 1 year of age. Aging Cell. 2007;6:121–123. doi: 10.1111/j.1474-9726.2006.00254.x. [DOI] [PubMed] [Google Scholar]
- Bathum L, Petersen HC, Rosholm JU, Hyltoft Petersen P, Vaupel J, Christensen K. Evidence for a substantial genetic influence on biochemical liver function test: results from a population based Danish twin study. Clin. Chem. 2001;47:81–87. [PubMed] [Google Scholar]
- Benetos A, Okuda K, Lajemi M, Kimura M, Thomas F, Skurnick J, Labat C, Bean K, Aviv A. Telomere length as an indicator of biological aging: the gender effect and relation with pulse pressure and pulse wave velocity. Hypertension. 2001;37:381–385. doi: 10.1161/01.hyp.37.2.381. [DOI] [PubMed] [Google Scholar]
- Benetos A, Kimura M, Labat C, Buchoff GM, Huber S, Labat L, Lu X, Aviv A. A model of canine leukocyte telomere dynamics. Aging Cell. 2011;10:991–995. doi: 10.1111/j.1474-9726.2011.00744.x. [DOI] [PMC free article] [PubMed] [Google Scholar]
- Broccoli D, Young JW, de Lange T. Telomerase activity in normal and malignant hematopoietic cells. Proc. Natl Acad. Sci. USA. 1995;92:9082–9086. doi: 10.1073/pnas.92.20.9082. [DOI] [PMC free article] [PubMed] [Google Scholar]
- Calado RT, Young NS. Telomere diseases. N. Engl. J. Med. 2009;361:2353–2365. doi: 10.1056/NEJMra0903373. [DOI] [PMC free article] [PubMed] [Google Scholar]
- Chen W, Kimura M, Kim S, Cao X, Srinivasan SR, Berenson GS, Kark JD, Aviv A. Longitudinal versus cross-sectional evaluations of leukocyte telomere length dynamics: age-dependent telomere shortening is the rule. J. Gerontol. A Biol. Sci. Med. Sci. 2011;66:312–319. doi: 10.1093/gerona/glq223. [DOI] [PMC free article] [PubMed] [Google Scholar]
- Cherkas LF, Hunkin JL, Kato BS, Richards JB, Gardner JP, Surdulescu GL, Kimura M, Lu X, Spector TD, Aviv A. The association between physical activity in leisure time and leukocyte telomere length. Arch. Intern. Med. 2008;168:154–158. doi: 10.1001/archinternmed.2007.39. [DOI] [PubMed] [Google Scholar]
- Chiu CP, Dragowska W, Kim NW, Vaziri H, Yui J, Thomas TE, Harley CB, Lansdorp PM. Differential expression of telomerase activity in hematopoietic progenitors from adult human bone marrow. Stem Cells. 1996;14:239–248. doi: 10.1002/stem.140239. [DOI] [PubMed] [Google Scholar]
- Daniali L, Benetos A, Susser E, Kark JD, Labat C, Kimura M, Desai K, Granick M, Aviv A. Telomeres shorten at equivalent rates in somatic tissues of adults. Nat Commun. 2013;4:1597. doi: 10.1038/ncomms2602. [DOI] [PMC free article] [PubMed] [Google Scholar]
- Du M, Prescott J, Kraft P, Han J, Giovannucci E, Hankinson SE, De Vivo I. Physical activity, sedentary behavior, and leukocyte telomere length in women. Am. J. Epidemiol. 2012;175:414–422. doi: 10.1093/aje/kwr330. [DOI] [PMC free article] [PubMed] [Google Scholar]
- Ehrlenbach S, Willeit P, Kiechl S, Willeit J, Reindl M, Schanda K, Kronenberg F, Brandstätter A. Influences on the reduction of relative telomere length over 10 years in the population-based Bruneck Study: introduction of a well-controlled high-throughput assay. Int. J. Epidemiol. 2009;38:1725–1734. doi: 10.1093/ije/dyp273. [DOI] [PubMed] [Google Scholar]
- Farzaneh-Far R, Lin J, Epel E, Lapham K, Blackburn E, Whooley MA. Telomere length trajectory and its determinants in persons with coronary artery disease: longitudinal findings from the heart and soul study. PLoS One. 2010;5:e8612. doi: 10.1371/journal.pone.0008612. [DOI] [PMC free article] [PubMed] [Google Scholar]
- Frenck RW, Blackburn EH, Shannon KM. The rate of telomere sequence loss in human leukocytes varies with age. Proc. Natl Acad. Sci. USA. 1998;95:5607–5610. doi: 10.1073/pnas.95.10.5607. [DOI] [PMC free article] [PubMed] [Google Scholar]
- Fumagalli M, Rossiello F, Clerici M, Barozzi S, Cittaro D, Kaplunov JM, Bucci G, Dobreva M, Matti V, Beausejour CM, Herbig U, Longhese MP, d’Adda di Fagagna E. Telomeric DNA damage is irreparable and causes persistent DNA-damage-response activation. Nat. Cell Biol. 2012;14:355–365. doi: 10.1038/ncb2466. [DOI] [PMC free article] [PubMed] [Google Scholar]
- Gardner JP, Li S, Srinivasan SR, Chen W, Kimura M, Lu X, Berenson GS, Aviv A. Rise in insulin resistance is associated with escalated telomere attrition. Circulation. 2005;111:2171–2177. doi: 10.1161/01.CIR.0000163550.70487.0B. [DOI] [PubMed] [Google Scholar]
- Heidinger BJ, Blount JD, Boner W, Griffiths K, Metcalfe NB, Monaghan P. Telomere length in early life predicts lifespan. Proc. Natl Acad. Sci. USA. 2012;109:1743–1748. doi: 10.1073/pnas.1113306109. [DOI] [PMC free article] [PubMed] [Google Scholar]
- Houben JM, Moonen HJ, van Schooten FJ, Hageman GJ. Telomere length assessment: biomarker of chronic oxidative stress? Free Radic. Biol. Med. 2008;44:235–246. doi: 10.1016/j.freeradbiomed.2007.10.001. [DOI] [PubMed] [Google Scholar]
- Kark JD, Goldberger N, Kimura M, Sinnreich R, Aviv A. Energy intake and leukocyte telomere length in young adults. Am. J. Clin. Nutr. 2012;95:479–487. doi: 10.3945/ajcn.111.024521. [DOI] [PMC free article] [PubMed] [Google Scholar]
- Kimura M, Stone RC, Hunt SC, Skurnick J, Lu X, Cao X, Harley CB, Aviv A. Measurement of telomere length by the Southern blot analysis of terminal restriction fragment lengths. Nat. Protoc. 2010;5:1596–1607. doi: 10.1038/nprot.2010.124. [DOI] [PubMed] [Google Scholar]
- Leslie M. Cell biology. Are telomere tests ready for prime time? Science. 2011;332:414–415. doi: 10.1126/science.332.6028.414. [DOI] [PubMed] [Google Scholar]
- Mirabello L, Huang WY, Wong JY, Chatterjee N, Reding D, Crawford ED, De Vivo I, Hayes RB, Savage SA. The association between leukocyte telomere length and cigarette smoking, dietary and physical variables, and risk of prostate cancer. Aging Cell. 2009;8:405–413. doi: 10.1111/j.1474-9726.2009.00485.x. [DOI] [PMC free article] [PubMed] [Google Scholar]
- Nordfjäll K, Svenson U, Norrback KF, Adolfsson R, Lenner P, Roos G. The individual blood cell telomere attrition rate is telomere length dependent. PLoS Genet. 2009;5:e1000375. doi: 10.1371/journal.pgen.1000375. [DOI] [PMC free article] [PubMed] [Google Scholar]
- Okuda K, Bardeguez A, Gardner JP, Rodriguez P, Ganesh V, Kimura M, Skurnick J, Awad G, Aviv A. Telomere length in the newborn. Pediatr. Res. 2002;52:377–381. doi: 10.1203/00006450-200209000-00012. [DOI] [PubMed] [Google Scholar]
- Sidorov I, Kimura M, Yashin A, Aviv A. Leukocyte telomere dynamics and human hematopoietic stem cell kinetics during somatic growth. Exp. Hematol. 2009;37:514–524. doi: 10.1016/j.exphem.2008.11.009. [DOI] [PubMed] [Google Scholar]
- Svenson U, Nordfjäll K, Baird D, Roger L, Osterman P, Hellenius ML, Roos G. Blood cell telomere length is a dynamic feature. PLoS One. 2011;6:e21485. doi: 10.1371/journal.pone.0021485. [DOI] [PMC free article] [PubMed] [Google Scholar]
- Valdes AM, Andrew T, Gardner JP, Kimura M, Oelsner E, Cherkas LF, Aviv A, Spector TD. Obesity, cigarette smoking, and telomere length in women. Lancet. 2005;366:662–664. doi: 10.1016/S0140-6736(05)66630-5. [DOI] [PubMed] [Google Scholar]
- Vasan RS, Demissie S, Kimura M, Cupples LA, Rifai N, White C, Wang TJ, Gardner JP, Cao X, Benjamin EJ, Levy D, Aviv A. Association of leukocyte telomere length with circulating biomarkers of the renin-angiotensin-aldosterone system: the Framingham Heart Study. Circulation. 2008;117:1138–1144. doi: 10.1161/CIRCULATIONAHA.107.731794. [DOI] [PMC free article] [PubMed] [Google Scholar]
- Walne A, Bhagat T, Kirwan M, Gitaux C, Desguerre I, Leonard N, Nogales E, Vulliamy T, Dokal I. Mutations in the telomere capping complex in bone marrow failure and related syndromes. Haematologica. 2012;98:334–338. doi: 10.3324/haematol.2012.071068. [DOI] [PMC free article] [PubMed] [Google Scholar]
- Yui J, Chiu CP, Lansdorp PM. Telomerase activity in candidate stem cells from fetal liver and adult bone marrow. Blood. 1998;91:3255–3262. [PubMed] [Google Scholar]
Associated Data
This section collects any data citations, data availability statements, or supplementary materials included in this article.
Supplementary Materials
Table S1 Percentage of subjects experiencing change (Δ) in decile rank at follow-up examination in the four chorts jointly.
Table S2 Percentage of subjects experiencing change (Δ) in decile rank at follow-up examination in each of the four cohorts.
Table S3 Percentage of subjects experiencing change (Δ) in LTL rank at follow-up examination (each rank corresponding to 0.5 kb) in the four cohorts jointly.
Fig S1 Percentage of subjects experiencing change (Δ) in decile rank at follow-up examination in each of the four cohorts.
Fig S2 Number of subjects experiencing changes in LTL ranking at follow-up (each rank corresponding to a 0.5 kb) in the four cohorts jointly.