

Background: Intestinal and liver fatty acid-binding proteins (IFABP and LFABP) are coexpressed in the enterocyte, but their individual functions are not known.
Results: High fat feeding promotes different phenotypes in IFABP- and LFABP-null mice.
Conclusion: IFABP and LFABP have unique intracellular functions, which in turn produce divergent whole body effects.
Significance: Enterocyte FABP ablation modulates intestinal lipid metabolism, which contributes to altered systemic energy homeostasis.
Keywords: Fatty Acid, Fatty Acid-binding Protein, Intestine, Lipid Metabolism, Monoacylglycerol
Abstract
The enterocyte expresses two fatty acid-binding proteins (FABP), intestinal FABP (IFABP; FABP2) and liver FABP (LFABP; FABP1). LFABP is also expressed in liver. Despite ligand transport and binding differences, it has remained uncertain whether these intestinally coexpressed proteins, which both bind long chain fatty acids (FA), are functionally distinct. Here, we directly compared IFABP−/− and LFABP−/− mice fed high fat diets containing long chain saturated or unsaturated fatty acids, reasoning that providing an abundance of dietary lipid would reveal unique functional properties. The results showed that mucosal lipid metabolism was indeed differentially modified, with significant decreases in FA incorporation into triacylglycerol (TG) relative to phospholipid (PL) in IFABP−/− mice, whereas LFABP−/− mice had reduced monoacylglycerol incorporation in TG relative to PL, as well as reduced FA oxidation. Interestingly, striking differences were found in whole body energy homeostasis; LFABP−/− mice fed high fat diets became obese relative to WT, whereas IFABP−/− mice displayed an opposite, lean phenotype. Fuel utilization followed adiposity, with LFABP−/− mice preferentially utilizing lipids, and IFABP−/− mice preferentially metabolizing carbohydrate for energy production. Changes in body weight and fat may arise, in part, from altered food intake; mucosal levels of the endocannabinoids 2-arachidonoylglycerol and arachidonoylethanolamine were elevated in LFABP−/−, perhaps contributing to increased energy intake. This direct comparison provides evidence that LFABP and IFABP have distinct roles in intestinal lipid metabolism; differential intracellular functions in intestine and in liver, for LFABP−/− mice, result in divergent downstream effects at the systemic level.
Introduction
The small intestine is the primary site of dietary lipid absorption, and the quantity of dietary triacylglycerol (TG),2 which is absorbed following its luminal hydrolysis to fatty acid (FA) and monoacylglycerol (MG), is high in Western diets, ranging to over 100 g per day (1). Soluble carrier proteins are thought to be required for the intracellular trafficking of hydrophobic lipid species within the hydrophilic cytoplasmic environment. The fatty acid-binding protein (FABP) family is composed of >10 distinct ∼15-kDa cytosolic proteins. Initially discovered in the 1970s (2, 3), these proteins are highly expressed in various tissues, with some tissues containing more than one FABP. Interestingly, the proximal intestinal absorptive cell expresses two FABPs as follows: liver FABP (LFABP; FABP1), which is also highly expressed in liver and to some extent in kidney, and intestinal FABP (IFABP; FABP2), which is solely expressed in the small intestine (4, 5). Both have been suggested by in vitro studies to be involved in FA uptake from the intestinal lumen, as well as the bloodstream, into the intestinal enterocyte (6, 7).
Although the individual functions of LFABP and IFABP in the intestine have not been elucidated, several lines of evidence indirectly suggest that they may function differentially within the same cell type. For example, although all the FABPs have a highly conserved tertiary structure containing a 10-strand β-barrel within which the ligands are bound, IFABP is typical of the FABP family in that it has a single high affinity binding site for FA, whereas LFABP can bind two FA as well as other lipids, including lysophospholipids, prostaglandins, and MG (8, 9). In vitro FA transfer mechanisms are also different, with LFABP transferring FA to membranes via an aqueous diffusional mechanism, whereas FA transfer from IFABP occurs during direct protein-membrane collisional interactions (10–12). Finally, whereas both IFABP and LFABP bind saturated fatty acids with similar affinity, LFABP binds unsaturated FA with a 5–10-fold greater affinity than IFABP (13). Thus, it is hypothesized that differences in the ligand binding and transfer properties of IFABP and LFABP may give rise to individual, if not entirely disparate, roles in lipid trafficking in the enterocyte.
In this study, we directly compare LFABP−/− and IFABP−/− male mice, both on the C57BL/6 background, to gain further insight into functional similarities and differences between the two enterocyte proteins. Two laboratories have generated independent lines of LFABP−/− mice on the C57BL/6 background (14, 15). Both lines of mice have been shown to have defects in hepatic FA oxidation, uptake, and VLDL secretion (14, 16–18). LFABP−/− mice from one line have been observed to gain more weight relative to WT mice when fed chow or high fat diets (18–20), whereas female mice from the other line were shown to gain less weight following chow or high saturated fat feeding (17, 21, 22). One line of IFABP−/− mice has been generated, and it was found that male, but not female, mice gained more weight and exhibited hypertriglyceridemia and hyperinsulinemia in response to high fat high cholesterol feeding, relative to wild type mice (23, 24).
We recently reported the first direct comparison of mice null for LFABP and IFABP (25). We observed no body weight differences in chow-fed mice of either knock-out line relative to WT. Subtle phenotypic differences were noted, however. Intraduodenal administration of 14C-labeled FA in IFABP−/− mice showed an increase in recovery of mucosal radiolabel in PL relative to WT, resulting in a decrease in the TG/PL ratio. As this was not accompanied by changes in gene expression of lipid synthesis enzymes, it suggests that IFABP directs FA toward synthesis of TG. It was also found that in LFABP−/− mice, relative to WT, duodenal delivery of [3H]monoolein resulted in increased 3H recovery in mucosal PL, MG, and DG, whereas recovery of 3H in TG was decreased, suggesting that LFABP is involved in the transport of MG away from PL synthesis and toward TG synthesis. We also found significantly decreased intestinal mucosal oxidation of 14C-labeled FA in the LFABP−/− mice, similar to what has been reported in the LFABP−/− liver (16, 25, 26).
The objective of this study was to test the hypothesis that challenging the LFABP−/− and IFABP−/− mice with high fat diets would reveal more profound effects of FABP ablation. We reasoned that a chow diet would not necessarily exceed the capacity of the abundant intracellular FABPs but that high fat feeding could potentially provoke greater phenotypic changes, and perhaps exacerbate and reveal further differences between the two FABPs. The type of dietary lipid is also an important factor as IFABP and LFABP have different binding affinities for saturated and unsaturated fatty acids (13). Thus, we compared a low fat semipurified (10% kcal) diet (LFD) to two high fat (45% kcal) diets, one containing high long chain saturated (HFS) and the other high monounsaturated (HFU) long chain FA (LCFA), to further elucidate the individual functions of LFABP and IFABP in the intestinal enterocyte and in whole body energy homeostasis.
EXPERIMENTAL PROCEDURES
Animals and Diets
LFABP−/− mice on a C57BL/6N background were generated generously provided by Binas and co-workers (15). As described previously, the mice were additionally back-crossed with C57BL/6J mice from The Jackson Laboratory (Bar Harbor, ME) for six generations to create congenic LFABP mice (25). IFABP−/− mice used in this study are a substrain bred by intercrossing of the original IFABP−/− mice (24) and are also on a C57BL/6J background. Wild type C57BL/6J mice from The Jackson Laboratory were used as controls. Mice were maintained on a 12-h light/dark cycle and allowed ad libitum access to standard rodent chow (Purina Laboratory Rodent Diet 5015). At 2 months of age, male LFABP−/−, IFABP−/−, and WT (C57BL/6J) mice (3 × 3 factorial design) were housed 2–3 per cage and fed one of the following diets for 12 weeks: a low fat diet (LFD) containing 10 kcal % fat, a 45 kcal % fat diet with HFS, or a 45 kcal % fat diet with mostly unsaturated fat (HFU). Product numbers are D10080401, D10080402, and D10080403, respectively (Research Diets, Inc., New Brunswick, NJ) and are detailed in Table 1; the fatty acid compositions (provided by the manufacturer) are listed in Table 2. The three diets used were isocaloric, balanced so that only the carbohydrate and fat sources were modified between low and high fat treatments. The level of fat, 45% by calories, is commonly used to promote obesity in rodents without lowering carbohydrates to levels that would promote ketogenesis. Nevertheless, differences obtained between low fat and high fat feeding may be due, as well, to reciprocal differences in carbohydrate content (Table 1).
TABLE 1.
Diet compositions of LFD, HFS, or HFU diets
| LFD | HFS | HFU | ||||
|---|---|---|---|---|---|---|
| g | kcal | g | kcal | g | kcal | |
| Casein | 200 | 800 | 200 | 800 | 200 | 800 |
| l-Cystine | 3 | 12 | 3 | 12 | 3 | 12 |
| Corn starch | 315 | 1260 | 72.8 | 291 | 72.8 | 291 |
| Maltodextrin | 35 | 140 | 100 | 400 | 100 | 400 |
| Sucrose | 350 | 1400 | 172.8 | 691 | 172.8 | 691 |
| Cellulose | 50 | 0 | 50 | 0 | 50 | 0 |
| Soybean oil | 10 | 90 | 10 | 90 | 10 | 90 |
| Lard | 8.5 | 77 | 0 | 0 | 0 | 0 |
| Cocoa butter | 26.5 | 239 | 192.5 | 1733 | 0 | 0 |
| High oleic safflower oil | 0 | 0 | 0 | 0 | 192.5 | 1733 |
| Mineral mix, S10026 | 10 | 0 | 10 | 0 | 10 | 0 |
| Dicalcium phosphate | 13 | 0 | 13 | 0 | 13 | 0 |
| Calcium carbonate | 5.5 | 0 | 5.5 | 0 | 5.5 | 0 |
| Potassium citrate, 1 H2O | 16.5 | 0 | 16.5 | 0 | 16.5 | 0 |
| Vitamin mix, V10001 | 10 | 40 | 10 | 40 | 10 | 40 |
| Choline bitartrate | 2 | 0 | 2 | 0 | 2 | 0 |
| FD&C yellow dye no. 5 | 0.05 | 0 | 0 | 0 | 0.025 | 0 |
| FD&C red dye no. 40 | 0 | 0 | 0.05 | 0 | 0 | 0 |
| FD&C blue dye no. 1 | 0 | 0 | 0 | 0 | 0.025 | 0 |
| Total | 1055.05 | 4057 | 858.15 | 4057 | 858.15 | 4057 |
TABLE 2.
Fatty acid compositions of LFD, HFS, and HFU diets (as provided by the manufacturer)
| LFD | HFS | HFU | |
|---|---|---|---|
| g/4057 kcal | |||
| C16 | 8.2 | 49.9 | 11.1 |
| C16:1 | 0.1 | 0.4 | 0.0 |
| C18 | 9.3 | 64.3 | 3.7 |
| C18:1 | 17.7 | 65.2 | 152.6 |
| C18:2 | 7.3 | 10.7 | 32.7 |
| C18:3 | 0.8 | 1.0 | 0.8 |
| % | |||
| Saturated fatty acids | 40.8 | 60.0 | 7.8 |
| Monounsaturated fatty acids | 40.9 | 33.9 | 75.6 |
| Polyunsaturated fatty acids | 18.1 | 6.1 | 16.5 |
Body weights were measured weekly. The food pellets were weighed each week to determine weekly food intakes for each cage. Grams per week was divided by the number of animals per cage and then divided by 7 days to determine the daily food intake; independent measures were based on the number of cages. Daily caloric intake was determined using the caloric densities of 3.9 kcal/g for the LFD or 4.7 kcal/g for HFS and HFU (Research Diets, Inc.). At the end of the experiment, the mice were fasted for 24 h and anesthetized with ketamine/xylazine/acepromazine (80:100:150 mg/kg, intraperitoneally, respectively), prior to collection of blood and tissues. Rutgers University Animal Care and Use Committee approved all animal experiments.
Body Composition
Fat mass and fat-free mass measurements were taken by MRI (Echo Medical Systems, LLC., Houston, TX) 2–3 days prior to starting the feeding protocol and 2–3 days prior to sacrifice. The instrument was calibrated each time according to the manufacturer's instructions. Two measurements for fat and fat-free mass were taken for each mouse and averaged.
Energy Expenditure and Activity
Energy expenditure and activity were assessed using the Oxymax System (Columbus Instruments, Columbus, OH). Mice were placed in an indirect calorimetry chamber for a total of 48 h, which includes a 24-h period for adaptation prior to measurements. VO2 and VCO2 (VCO2/VCO2) were used to determine the respiratory exchange ratio (RER) as an estimation of the respiratory quotient. Energy expenditure was assessed using the gas exchange measurements as follows: (3.815 + 1.232 × RER) × VO2 (27, 28). Energy expenditure (EE) data were analyzed using the multiple regression model (least squares, JMP 10.0) that statistically adjusts for the differences in fat-free mass (FFM) among genotypes (29). The number of IR beam breaks in a plane was recorded as spontaneous activity. The number of x axis IR beam breaks during the 24-h period (X total), successive x axis IR beam breaks (X ambulatory), and number of vertical IR beam breaks (Z total) were counted over the 24-h period.
Preparation of Tissues and Plasma
At sacrifice, blood was drawn, and glucose (Accu-Chek, Hoffmann-La Roche) and TG levels (CardioChek, Polymer Technology Systems, Inc.) were measured. Plasma was extracted after centrifugation for 6 min at 4000 rpm and stored at −80 °C. Livers and inguinal, perirenal, and epididymal fat pads were removed, immediately placed on dry ice, and subsequently stored at −80 °C for further analysis. The intestine from stomach to cecum was removed and measured lengthwise, rinsed with 60 ml of ice-cold 0.1 m NaCl, opened longitudinally, and mucosa scraped with a glass microscope slide into tared tubes in dry ice. Mucosal samples were subsequently diluted with 10× volume of PBS, pH 7.4, per g wet weight, and homogenized using 20 strokes with a Potter-Elvehjem homogenizer on ice. Protein concentration was determined (25), and lipid extraction was performed on samples containing 1 mg of protein/ml using the Folch procedure (30, 31). Lipids were extracted twice with 10 ml of chloroform/methanol (2:1) and the aqueous phase nonlipid fractions discarded. The organic lipid layer was dried under a nitrogen stream and resuspended in chloroform/methanol (2:1) for further analysis.
LC/MS Analysis
Monoacylglycerol species, including 2-AG, and ethanolamines from intestinal mucosa were analyzed by LC/MS as described previously, at the core facility of the Rutgers Institute for Food, Nutrition, and Health (32).
Plasma Analyses
At time of sacrifice, plasma was collected and stored at −80 °C for further analyses as noted above. ELISA kits were used to measure plasma leptin, adiponectin, and insulin (Millipore). Plasma total cholesterol and FA levels were also analyzed (Wako Diagnostics, Inc.). Adiponectin and leptin indices (33) were calculated as the plasma adiponectin or leptin levels divided by the total fat mass determined by MRI. Homeostatic Model Assessment (HOMA-IR) was determined using fasting glucose (mg/dl) × fasting insulin (microunits/ml)/405 (34).
Oral Fat Tolerance Tests
After 3 months of high fat feeding, mice were fasted for 24 h. Time 0 blood was taken from conscious mice via the tail vein and then an intraperitoneal injection of Tyloxapol (500 mg/kg BW) was administered to prevent lipoprotein TG uptake via inhibition of lipoprotein lipase. After 30 min, an orogastric gavage of 300 μl of olive oil was given. Blood was taken at t = 60, 120, 180, and 240 min. Blood TG levels were measured using 15 μl of whole blood using a CardioChek instrument (Polymer Technology Systems, Inc., Zionsville, IN).
Mucosal FA and MG Metabolism
Preparation of lipids for bloodstream and intraduodenal administration was as follows. For intravenous FA administration, 15 μCi of [14C]oleate (275 nmol) was dried under a nitrogen stream, and 0.5% ethanol (final volume) and 150 μl of a solution containing 0.1 m NaCl and mouse serum (1:1) were then added sequentially. For duodenal FA administration, 1.5 μCi of [3H]oleate (34 nmol) was dried under a nitrogen stream and then 150 μl of 10 mm sodium taurocholate in 0.1 m NaCl was added. For intraduodenal administration of [3H]monolein, [3H]monoolein 7.3 μCi (0.122 nmol) was dried under a nitrogen stream and then 150 μl of 10 mm sodium taurocholate in 0.1 m NaCl was added. Eight-week-old WT, IFABP−/−, and LFABP−/− male mice (n = 6/group) were fed LFD or HFS for 3 months and were then fasted 24 h and anesthetized as indicated above prior to the experiment. Surgical procedures for intravenous and intraduodenal administration, collection of mucosa at t = 2 min following introduction of lipids, lipid extraction, and analysis of mucosal lipid metabolites by TLC and phosphorimaging (for [14C]oleate) or scraping and scintillation counting (for [3H]oleate and -monoolein),were performed as described in detail previously (25, 31).
Fatty Acid Oxidation
Fatty acid oxidation measurements on mucosa from mice administered [14C]oleate were carried out as described previously (25, 31).
Fecal Lipid Content
Fecal lipids were measured to determine whether there were any alterations in total lipid absorption in the gene-ablated mice. Feces were collected from the cages between 4 and 10 weeks during the 12-week period and then dried overnight at 60 °C and weighed. 0.5 g (dry weight) was dissolved in water overnight and lipid-extracted using the Folch method (30). The extracted lipids in 2:1 chloroform/methanol were placed in pre-weighed glass tubes and dried down completely under a nitrogen stream. They were weighed again to determine recovered lipid. The weight of the extract was divided by original weight of the feces to determine percent of lipid in the feces.
Quantitative RT-PCR for mRNA Expression Analysis
The protocol for mRNA acquisition and analysis was adapted from Chon et al. (35). Briefly, tissues were homogenized in 4 m guanidinium thiocyanate, 25 mm sodium citrate, 0.1 m β-mercaptoethanol using several strokes of a Polytron. Total RNA was further purified by phenol extraction and the RNeasy cleanup kit (Qiagen,Valencia, CA) along with DNase treatment to minimize genomic DNA contamination. Reverse transcription was performed using 1 μg of RNA, random primers, an RNase inhibitor, and reverse transcriptase (Promega Madison, WI) in a total volume of 25 μl. Primer sequences were obtained from Primer Bank (Harvard Medical School QPCR Primer Database). The efficiency of PCR amplifications was analyzed for all primers to confirm similar amplification efficiency. Real time PCRs were performed in triplicate using an Applied Biosystems 7300 instrument. Each reaction contained 80 ng of cDNA, 250 nm of each primer, and 12.5 μl of SYBR Green Master Mix (Applied Biosystems, Foster City, CA) in a total volume of 25 μl. Relative quantification of mRNA expression was calculated using the comparative Ct method normalized to β-actin.
Statistical Analysis
Data are presented as mean ± S.E. Statistical comparisons for body weight were made by two-way repeated measures ANOVA (genotype × time). For OFTT tests, comparisons were made by Student's t test (IFABP−/− or LFABP−/− versus WT) for each time point. The effect of the genotype within each diet was made by one-way ANOVA followed by Tukey's post hoc test using JMP statistical software (version 10, SAS Institute). Multiple linear regression (least squares analysis, JMP) was used to the assess effects of diet and genotype, adjusted for FFM on energy expenditure.
RESULTS
Ablation of LFABP or IFABP Differentially Affects Body Weight, Body Composition, and Food Intake
The BW and body fat mass (FM) of IFABP−/− and LFABP−/− mice were similar to WT prior to the start of feeding, but the percentage of fat-free mass (FFM) of LFABP−/− mice was slightly lower than WT (p < 0.05) (data not shown).
After 12 weeks of high fat feeding, different BW phenotypes were readily evident between the IFABP−/− and LFABP−/− mice. IFABP−/− mice fed the 10 kcal % LFD had similar BW relative to WT over the 12-week study (Fig. 1A); however, IFABP−/− mice fed diets containing 45 kcal % HFS and HFU had lower BW relative to WT (p < 0.05) (Fig. 1, B and C). Total weight gain for IFABP−/− mice was similar to WT when fed the LFD, but weight gain was significantly lower after HFS diet feeding (p < 0.05), and a similar trend was observed for mice fed the HFU (Fig. 1D). Notably, IFABP−/− mice were found to have lower % of FM and a higher % of FFM on all dietary treatments (p < 0.05) (Fig. 1, E and F). The food intake of IFABP−/− mice was somewhat higher when they were consuming the LFD but was lower than WT in response to the HFS diet (p < 0.05). Caloric intakes were similar between WT and IFABP−/− fed the HFU diet (Fig. 1G). Food efficiency (g of BW gained per kcal consumed) was similar to WT mice during HFS feeding (Fig. 1H). Importantly, fecal fat measurements were similar between IFABP−/− and WT mice (Fig. 1I), and thus lipid absorption was not affected, in agreement with previous results for chow-fed mice (25). The body weight phenotype for the present substrain of IFABP null mice differs from what we found in the original strain, where male mice showed increased weight gain relative to WT mice (23, 24).
FIGURE 1.

Body weight and composition for WT, IFABP−/−, and LFABP−/− mice after 12 weeks on LFD, HFS, or HFU diet. A, body weights on LFD (n = 15–16); B, body weights on HFS (n = 13–14); C, body weights on HFU (n = 12–16); D, BW gains (n = 12–16); E, percent fat mass (n = 12–16); F, percent fat-free mass (n = 12–16); G, food intake for mice fed LFD (n = 5–7), HFS (n = 5–6), HFU (n = 5–7); H, food efficiency (g of BW gained/kcal of food intake) for mice fed LFD (n = 5–7), HFS (n = 5–6), HFU (n = 5–7). A–C, data are mean ± S.E., analyzed using two-way ANOVA using repeated measures with post hoc Tukey's test (genotype × time) *, p < 0.05 for LFABP−/− versus WT; +, p < 0.05 for IFABP−/− versus WT. D–H, data are mean ± S.E., analyzed using one-way ANOVA with a Tukey's post hoc test. I, fecal lipid content (n = 5–7), HFS, (n = 5–6), and HFU (n = 5–7). Results with different letters within diet treatment are significantly different (p < 0.05).
Remarkably, the results showed that LFABP−/− mice displayed an opposite phenotype to the IFABP−/− mice. Weekly body weights of LFABP−/− mice were similar to WT when fed the LFD, but the net weight gain over the 12 weeks of feeding was significantly greater (p < 0.05) (Fig. 1, A and D). Moreover, in marked contrast to IFABP−/− mice, LFABP−/− had significantly higher BW relative to WT when fed HFS or HFU during the 12-week feeding study, resulting in substantially greater weight gains (p < 0.05) (Fig. 1, B–D). The LFABP−/− had a higher % of FM and lower % of FFM when fed either high fat diet (p < 0.05) (Fig. 1, E and F), indicating that high fat feeding caused increased adiposity relative to WT. In further contrast to the IFABP nulls, the food intake of LFABP−/− mice was higher on the HFS diet (p < 0.05) (Fig. 1G), and significantly higher food efficiency was observed when LFABP−/− mice were fed HFS and HFU (p < 0.05) (Fig. 1H). In agreement with previous reports (17, 25), no differences in fecal fat were found (Fig. 1I); thus, there was no indication of lipid malabsorption in the LFABP−/− knock-out mice.
Overall, the present direct comparison of LFABP−/− and IFABP−/− mice reveals divergent phenotypes when fed high LCFA diets. After 12 weeks of feeding, LFABP−/− mice displayed greater increases in body weight and FM and lower FFM compared with WT, with more pronounced changes occurring during HFS feeding compared with HFU. In contrast, IFABP−/− mice gain less weight than WT and have a smaller amount of FM, regardless of the amount or type of dietary fat.
IFABP−/− Mice Have Greater Reductions in FM after Fasting
Because body composition differed between the two enterocyte FABP null mice, we further examined the effects of fasting on changes in FM and FFM, using MRI (Table 3). When fed the LFD, the IFABP−/− mice lost a larger percent of BW after fasting relative to WT (p < 0.05). Additionally, whereas LFD-fed IFABP−/− mice had lower FM than WT in both fed and fasted states, the loss of fat mass following the fast was almost double for the IFABP−/− mice compared with WT (p < 0.05). Similarly, on both the HFS and HFU diets, the percent decrease in FM for the IFABP−/− mice was approximately twice that of the WT mice (p < 0.05) (Table 3). These results are in agreement with our recent observations for IFABP−/− mice of this substrain fed laboratory chow (25), indicating that a large loss of fat mass during fasting occurs under all dietary regimens examined. HFU-fed but not HFS- or LFD-fed IFABP−/− mice also lost more FFM than WT mouse during the fast.
TABLE 3.
Fed and 24-h fasted body weight and composition for WT, LFABP−/−, and LFABP−/− mice after 12 weeks on an LFD, HFS, or HFU diet
The values used are as follows: LFD, n = 15–24; HFS, n = 18–25; HFU, n = 6–9. Data are mean ± S.E., analyzed using one-way ANOVA with a Tukey's post hoc test. Results with different letters within a dietary treatment are significantly different (p < 0.05).
| LFD |
HFS |
HFU |
|||||||
|---|---|---|---|---|---|---|---|---|---|
| WT | IFABP−/− | LFABP−/− | WT | IFABP−/− | LFABP−/− | WT | IFABP−/− | LFABP−/− | |
| Fed BW, g | 27.5 ± 0.4 | 27.0 ± 0.6 | 27.6 ± 0.6 | 33.6 ± 0.7b | 28.5 ± 0.7a | 37.2 ± 1.2c | 32.7 ± 2.0a | 29.8 ± 1.0a | 40.6 ± 2.2b |
| Fasting BW, g | 24.8 ± 0.4 | 23.7 ± 0.6 | 24.8 ± 0.5 | 31.0 ± 0.7b | 25.4 ± 0.7a | 34.3 ± 1.1c | 30.6 ± 1.9a | 26.7 ± 0.5a | 37.5 ± 2.2b |
| % change | 9.9 ± 0.5a | 12.4 ± 0.6b | 10.0 ± 0.4a | 8.0 ± 0.4a | 10.8 ± 0.6b | 7.8 ± 0.4a | −6.7 ± 0.4a | −10.4 ± 0.5b | −7.9 ± 0.8a |
| Fed FM, g | 4.1 ± 0.2b | 2.6 ± 0.1a | 4.5 ± 0.3b | 7.8 ± 0.5b | 3.1 ± 0.3a | 11.3 ± 0.8c | 9.1 ± 1.4b | 3.2 ± 0.6a | 15.1 ± 1.7c |
| Fasting, FM, g | 3.1 ± 0.2b | 1.5 ± 0.1a | 3.5 ± 0.3b | 6.0 ± 0.5b | 2.2 ± 0.3a | 10.4 ± 0.8c | 7.7 ± 1.3b | 2.0 ± 0.5a | 13.8 ± 1.6c |
| % change | −24.8 ± 2.2a | −44.5 ± 3.1b | −22.7 ± 2.5a | −17.1 ± 2.5a | −30.2 ± 4.9b | −9.0 ± 0.9a | −15.9 ± 2.7a | −40.5 ± 4.0b | 9.3 ± 1.7a |
| Fed FFM, g | 21.3 ± 0.5 | 21.7 ± 0.6 | 20.5 ± 0.3 | 23.2 ± 0.6 | 22.4 ± 0.6 | 23.0 ± 0.5 | 21.4 ± 0.6a | 24.5 ± 0.5b | 22.8 ± 0.6ab |
| Fasting, FFM, g | 19.4 ± 0.4 | 19.8 ± 0.5 | 18.9 ± 0.2 | 22.3 ± 0.5 | 20.7 ± 0.5 | 21.6 ± 0.5 | 20.8 ± 0.5 | 22.3 ± 0.5 | 22.5 ± 0.6 |
| % change | −8.3 ± 1.5 | −8.7 ± 0.3 | −7.9 ± 0.4 | −3.5 ± 1.6 | −7.4 ± 0.9 | −6.3 ± 0.9 | −2.9 ± 1.1a | −9.0 ± 0.7b | −1.45 ± 0.8a |
In contrast to the IFABP−/− mice, the LFABP−/− mice did not differ from WT in the percent of fat mass lost following a 24-h fast, although as noted above the LFABP−/− mice had much greater absolute fat mass (Table 3). This, too, is in keeping with our previous results for chow-fed mice. No changes in the loss of FFM were found following fasting for the LFABP−/− mice, regardless of dietary treatment.
IFABP−/− and LFABP−/− Mice Have Different Metabolic Fuel Source Utilization, 24-h Energy Expenditure, and Activity
The ratio of VCO2/VO2 (RER) was higher in IFABP−/− mice fed HFS or HFU, suggesting increased utilization of carbohydrate for oxidation (p < 0.05) (Fig. 2, A–C). By contrast, the LFABP−/− mice had a lower RER on LFD and HFS compared with WT (p < 0.05) (Fig. 2, A–C), indicating that these mice utilized more lipids as an energy source.
FIGURE 2.

Indirect calorimetry and 24-h activity for WT, IFABP−/−, and LFABP−/− mice after 12 weeks on LFD, HFS, or HFU diet. A, 24-h VO2; B, 24-h VCO2; C, 24-h RER; D, 24 h × total activity; E, 24 h × ambulatory activity; F, 24 h × total activity. LFD, n = 15–16; HFS, n = 13–14; HFU, n = 12–17. Data are given as mean ± S.E., analyzed using one-way ANOVA with a Tukey's post hoc test. Results with different letters within a diet treatment are significantly different (p < 0.05).
Multiple regression analysis indicated that there was a statistically significant interaction of metabolic rates with diet and genotype; therefore, we analyzed the genotype effect within each diet. When fed the HFS or HFU diets, there were no genotype effects on 24-h EE per mouse. In mice fed the LFD, however, 24 h energy expenditure (kcal/h) was higher in IFABP−/− than WT. After adjusting for variations in LBM, there was also no difference in the 24-h EE in mice fed HFS. However, in mice fed HFU, 24-h EE adjusted for LBM was higher in the LFABP−/−. Furthermore, when fed the LFD, the IFABP−/− group had higher EE than WT after adjustment for LBM.
Surprisingly, we found that despite their increased adiposity and body weight, the LFABP−/− mice had increased activity compared with WT mice after HFS feeding (p < 0.05), and higher total X total activity than the IFABP−/− group on both HFS and HFU (Fig. 2, D–F). Thus, the greater adiposity of the LFABP−/− appears to be due to greater feed efficiency (Fig. 1H).
IFABP−/− and LFABP−/− Mice Display Differences in Markers of Whole Body Energy Metabolism
Plasma and tissue analyses are presented in Table 4. IFABP−/− mice had lower fasting blood glucose levels relative to WT mice when fed LFD and HFS (p < 0.05), but no changes in insulin or TG levels were found. Total cholesterol and nonesterified FA (NEFA) levels were not different, except after HFU feeding, where both were lower for IFABP−/− relative to WT mice (p < 0.05). Plasma leptin levels were lower in the IFABP−/− mice fed HFU (p < 0.05), presumably reflecting their lower FM (Fig. 1). For the same reason, we were surprised to find that IFABP−/− mice had lower adiponectin levels following LFD and HFU feeding; however, the adiponectin index, which takes into account the total fat mass of the animals (plasma adiponectin/g of FM) showed that IFABP−/− had higher values than WT after HFU feeding (p < 0.05). Livers weights per g BW of IFABP−/− mice were similar to WT, although this finding is in contrast to the increased liver weights found in male IFABP−/− mice from the original line (23). In keeping with the lower FM shown by MRI, the epididymal, perirenal, and inguinal fat pads were smaller for IFABP−/− on LFD or HFU (p < 0.05), and a similar trend was found on the HFS diet.
TABLE 4.
Plasma and tissue analyses for WT, IFABP−/−, and LFABP−/− mice after 12 weeks on LFD, HFS, or HFU diet
Data are mean ± S.E. and analyzed using one-way ANOVA with Tukey's post hoc test. Results with different letters within a dietary treatment are significantly different (p < 0.05). n = 6–9 for all groups.
| LFD |
HFS |
HFU |
|||||||
|---|---|---|---|---|---|---|---|---|---|
| WT | IFABP−/− | LFABP−/− | WT | IFABP−/− | LFABP−/− | WT | IFABP−/− | LFABP−/− | |
| Glucose, mg/dl | 169 ± 15b | 92 ± 9a | 147 ± 16b | 156 ± 25b | 87 ± 5a | 159 ± 19b | 149 ± 20ab | 101 ± 9a | 169 ± 22b |
| Insulin, ng/ml | 0.18 ± 0.02 | 0.20 ± 0.02 | 0.28 ± 0.01 | 0.21 ± 0.01 | 0.26 ± 0.06 | 0.25 ± 0.01 | 0.25 ± 0.01 | 0.24 ± 0.00 | 0.35 ± 0.07 |
| HOMA, IR | 1.9 ± 0.2 | 1.2 ± 0.1 | 1.6 ± 0.3 | 2.0 ± 1.4 | 1.4 ± 0.4 | 2.5 ± 0.4 | 2.2 ± 0.3 | 1.4 ± 0.1 | 2.7 ± 0.5 |
| Total cholesterol, mg/dl | 95 ± 5 | 86 ± 7 | 94 ± 4 | 99 ± 5ab | 86 ± 4a | 109 ± 7b | 108 ± 3b | 76 ± 5a | 105 ± 11b |
| TAG, mg/dl | 75 ± 9a | 83 ± 11a | 148 ± 10b | 99 ± 11 | 114 ± 10 | 90 ± 9 | 97 ± 6b | 80 ± 5b | 73 ± 5a |
| NEFA, mEq/liter | 0.30 ± 0.04 | 0.34 ± 0.06 | 0.42 ± 0.06 | 0.26 ± 0.04 | 0.36 ± 0.03 | 0.43 ± 0.13 | 0.40 ± 0.04b | 0.24 ± 0.04a | 0.38 ± 0.07b |
| Leptin, ng/ml | 3.1 ± 0.6ab | 0.4 ± 0.3a | 5.7 ± 1.7b | 3.2 ± 0.6a | 1.1 ± 0.2a | 13.4 ± 1.9b | 3.3 ± 0.8ab | 0.2 ± 0.2a | 10.2 ± 3.3b |
| Leptin index | 0.8 ± 0.1b | 0.2 ± 0.1a | 0.9 ± 0.2b | 0.6 ± 0.1a | 0.3 ± 0.0a | 1.2 ± 0.1b | 1.9 ± 0.4b | 0.1 ± 0.1a | 1.3 ± 0.3b |
| Adiponectin, ng/ml | 10.7 ± 0.7b | 6.4 ± 0.4a | 10.6 ± 0.6b | 10.8 ± 1.1ab | 8.3 ± 0.4a | 12.6 ± 1.2b | 10.3 ± 0.8b | 5.9 ± 0.4a | 11.8 ± 1.0b |
| Adiponectin index | 3.0 ± 0.4ab | 4.0 ± 0.4b | 2.3 ± 0.2a | 2.6 ± 0.3ab | 2.8 ± 0.4b | 1.3 ± 0.2a | 1.7 ± 0.1a | 3.0 ± 0.2b | 1.4 ± 0.1a |
| Liver WT, g | 0.94 ± 0.03b | 0.84 ± 0.02a | 0.86 ± 0.01a | 0.90 ± 0.04ab | 0.79 ± 0.02a | 1.00 ± 0.06b | 0.99 ± 0.03b | 0.93 ± 0.02ab | 0.85 ± 0.03a |
| Liver, g/g BW | 0.035 ± 0.001ab | 0.036 ± 0.001b | 0.033 ± 0.001a | 0.034 ± 0.001 | 0.031 ± 0.001 | 0.035 ± 0.003 | 0.034 ± 0.001b | 0.0037 ± 0.002b | 0.029 ± 0.001a |
| Epididymal fat, g | 0.49 ± 0.06b | 0.14 ± 0.04a | 0.60 ± 0.05b | 0.74 ± 0.07b | 0.28 ± 0.04a | 1.50 ± 0.14c | 0.93 ± 0.14b | 0.18 ± 0.05a | 1.01 ± 0.14b |
| Perirenal fat, g | 0.17 ± 0.03b | 0.05 ± 0.01a | 0.18 ± 0.02b | 0.21 ± 0.02a | 0.09 ± 0.02a | 0.45 ± 0.05b | 0.32 ± 0.05b | 0.07 ± 0.05a | 0.36 ± 0.06b |
| Inguinal fat, g | 0.32 ± 0.05b | 0.12 ± 0.04a | 0.36 ± 0.03b | 0.45 ± 0.04a | 0.25 ± 0.10a | 1.04 ± 0.14b | 0.56 ± 0.10b | 0.14 ± 0.03a | 0.69 ± 0.09b |
Despite the markedly greater fat mass of the LFABP−/− mice relative to WT, no changes were observed in fasting blood glucose, insulin, cholesterol, NEFA, or adiponectin levels on any of the dietary regimens (Table 4). Plasma TGs were higher in LFABP−/− mice fed a LFD but somewhat lower when fed a HFU (p < 0.05). Leptin levels of LFABP−/− mice on HFS were strikingly higher than WT (p < 0.05), in keeping with the large increases in FM (Fig. 1). Correspondingly, the LFABP−/− mice had larger epididymal, perirenal, and inguinal fat pads when fed HFS (p < 0.05). The absolute liver weights of LFD- and HFU-fed LFABP−/− mice were lower than WT mice and were also lower (p < 0.05) when expressed per g BW.
IFABP−/− Mice Have Increased Chylomicron Secretion Rates
Oral fat tolerance tests were performed on 24-h fasted mice treated with Tyloxapol to prevent clearance of circulating TG-rich lipoproteins (Fig. 3). We found little or no differences between the LFABP−/− and WT mice except on the LFD at base line and 1 h, where TG levels were slightly but significantly higher (p < 0.05), as also shown above (Table 4 and Fig. 3A). The IFABP−/− mice fed the LFD showed a trend toward increased TG secretion, with values significantly different from WT at t = 2 h (p < 0.05). On the HFS diet, the IFABP−/− mice showed significantly higher TG levels at 2 h following the oral fat bolus (p < 0.05), which continued throughout the 4-h measurement period (Fig. 3B). Similar but smaller increases were seen for IFABP−/− mice fed HFU; however, differences were not statistically significant (Fig. 3C). For the LFABP−/− mice, no changes were found on the HFU diet, and HFS-fed LFABP−/− mice tended to have greater plasma TG levels following the oral fat bolus, with differences significant at t = 3 h (Fig. 3, A–C) (p < 0.05).
FIGURE 3.

Oral fat tolerance tests following a 24-h fast for WT, IFABP−/−, and LFABP−/− mice after 12 weeks on LFD, HFS, or HFU diet. Blood TG levels for the following: A, LFD-fed mice (n = 6–9); B, HFS-fed mice (n = 5–6); C, HFU-fed mice (n = 6–9). Data are given as mean ± S.E., analyzed using Student's t test. *, p < 0.05 for LFABP−/− versus WT at the same time point; +, p < 0.05 for IFABP−/− versus WT at the same time point.
Altered FA and MG Metabolism in the Intestinal Enterocyte by IFABP− or LFABP Ablation
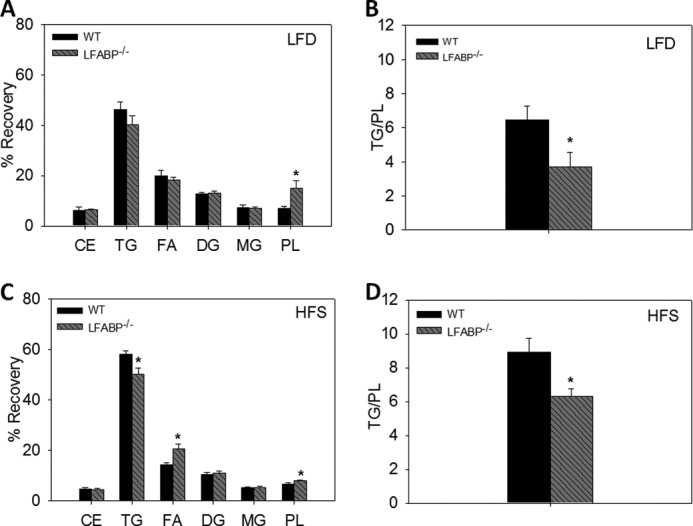
[14C]Oleate was administered intravenously while simultaneously introducing [3H]oleate into the duodenum, in 24-h fasted mice, to examine the metabolic fate of bloodstream-derived and diet-derived FA, respectively. As detailed under “Experimental Procedures,” small intestinal mucosa was harvested after 2 min, and lipids were extracted and separated by TLC to measure recovery of both diet- and bloodstream-derived FA in specific lipid species (Fig. 4). Data were expressed as the percent of label recovered in each lipid species and as the ratio of label recovered in TG relative to PL (25). No significant differences from WT were found for IFABP−/− or LFABP−/− mice fed the LFD (Fig. 4, A and B). However, HFS feeding resulted in a lower recovery of the [14C]oleate label in TG for the IFABP−/− mice (p < 0.05). In contrast, LFABP−/− mice had an increase in recovery of [14C]oleate in PL (Fig. 4C). This resulted in a lower TG/PL ratio for both knockouts (Fig. 4D) (p < 0.05), indicating that in mice fed high fat diets both proteins were involved in trafficking FA from the bloodstream toward TG synthesis. Administration of duodenal oleate did not result in changes in the IFABP−/− during LFD or HFS feeding (Fig. 4, E and G). However, we observed that LFABP−/− mice fed LFD had a lower TG/PL ratio (Fig. 4, E and H) (p < 0.05). In separate experiments, we measured the oxidation of duodenally administered [14C]oleate, and we found that on both the LFD and HFS diet, LFABP−/− mice had lower mucosal FA oxidation (p < 0.05) (Fig. 4I). This is in agreement with previous experiments in chow-fed mice (25), as well as studies of liver FA oxidation (14, 16, 18, 36).
FIGURE 4.

Intestinal fatty acid in WT, IFABP−/−, and LFABP−/− mice after 12 weeks on LFD, HFS, or HFU diet. A, bloodstream-derived [14C]oleate LFD (n = 6–7); B, bloodstream-derived [14C]oleate TG/PL ratio LFD (n = 6–7); C, bloodstream-derived [14C]oleate HFS (n = 6); D, bloodstream-derived [14C]oleate TG/PL ratio HFS (n = 6); E, diet-derived [3H]oleate LFD (n = 6–7); F, diet-derived [3H]oleate TG/PL ratio LFD (n = 6–7); G, diet-derived [3H]oleate HFS (n = 6); H, diet-derived [3H]oleate TG/PL ratio HFS (n = 6); I, oxidation of diet-derived [14C]oleate for LFD and HFS-fed mice (n = 8). Data are given as mean ± S.E., analyzed using one-way ANOVA with Tukey's post hoc test. Results with different letters are significantly different (p < 0.05).
Studies from our laboratory have shown that LFABP, but not IFABP, is a 2-MG-binding protein in vitro and in vivo (9, 37). In keeping with this binding function, we found alterations in intestinal 2-MG metabolism in chow-fed LFABP−/− mice but not in the IFABP−/− mice (25). Here, we determined whether altered MG metabolism would also be manifested under the HFS feeding regimen (Fig. 5). Indeed, the results showed that LFD-fed LFABP−/− mice had an increase in recovery of “dietary” [3H]monoolein PL, relative to WT, resulting in a significantly lower TG/PL ratio (p < 0.05) (Fig. 5, A and B) and that the HFS feeding resulted in lower recovery in TG and a higher recovery in PL, relative to WT, also resulting in a lower TG/PL ratio (p < 0.05) (Fig. 5, C and D).
FIGURE 5.
Intestinal 2-monoacylglycerol metabolism in WT and LFABP−/− mice after 12 weeks on LFD or HFS diet. A, diet-derived [3H]monoolein LFD (n = 6–7); B, diet-derived [3H]monoolein TG/PL ratio LFD (n = 6–7); C, diet-derived [3H]monoolein HFS (n = 6–7); D, diet-derived [3H]monoolein TG/PL ratio HFS (n = 7). Data are given as mean ± S.E. and are analyzed using Student's t test. *, p < 0.05 versus WT.
Effects of IFABP and LFABP Ablation on Expression of Genes Involved in Intestinal Lipid Metabolism
As noted above, few changes, compared with WT mice, were found in mucosal expression of genes related to lipid metabolism and transport for IFABP−/− or LFABP−/− mice on a chow diet, suggesting that alterations in lipid metabolism were not due to changes in gene expression but were rather, more likely, due to changes in lipid transport (25). Here, we further examined lipid-related gene expression to determine whether feeding high fat compared with low fat diets resulted in differential regulation of mucosal gene expression in the IFABP−/− or LFABP−/− mice. In keeping with prior observations, high fat feeding resulted in increased expression of several genes in WT mouse mucosa. In particular, the HFS diet resulted in significantly increased expression of LFABP, IFABP, MGL, and FAAH, and the HFU diet resulted in increased expression of these genes as well as MGAT2 and PPARα (Fig. 6A) (35, 38, 39). With almost no exception, the responses to high fat feeding in the WT mice were also found in the two knock-out strains. For example, the HFS diet caused a 9-fold increase in LFABP expression in WT and an 8-fold increase in LFABP expression in the IFABP−/− mouse; the HFU diet resulted in 3–4-fold increases in FAAH expression in all three genotypes, etc. (Fig. 6, B and C). Thus, the present differences found in FA and MG metabolism in the IFABP−/− and LFABP−/− mice appear to be primarily caused by nontranscriptional effects, most likely via alterations in intracellular lipid binding capacity and transport. A small but significant increase (50%) in PPARα expression was found in HFU-fed WT mouse mucosa that was not found in LFABP−/− mucosa, perhaps related to the proposed direct interaction between LFABP and PPARα (8, 26, 40). Importantly, no compensatory increase was found in LFABP expression in the IFABP−/− mucosa or in IFABP in the LFABP−/− mucosa on any of the three diets used, supporting the hypothesis that these two enterocyte proteins have unique functional roles.
FIGURE 6.

Relative quantitation of mRNA expression of intestinal lipid metabolic and transport genes for WT, IFABP−/−, and LFABP−/− mice after 12 weeks on LFD, HFS, or HFU diet. A, WT-fed HFS or HFU relative to WT fed LFD (n = 5–9); B, IFABP−/−-fed HFS or HFU relative IFABP−/−-fed LFD (n = 5–9); C, LFABP−/−-fed HFS or HFU relative LFABP−/−-fed LFD (n = 5–9). Data are given as mean ± S.E. and are analyzed using Student's t test. *, p < 0.05 versus same genotype on LFD.
Intestinal Mucosal Endocannabinoid Levels in IFABP−/− and LFABP−/− Mice
Recent reports have shown that several FABPs can bind the endogenous cannabinoid receptor ligand anandamide (arachidonoylethanolamine (AEA)) (41, 42). 2-AG is also an endocannabinoid, and we have shown that LFABP binds 2-monoacylglycerols (9). Because the endocannabinoid system is involved in appetite regulation, we hypothesized that changes in food intake observed in the two FABP null mice could perhaps be related to changes in intestinal endocannabinoid levels. Hence, we measured mucosal levels of AEA and 2-AG, as well as several other monoacylglycerol species, and of oleoylethanolamine and palmitoylethanolamine, which are ligands for the PPARα transcription factor and may also play a role in food intake (43, 44). We found that both 2-AG (p = 0.053) and AEA levels showed a trend to be elevated in LFABP−/− mucosa, as was 2-linoleoylglycerol (p < 0.05); oleoylethanolamine and palmitoylethanolamine levels were not changed (Fig. 7). 2-AG levels showed an opposite, lower, trend in the IFABP−/− mucosa on LFD and HFS; lower levels of 2-monopalmitin were also found in IFABP−/− mucosa (Fig. 7). Notably, no differences in the mRNA expression of MGL or FAAH, enzymes that degrade 2-AG and AEA, respectively, were found between genotypes (Fig. 6).
FIGURE 7.

Intestinal ethanolamine and 2-monoacylglycerol levels for WT, IFABP−/−, and LFABP−/− mice after 12 weeks on LFD, HFS, or HFU diet. A, AEA (n = 6); B, oleoylethanolamine (n = 6); C, palmitoylethanolamine (n = 6); D, 2-AG (n = 6); E, monopalmitin (n = 6); F, monolinolenin (n = 6). Data are mean ± S.E., analyzed using one-way ANOVA with Tukey's post hoc test. Results with different letters within dietary treatment are significantly different (p < 0.05).
DISCUSSION
The human intestine can process large quantities of dietary lipid, averaging up to 100 g in adult males on a daily basis, with a remarkable absorption efficiency of >95%. The coexpression of two members of the FABP family of lipid-binding proteins, IFABP and LFABP, has generally been thought to be related to the large lipid processing needs of the enterocytes; however, it has not been entirely clear why two related proteins, both of which bind long chain FA, are present. In this regard, the ileal lipid-binding protein, another FABP family member found in the distal small intestine, may also contribute to fat absorption in view of the fact that this protein can also bind fatty acids (45, 46). Indeed, the FABP protein family differs from many other classes of lipid-binding proteins in having more than 10 separate genes, each with a different tissue distribution, in contrast to the more typical expression of the same gene in many or all tissues, for other classes of lipid-binding proteins (47).
Because there are some ligand binding differences between IFABP and LFABP (13, 48) and because we demonstrated differences in in vitro FA transport properties (10–12), we directly compared mice null for each of these genes to determine whether physiological differences would be observed. Our initial studies, using male mice fed laboratory chow, showed a modest FA trafficking defect for the IFABP−/− mice, a modest MG trafficking defect for the LFABP−/− mice, and defective mucosal FA oxidation in the LFABP−/− but not IFABP−/− mice. Although no differences in body weights were found, differential changes in body composition in response to fasting were observed, suggesting that each of these FABPs has a different impact on whole body energy metabolism (25). Hence, in this study, we fed high fat diets containing TG rich in long chain FA to generate an abundance of long chain FA and MG in the intestinal lumen, hypothesizing that more striking phenotypic changes in IFABP−/− and LFABP−/− mice would be revealed to help elucidate unique functions of these related proteins. Remarkably, highly divergent whole body phenotypes were found.
The LFABP−/− mice displayed increases in body weight and body fat mass relative to WT when fed high fat diets. The mice used in these studies were derived from the LFABP null mouse, which was generated by Martin et al., using the C57BL/6N background strain, and first described in 2003 (15). The mice had been backcrossed six generations onto the C57BL/6N strain and were subsequently backcrossed another six generations onto the C57BL/6J strain upon arrival to our laboratory, as described previously (25). In agreement with the present findings, Martin et al. (15, 49) found that male and female LFABP−/− mice were prone to obesity when fed high LCFA diets, with increases in body weight and FM relative to WT mice; this body weight phenotype has been repeated several times (18, 19, 20, 49). Interestingly, the body weight data are in contrast to findings by Newberry et al. (14, 22, 50), who generated a separate LFABP−/− mouse on a mixed C57BL6 and SV129 background, then backcrossed to the C57BL/6J wild type strain. In those studies, female LFABP−/− mice fed diets containing high levels of medium chain saturated FA (40 kcal % fat as hydrogenated coconut oil) had lower BW relative to WT mice (22, 50). Both lines showed apparent decreases in hepatic FA β-oxidation and lower levels of hepatic TG (14, 16, 51, 52). We find reduced intestinal FA oxidation in the LFABP−/− mice as well, both on chow (25) and high fat diets, supporting a tissue-independent function for LFABP in FA oxidation. It is likely that these effects on oxidation are not caused by diminished oxidative capacity, but rather by defective FA trafficking.
Despite consistent effects of LFABP ablation on FA oxidation and liver TG, the increased body weights and total body fat observed in this study and those of Schroeder and co-workers (15, 18, 20, 49), is different from the reduced body weights seen in the Missouri LFABP−/− mice. The differences may in part be related to sex, as female mice tend to be more resistant to obesity during high fat feeding relative to males (53, 54) and have higher levels of LFABP protein in the liver (55). Furthermore, the diets may play a role in the outcome differences between studies. The high saturated and unsaturated fat diets in this study and those from the studies by Schroeder and co-workers (18, 20) contain sources of LCFA, used to model the more common lipids in the human diet. The long chain 2-MGs and FAs released by pancreatic lipase in the intestinal lumen enter the enterocyte where they are then used to generate TG, which is incorporated into chylomicrons that enter the lymphatic system and then the general circulation. MCFA, used in the studies of the Missouri LFABP−/− mice (22, 50), are more soluble in the hydrophilic cytosol and do not bind to FABPs. MCFA are metabolized differently than LCFA in that they are not included in chylomicrons, but rather directly enter the liver via the portal vein and therefore do not first enter the general circulation (56). In addition, it has been shown that diets containing MCFA are not as obesogenic as those containing LCFA (57–59). Therefore, metabolism of the FA may differ and may provide some clues for the differences in the results. Nevertheless, Newberry et al. (17, 36) reported that a Western diet (40 kcal % milk fat with 0.21% cholesterol) also resulted in decreased weight gain compared with WT, although differences in males were not as large as in females (17). A number of other differences could contribute to the divergence in body weight phenotype, including residual background gene differences, the gene targeting constructs employed, the potential for residual small fragments of the LFABP (60), or perhaps the environmental effects of the facilities in which each mouse line is housed, as has been recently shown to impact susceptibility to diet-induced obesity in two separately housed but isogenic mouse strains (61).
In dramatic contrast to the results in LFABP−/− mice, under identical conditions, the IFABP−/− mice fed a HFS diet displayed 30% less weight gain compared with WT mice, which was accompanied by a reduction in food intake. No changes in fecal fat were found, and thus lipid malabsorption did not account for the lower weight gains observed. The IFABP−/− mice had a trend toward lower feed efficiency, i.e. less weight gain per calorie consumed, on both HF diets; however, the results did not reach statistical significance. In further contrast to the LFABP null mice, IFABP ablation resulted in a very lean phenotype, with significantly lower FM and greater lean mass. The IFABP−/− mice also displayed consistently higher losses of fat mass during fasting.
As noted above, the body weight phenotype found in this study, using a substrain of IFABP−/− mice that were nonetheless bred by intercrossing, differs from that observed in the original line (23, 24). Indeed, in earlier studies we found that the effects of IFABP deletion in the original IFABP−/− line appear to be sensitive to sex, age, and diet (23, 24, 62). Similarly, although we found that chow-fed IFABP−/− mice from the substrain showed no change in body weight through 20 weeks of age (25), these same mice in this study, also examined through 20 weeks of age and fed HFS for 12 weeks, showed significantly lower body weight gain than WT mice. Moreover, female IFABP−/− mice fed a high fat chow diet with added cocoa butter and 1.25% cholesterol also had lower body weights than WT; however, by contrast the male mice were heavier (24). On a high safflower oil diet that was fed for 2 weeks, older (30–40 week) male and female IFABP−/− mice both gained more weight than WT mice, whereas on a high beef tallow diet, the males were found to have slightly (9%) higher body weights, with female IFABP−/− mice of the same age and on the same diet showing no body weight change (23). In addition to body weight differences, the relative absence of gene expression changes found by quantitative PCR analysis of mucosal samples for male IFABP−/− mice in this study is in contrast with results of a microarray analysis of intestinal RNA of male IFABP−/− mice from the original line, which showed significant differences compared with WT males, including increased expression of genes involved in fatty acid metabolism (63).
It will be of great interest to determine the underlying reasons behind the discrepant phenotype exhibited by the two IFABP−/− lines from a common founder, and future studies will address this issue. Irrespective of the origin(s) of the body weight gain results under different conditions, the present direct comparison of IFABP and LFABP null mice under identical conditions of age, sex, and diet highlights the dramatically different outcomes for body weights and body composition, strongly supporting distinct roles of the two FABPs in the regulation of whole body energy metabolism.
The IFABP−/− and LFABP−/− mice also displayed differences in fuel utilization, which appear to be driven by lipid stores. The very lean IFABP mice, with low body fat, have a higher RER indicative of increased carbohydrate oxidation, whereas the obese LFABP mice display a lower RER indicative of increased fat utilization. When adjusted for lean mass, the LFABP−/− mice displayed higher energy expenditure on the high unsaturated fat diet and were surprisingly more active, despite their much higher body weights and adiposity. Interestingly, feeding a high saturated fat diet did not promote changes in plasma glucose or insulin levels in the LFABP−/− mice, despite their being markedly obese. The IFABP−/− mice, by contrast, had lower plasma glucose levels and a higher adiponectin index, reflecting increased insulin sensitivity and fat-free mass. In both genotypes, plasma leptin values varied as expected with adipose tissue mass; thus, LFABP−/− mice fed HFS or HFU had elevated plasma leptin levels, and IFABP−/− mice had markedly lower circulating leptin levels than the LFABP null mice (64–66).
Because LFABP is involved in chylomicron assembly (67, 68), and because we and others have recently shown that obesity and high fat feeding result in substantially reduced rates of TG secretion from the intestine (69, 70), we expected to see a lower TG secretion rate from the LFABP−/− intestine during an oral fat tolerance test (17). However, as found previously for chow-fed LFABP−/− (25), blood TG values were not different from WT in the high fat fed LFABP−/− mice. Thus, the LFABP null mice, even in the face of marked obesity, display normal intestinal TG secretion. The IFABP−/− mice, in contrast, exhibited an increase in secretion of TG relative to WT during HFS feeding. As IFABP appears not to be involved in chylomicron formation (67), the increased TG secretion likely correlates with the more rapid intestinal secretion observed in lean mice (69, 70).
The site of FA and MG entry into the enterocyte (apical versus basolateral) determines their metabolic fate, with lipids from the bloodstream primarily incorporated into PL or oxidized, in contrast to dietary FA and MG that are primarily esterified in TG (31, 71). The mechanisms underlying this “metabolic compartmentation” are unknown. Here, we found that chronic feeding of a high fat diet promotes a decrease in bloodstream FA incorporation into TG relative to PL in both the IFABP and LFABP null mice, effects that were largely absent in chow-fed mice (25) and in the present low fat diet-fed mice. Thus, high fat feeding exacerbates the effects of IFABP and LFABP ablation on FA trafficking, particularly for FA entering the enterocyte from the bloodstream. By contrast, this potentiating effect of high fat feeding on FA metabolism was not found for MG metabolism. In particular, the decreased incorporation of diet-derived MG into TG relative to PL observed in chow-fed mice (25) was also found in this study for both low fat and high fat-fed mice. Thus, LFABP is involved in trafficking of diet-derived MG under all dietary conditions examined, consistent with it being the MG binding and transport protein in cytosol (9). Analysis of ILBP ablated mice demonstrated a defect in mucosal to serosal transport of taurocholic acid in everted gut sacs and supports the idea that FABPs are involved in the cellular transport of their respective ligands (72).
We also found that LFABP ablation results in a reduction in mucosal oxidation of the administered radiolabeled oleate in both LFD and HFS-fed LFABP−/− mice, in keeping with our previous results in chow-fed mice (25). Reduced hepatic oxidation of FA and ketones in LFABP−/− mice has also been reported (14, 16, 36, 60). Taken together, the results strongly support a role for LFABP in trafficking of FA substrates toward oxidative pathways. Decreased FA oxidation could, in part, give rise to the obese phenotype observed in the LFABP−/− mice herein.
Changes in food intake may also contribute to the body weight and fat changes in the LFABP−/− and IFABP−/− mice. Although no changes in caloric consumption of the LFABP−/− mice were found on the LFD, as observed previously with chow feeding (25), an ∼20% increase in caloric intake was observed with the HFS diet in particular, and an increased “food efficiency” was found on both high fat diets. In the IFABP−/− mice, decreased food intake and efficiency were found. Higher mucosal levels of the orexigenic endocannabinoids 2-AG and AEA on the HFS diet may be involved in the apparent increase in the appetite of LFABP−/− mice; higher levels of 2-linoleoylglycerol were also found, and this has been suggested to be a weak cannabinoid receptor type 1 agonist (73). In contrast, 2-AG levels appeared lower in the mucosa of IFABP−/− mice.
Although endocannabinoid activity in the central nervous system is well known to impact appetitive behavior, recent evidence suggests that the gut endocannabinoid system may also be important in the regulation of food intake and that specific nutrients may regulate gut endocannabinoid levels (74, 75). For example, fasting increased and re-feeding decreased intestinal 2-AG and AEA levels and also modulated cannabinoid receptor 1 expression in vagal afferents innervating the gastrointestinal tract (76). In genetically obese rats, intestinal 2-AG levels were shown to be markedly elevated, and the abovementioned postprandial reduction was diminished, relative to lean rats (77). Furthermore, it has been recently shown that ingestion of mono- and dienoic fatty acids, but not sucrose, protein, or saturated fatty acids, led to increased jejunal levels of 2-AG and AEA (78, 79). Thus, the observed alterations in mucosal 2-AG levels in the enterocyte FABP null mice may be involved in their altered food intake and may also be related to altered fatty acid trafficking secondary to FABP absence.
Indeed, we recently showed that LFABP binds long chain monoacylglycerols, including the endocannabinoid 2-AG, and several FABPs have been reported to bind AEA (41, 42). Thus, alterations in endocannabinoid levels secondary to FABP ablation may be involved in the appetite and body weight phenotypes observed. However, because it is not thought that IFABP binds the endocannabinoids, the link between intestinal IFABP ablation and altered endocannabinoid status is not clear. Notably, we found no changes in levels of either MGL or FAAH in LFABP−/− or IFABP−/− compared with WT mucosa; thus, the results support a ligand availability and/or transport defect rather than a transcriptionally mediated change in enzyme activity. The genes encoding for FA and MG metabolic enzymes, both anabolic and catabolic, are also essentially unchanged relative to WT in response to high fat feeding in the mucosa of either the LFABP−/− or IFABP−/− mice, again indicating that the functions of both of these enterocyte proteins involves intracellular ligand transport and, likely, targeting.
It is interesting to note that the LFABP null mouse, although obese, is nevertheless surprisingly healthy; it is normoglycemic and normoinsulinemic, has reduced hepatic steatosis (22, 50), intestinal TG secretion rates similar to a lean mouse, and appears more active than the WT mouse. Indeed, preliminary studies suggest that LFABP−/− mice have a greater exercise tolerance than WT mice, despite their obese phenotype (results not shown). The IFABP−/− mice in this study are also healthy, with greater FFM, higher intestinal lipid secretion rates, lower plasma glucose and cholesterol levels, and a higher adiponectin index. We observed small but significant differences in food intake, and preliminary experiments using singly housed older mice also suggest that lower caloric consumption might in fact be playing a role in the IFABP−/− phenotype (results not shown). Studies are also underway to examine fuel utilization in muscle and adipose tissue to further understand how the loss of IFABP in the intestine impacts whole body metabolism as well as fat and lean mass deposition. Overall, the present results suggest that simultaneous inhibition of the two enterocyte FABPs may prove useful for promoting a healthy phenotype and preventing high fat diet-associated metabolic changes. However, given the different body weight phenotype of the original IFABP−/− line, as well as the differences displayed by the two independently generated LFABP−/− lines, it is important to consider the remarkably multifactorial nature of obesity, with multiple genetic and environmental factors contributing to body weight outcome (80). Thus, it is perhaps not surprising that IFABP or LFABP ablation per se may not be a dominant determinant of body weight or whole body energy metabolism. As well, although most obesity is associated with unhealthy comorbidities, an appreciation for the “medically healthy but obese (MHO)” state is emerging (81); in this regard, it is noteworthy that for the LFABP null mice, a healthy metabolic phenotype is contemporaneous with markedly higher body weight and adiposity.
Ablation of LFABP or IFABP results in changes that appear to be greater at the systemic level than at the cellular level, with both knock-out models displaying large alterations in whole body energy homeostasis. Although high fat feeding did significantly exacerbate the changes in enterocyte FA metabolic fate found for low fat fed mice, and although MG metabolism was consistently impacted in the LFABP−/− mice, these effects remained relatively modest overall, i.e. no fat malabsorption was found, for example. By contrast, the deficiency in either IFABP or LFABP was seen to cause profound systemic effects. These results contribute to a growing appreciation of the important link between intestinal lipid metabolism and whole body energy balance. For instance, ablation of the intestinal TG synthesis enzymes diglyceride acyltransferase 1 or monoglyceride acyltransferase 2 resulted in more substantial changes in whole body energy homeostasis, with both lines exhibiting a lean phenotype, than in cellular lipid metabolism (82–84). Furthermore, we recently showed that intestine-specific overexpression of the hydrolytic enzyme MGL led to an obese phenotype, with relatively modest effects on intestinal lipid metabolism (32). As in this study, the mechanisms underlying all these changes are not completely understood; however, together they point to the important linkage between intestinal lipid metabolic enzymes and whole body energy homeostasis. For the LFABP−/− mouse, the whole body phenotype undoubtedly results from a combination of liver-specific and intestine-specific effects. These associations with whole body energy homeostasis may not be caused by changes in levels of enzymatic pathways themselves but, more likely, via alterations in signaling pathways, which regulate activity, food intake, and energy utilization (69).
In summary, this study demonstrates that IFABP and LFABP, despite being coexpressed and homologous proteins that bind long chain fatty acids, play unique roles in intestinal lipid processing, with each FABP distinctly involved in downstream signaling to the body. Ablation of LFABP results in marked obesity on a high fat diet, yet the mice remain apparently healthy. Ablation of IFABP, in contrast, results in a lean phenotype with lower plasma glucose levels in certain circumstances. Although the LFABP−/− phenotype likely arises from changes occurring in both tissues where the gene is normally expressed, the liver and the intestine, the IFABP−/− phenotype arises secondary to alterations in intestinal mucosa alone. Tissue-specific ablation of LFABP will help elucidate the origin of the body weight phenotype. As well, simultaneous ablation of both these FABPs in the enterocyte will further enable an understanding of the role of the FABPs in lipid absorption and intestinal secretion.
Acknowledgments
We thank Dr. Bert Binas (Hanyang University, Korea) for providing LFABP null mice used to generate the present colony. We also thank Dr. Suhyoun Chon and John Douglass for helpful discussions. Requests for IFABP-null mice may require a formal agreement with Novartis.
This work was supported, in whole or in part, by National Institutes of Health Grant DK-38389 from NIDDK. This work was also supported by funds from the New Jersey Agricultural Experiment Station (to J. S.) and in part by the Canadian Institute of Health Research (to L. B. A.).
- TG
- triglyceride
- FABP
- fatty acid-binding protein
- IFABP
- intestinal-fatty acid-binding protein
- LFABP
- liver-fatty acid-binding protein
- FA
- fatty acid
- PL
- phospholipid
- 2-AG
- 2-arachidonoylglycerol
- AEA
- N-arachidonoylethanolamine
- MG
- monoacylglycerol
- HFS
- high saturated fat diet
- LFD
- low fat diet
- HFU
- high unsaturated fat diet
- LCFA
- long chain fatty acid
- BW
- body weight
- MCFA
- medium chain fatty acid
- MGL
- monoacylglycerol lipase
- PPARα
- peroxisome proliferator-activated receptor α cannabinoid receptor type 1
- FAAH
- fatty acid amide hydrolase
- ANOVA
- analysis of variance
- RER
- respiratory exchange ratio
- EE
- energy expenditure
- FFM
- fat-free mass.
REFERENCES
- 1. Kennedy E. T., Bowman S. A., Powell R. (1999) Dietary-fat intake in the U.S. population. J. Am. Coll. Nutr. 18, 207–212 [DOI] [PubMed] [Google Scholar]
- 2. Mishkin S., Stein L., Gatmaitan Z., Arias I. M. (1972) The binding of fatty acids to cytoplasmic proteins: binding to Z protein in liver and other tissues of the rat. Biochem. Biophys. Res. Commun. 47, 997–1003 [DOI] [PubMed] [Google Scholar]
- 3. Ockner R. K., Manning J. A., Poppenhausen R. B., Ho W. K. (1972) A binding protein for fatty acids in cytosol of intestinal mucosa, liver, myocardium, and other tissues. Science 177, 56–58 [DOI] [PubMed] [Google Scholar]
- 4. Gordon J. I., Elshourbagy N., Lowe J. B., Liao W. S., Alpers D. H., Taylor J. M. (1985) Tissue specific expression and developmental regulation of two genes coding for rat fatty acid binding proteins. J. Biol. Chem. 260, 1995–1998 [PubMed] [Google Scholar]
- 5. Levy E., Ménard D., Delvin E., Montoudis A., Beaulieu J. F., Mailhot G., Dubé N., Sinnett D., Seidman E., Bendayan M. (2009) Localization, function and regulation of the two intestinal fatty acid-binding protein types. Histochem. Cell Biol. 132, 351–367 [DOI] [PubMed] [Google Scholar]
- 6. Murphy E. J., Prows D. R., Jefferson J. R., Schroeder F. (1996) Liver fatty acid-binding protein expression in transfected fibroblasts stimulates fatty acid uptake and metabolism. Biochim. Biophys. Acta 1301, 191–198 [DOI] [PubMed] [Google Scholar]
- 7. Alpers D. H., Bass N. M., Engle M. J., DeSchryver-Kecskemeti K. (2000) Intestinal fatty acid binding protein may favor differential apical fatty acid binding in the intestine. Biochim. Biophys. Acta 1483, 352–362 [DOI] [PubMed] [Google Scholar]
- 8. Wolfrum C., Borchers T., Sacchettini J. C., Spener F. (2000) Binding of fatty acids and peroxisome proliferators to orthologous fatty acid binding proteins from human, murine, and bovine liver. Biochemistry 39, 14363. [DOI] [PubMed] [Google Scholar]
- 9. Lagakos W. S., Guan X., Ho S.-Y., Sawicki L. R., Corsico B., Kodukula S., Murota K., Stark R. E., Storch J. (2013) Liver fatty acid-binding protein binds monoacylglycerol in vitro and in mouse liver cytosol. J. Biol. Chem. 288, 19805–19815 [DOI] [PMC free article] [PubMed] [Google Scholar]
- 10. Hsu K. T., Storch J. (1996) Fatty acid transfer from liver and intestinal fatty acid-binding proteins to membranes occurs by different mechanisms. J. Biol. Chem. 271, 13317–13323 [DOI] [PubMed] [Google Scholar]
- 11. Corsico B., Cistola D. P., Frieden C., Storch J. (1998) The helical domain of intestinal fatty acid binding protein is critical for collisional transfer of fatty acids to phospholipid membranes. Proc. Natl. Acad. Sci. U.S.A. 95, 12174–12178 [DOI] [PMC free article] [PubMed] [Google Scholar]
- 12. Falomir-Lockhart L. J., Franchini G. R., Guerbi M. X., Storch J., Córsico B. (2011) Interaction of enterocyte FABPs with phospholipid membranes: clues for specific physiological roles. Biochim. Biophys. Acta 1811, 452–459 [DOI] [PMC free article] [PubMed] [Google Scholar]
- 13. Richieri G. V., Ogata R. T., Kleinfeld A. M. (1994) Equilibrium constants for the binding of fatty acids with fatty acid-binding proteins from adipocyte, intestine, heart, and liver measured with the fluorescent probe ADIFAB. J. Biol. Chem. 269, 23918–23930 [PubMed] [Google Scholar]
- 14. Newberry E. P., Xie Y., Kennedy S., Han X., Buhman K. K., Luo J., Gross R. W., Davidson N. O. (2003) Decreased hepatic triglyceride accumulation and altered fatty acid uptake in mice with deletion of the liver fatty acid-binding protein gene. J. Biol. Chem. 278, 51664–51672 [DOI] [PubMed] [Google Scholar]
- 15. Martin G. G., Danneberg H., Kumar L. S., Atshaves B. P., Erol E., Bader M., Schroeder F., Binas B. (2003) Decreased liver fatty acid binding capacity and altered liver lipid distribution in mice lacking the liver fatty acid-binding protein gene. J. Biol. Chem. 278, 21429–21438 [DOI] [PubMed] [Google Scholar]
- 16. Erol E., Kumar L. S., Cline G. W., Shulman G. I., Kelly D. P., Binas B. (2004) Liver fatty acid-binding protein is required for high rates of hepatic fatty acid oxidation but not for the action of PPAR-α in fasting mice. FASEB J. 18, 347–349 [DOI] [PubMed] [Google Scholar]
- 17. Newberry E. P., Xie Y., Kennedy S. M., Luo J., Davidson N. O. (2006) Protection against Western diet-induced obesity and hepatic steatosis in liver fatty acid-binding protein knockout mice. Hepatology 44, 1191–1205 [DOI] [PubMed] [Google Scholar]
- 18. Atshaves B. P., McIntosh A. L., Storey S. M., Landrock K. K., Kier A. B., Schroeder F. (2010) High dietary fat exacerbates weight gain and obesity in female liver fatty acid binding protein gene-ablated mice. Lipids 45, 97–110 [DOI] [PMC free article] [PubMed] [Google Scholar]
- 19. Martin G. G., Atshaves B. P., McIntosh A. L., Payne H. R., Mackie J. T., Kier A. B., Schroeder F. (2009) Liver fatty acid binding protein gene ablation enhances age-dependent weight gain in male mice. Mol. Cell. Biochem. 324, 101–115 [DOI] [PMC free article] [PubMed] [Google Scholar]
- 20. McIntosh A. L., Atshaves B. P., Landrock D., Landrock K. K., Martin G. G., Storey S. M., Kier A. B., Schroeder F. (2013) Liver fatty acid binding protein gene-ablation exacerbates weight gain in high fat fed female mice. Lipids 48, 435–448 [DOI] [PMC free article] [PubMed] [Google Scholar]
- 21. Newberry E. P., Kennedy S. M., Xie Y., Luo J., Stanley S. E., Semenkovich C. F., Crooke R. M., Graham M. J., Davidson N. O. (2008) Altered hepatic triglyceride content after partial hepatectomy without impaired liver regeneration in multiple murine genetic models. Hepatology 48, 1097–1105 [DOI] [PMC free article] [PubMed] [Google Scholar]
- 22. Newberry E. P., Kennedy S. M., Xie Y., Luo J., Crooke R. M., Graham M. J., Fu J., Piomelli D., Davidson N. O. (2012) Decreased body weight and hepatic steatosis with altered fatty acid ethanolamide metabolism in aged L-Fabp−/− mice. J. Lipid Res. 53, 744–754 [DOI] [PMC free article] [PubMed] [Google Scholar]
- 23. Agellon L. B., Drozdowski L., Li L., Iordache C., Luong L., Clandinin M. T., Uwiera R. R., Toth M. J., Thomson A. B. (2007) Loss of intestinal fatty acid binding protein increases the susceptibility of male mice to high fat diet-induced fatty liver. Biochim. Biophys. Acta 1771, 1283–1288 [DOI] [PubMed] [Google Scholar]
- 24. Vassileva G., Huwyler L., Poirier K., Agellon L. B., Toth M. J. (2000) The intestinal fatty acid binding protein is not essential for dietary fat absorption in mice. FASEB J. 14, 2040–2046 [DOI] [PubMed] [Google Scholar]
- 25. Lagakos W. S., Gajda A. M., Agellon L., Binas B., Choi V., Mandap B., Russnak T., Zhou Y. X., Storch J. (2011) Different functions of intestinal and liver-type fatty acid-binding proteins in intestine and in whole body energy homeostasis. Am. J. Physiol. Gastrointest. Liver Physiol. 300, G803–G814 [DOI] [PMC free article] [PubMed] [Google Scholar]
- 26. McIntosh A. L., Atshaves B. P., Hostetler H. A, Huang H., Davis J., Lyuksyutova O. I., Landrock D., Kier A. B., Schroeder F. (2009) Liver type fatty acid binding protein (L-FABP) gene ablation reduces nuclear ligand distribution and peroxisome proliferator-activated receptor-α activity in cultured primary hepatocytes. Arch. Biochem. Biophys. 485, 160–173 [DOI] [PMC free article] [PubMed] [Google Scholar]
- 27. Lusk G. (1928) The Elements of Science of Nutrition., 4th Ed., Saunders, Philadelphia [Google Scholar]
- 28. McLean J., Tobin C. (1987) Animal and Human Calorimetry, pp. 30–32, Cambridge University Press, New York [Google Scholar]
- 29. Tschöp M. H., Speakman J. R., Arch J. R., Auwerx J., Brüning J. C., Chan L., Eckel R. H., Farese R. V., Galgani J. E., Hambly C., Herman M. A., Horvath T. L., Kahn B. B., Kozma S. C., Maratos-Flier E., Müller T. D., Münzberg H., Pfluger P. T., Plum L., Reitman M. L., Rahmouni K., Shulman G. I., Thomas G., Kahn C. R., Ravussin E. (2012) A guide to analysis of mouse energy metabolism. Nat. Methods 9, 57–63 [DOI] [PMC free article] [PubMed] [Google Scholar]
- 30. Folch J., Lees M., Sloane-Stanley G. (1957) A simple method for the isolation and purification of total lipides from animal tissues. J. Biol. Chem. 226, 497–509 [PubMed] [Google Scholar]
- 31. Storch J., Zhou Y. X., Lagakos W. S. (2008) Metabolism of apical versus basolateral sn-2-monoacylglycerol and fatty acids in rodent small intestine. J. Lipid Res. 49, 1762–1769 [DOI] [PMC free article] [PubMed] [Google Scholar]
- 32. Chon S.-H., Douglass J. D., Zhou Y. X., Malik N., Dixon J. L., Brinker A., Quadro L., Storch J. (2012) Over-expression of monoacylglycerol lipase (MGL) in small intestine alters endocannabinoid levels and whole body energy balance, resulting in obesity. PLoS One 7, e43962. [DOI] [PMC free article] [PubMed] [Google Scholar]
- 33. Nishiumi S., Bessyo H., Kubo M., Aoki Y., Tanaka A., Yoshida K., Ashida H. (2010) Green and black teas suppress hyperglycemia and insulin resistance by retaining the expression of glucose transporter 4 in muscle of high fat diet-fed C57BL/6J mice. J. Agric. Food Chem. 58, 12916–12923 [DOI] [PubMed] [Google Scholar]
- 34. Matthews D. R., Hosker J. P., Rudenski A. S., Naylor B. A., Treacher D. F., Turner R. C. (1985) Homeostasis model assessment: insulin resistance and beta-cell function from fasting plasma glucose and insulin concentrations in man. Diabetologia 28, 412–419 [DOI] [PubMed] [Google Scholar]
- 35. Chon S.-H., Zhou Y. X., Dixon J. L., Storch J. (2007) Intestinal monoacylglycerol metabolism: developmental and nutritional regulation of monoacylglycerol lipase and monoacylglycerol acyltransferase. J. Biol. Chem. 282, 33346–33357 [DOI] [PubMed] [Google Scholar]
- 36. Newberry E. P., Kennedy S. M., Xie Y., Luo J., Davidson N. O. (2009) Diet-induced alterations in intestinal and extrahepatic lipid metabolism in liver fatty acid binding protein knockout mice. Mol. Cell. Biochem. 326, 79–86 [DOI] [PMC free article] [PubMed] [Google Scholar]
- 37. Storch J. (1993) Diversity of fatty acid-binding protein structure and function: studies with fluorescent ligands. Mol. Cell. Biochem. 123, 45–53 [DOI] [PubMed] [Google Scholar]
- 38. Storch J., Herr F. M. (2001) in Nutrient-Gene Interactions in Health and Disease (Moustaid-Moussa N., Berdanier C. D., eds) pp. 101–130, CRC Press, Boca Raton, FL [Google Scholar]
- 39. Cao J., Hawkins E., Brozinick J., Liu X., Zhang H., Burn P., Shi Y. (2004) A predominant role of acyl-CoA:monoacylglycerol acyltransferase-2 in dietary fat absorption implicated by tissue distribution, subcellular localization, and up-regulation by high fat diet. J. Biol. Chem. 279, 18878–18886 [DOI] [PubMed] [Google Scholar]
- 40. Hostetler H. A., McIntosh A. L., Atshaves B. P., Storey S. M., Payne H. R., Kier A. B., Schroeder F. (2009) L-FABP directly interacts with PPARα in cultured primary hepatocytes. J. Lipid Res. 50, 1663–1675 [DOI] [PMC free article] [PubMed] [Google Scholar]
- 41. Kaczocha M., Glaser S. T., Deutsch D. G. (2009) Identification of intracellular carriers for the endocannabinoid anandamide. Proc. Natl. Acad. Sci. U.S.A. 106, 6375–6380 [DOI] [PMC free article] [PubMed] [Google Scholar]
- 42. Kaczocha M., Vivieca S., Sun J., Glaser S. T., Deutsch D. G. (2012) Fatty acid-binding proteins transport N-acylethanolamines to nuclear receptors and are targets of endocannabinoid transport inhibitors. J. Biol. Chem. 287, 3415–3424 [DOI] [PMC free article] [PubMed] [Google Scholar]
- 43. Fu J., Gaetani S., Oveisi F., Lo Verme J., Serrano A., Rodríguez De Fonseca F., Rosengarth A., Luecke H., Di Giacomo B., Tarzia G., Piomelli D. (2003) Oleylethanolamide regulates feeding and body weight through activation of the nuclear receptor PPAR-α. Nature 425, 90–93 [DOI] [PubMed] [Google Scholar]
- 44. Lo Verme J., Fu J., Astarita G., La Rana G., Russo R., Calignano A., Piomelli D. (2005) The nuclear receptor peroxisome proliferator-activated receptor-α mediates the anti-inflammatory actions of palmitoylethanolamide. Mol. Pharmacol. 67, 15–19 [DOI] [PubMed] [Google Scholar]
- 45. Labonté E. D., Li Q., Kay C. M., Agellon L. B. (2003) The relative ligand binding preference of the murine ileal lipid binding protein. Protein Expr. Purif. 28, 25–33 [DOI] [PubMed] [Google Scholar]
- 46. Sacchettini J. C., Hauft S. M., Van Camp S. L., Cistola D. P., Gordon J. I. (1990) Developmental and structural studies of an intracellular lipid binding protein expressed in the ileal epithelium. J. Biol. Chem. 265, 19199–19207 [PubMed] [Google Scholar]
- 47. Storch J., Corsico B. (2008) The emerging functions and mechanisms of mammalian fatty acid-binding proteins. Annu. Rev. Nutr. 28, 73–95 [DOI] [PubMed] [Google Scholar]
- 48. Richieri G. V., Ogata R. T., Zimmerman A. W., Veerkamp J. H., Kleinfeld A. M. (2000) Fatty acid binding proteins from different tissues show distinct patterns of fatty acid interactions. Biochemistry 39, 7197–7204 [DOI] [PubMed] [Google Scholar]
- 49. Martin G. G., Atshaves B. P., McIntosh A. L., Mackie J. T., Kier A. B., Schroeder F. (2008) Liver fatty acid-binding protein gene-ablated female mice exhibit increased age-dependent obesity. J. Nutr. 138, 1859–1865 [DOI] [PMC free article] [PubMed] [Google Scholar]
- 50. Newberry E. P., Kennedy S. M., Xie Y., Sternard B. T., Luo J., Davidson N. O. (2008) Diet-induced obesity and hepatic steatosis in L-Fabp/mice is abrogated with SF, but not PUFA, feeding and attenuated after cholesterol supplementation. Am. J. Physiol. Gastrointest. Liver Physiol. 294, G307–G314 [DOI] [PubMed] [Google Scholar]
- 51. Atshaves B. P., McIntosh A. M., Lyuksyutova O. I., Zipfel W., Webb W. W., Schroeder F. (2004) Liver fatty acid-binding protein gene ablation inhibits branched chain fatty acid metabolism in cultured primary hepatocytes. J. Biol. Chem. 279, 30954–30965 [DOI] [PubMed] [Google Scholar]
- 52. Xie Y., Newberry E. P., Kennedy S. M., Luo J., Davidson N. O. (2009) Increased susceptibility to diet-induced gallstones in liver fatty acid binding protein knockout mice. J. Lipid Res. 50, 977–987 [DOI] [PMC free article] [PubMed] [Google Scholar]
- 53. Stubbins R. E., Holcomb V. B., Hong J., Núñez N. P. (2012) Estrogen modulates abdominal adiposity and protects female mice from obesity and impaired glucose tolerance. Eur. J. Nutr. 51, 861–870 [DOI] [PubMed] [Google Scholar]
- 54. Stubbins R. E., Najjar K., Holcomb V. B., Hong J., Núñez N. P. (2012) Oestrogen alters adipocyte biology and protects female mice from adipocyte inflammation and insulin resistance. Diabetes Obes. Metab. 14, 58–66 [DOI] [PMC free article] [PubMed] [Google Scholar]
- 55. Bass N. M., Manning J. A, Ockner R. K., Gordon J. I., Seetharam S., Alpers D. H. (1985) Regulation of the biosynthesis of two distinct fatty acid-binding proteins in rat liver and intestine. Influences of sex difference and of clofibrate. J. Biol. Chem. 260, 1432–1436 [PubMed] [Google Scholar]
- 56. Bach A. C., Ingenbleek Y., Frey A. (1996) The usefulness of dietary medium chain triglycerides in body weight control: fact or fancy? J. Lipid Res. 37, 708–726 [PubMed] [Google Scholar]
- 57. Omar B., Pacini G., Ahrén B. (2012) Differential development of glucose intolerance and pancreatic islet adaptation in multiple diet induced obesity models. Nutrients 4, 1367–1381 [DOI] [PMC free article] [PubMed] [Google Scholar]
- 58. Buettner R., Parhofer K. G., Woenckhaus M., Wrede C. E., Kunz-Schughart L. A., Schölmerich J., Bollheimer L. C. (2006) Defining high fat-diet rat models: metabolic and molecular effects of different fat types. J. Mol. Endocrinol. 36, 485–501 [DOI] [PubMed] [Google Scholar]
- 59. Papamandjaris A. A., MacDougall D. E., Jones P. J. (1998) Medium chain fatty acid metabolism and energy expenditure: obesity treatment implications. Life Sci. 62, 1203–1215 [DOI] [PubMed] [Google Scholar]
- 60. Atshaves B. P., Martin G. G., Hostetler H. A., McIntosh A. L., Kier A. B., Schroeder F. (2010) Liver fatty acid-binding protein and obesity. J. Nutr. Biochem. 21, 1015–1032 [DOI] [PMC free article] [PubMed] [Google Scholar]
- 61. Kahn C. R., Bezy O., Usar S., Griffin N. W., Gordon J. I. (2013) Keystone Symposia: Diabetes-New Insights into Mechanisms of Disease and its Treatment p. 42, Keystone Symposia, Keystone, CO [Google Scholar]
- 62. Agellon L. B., Li L., Luong L., Uwiera R. R. (2006) Adaptations to the loss of intestinal fatty acid binding protein in mice. Mol. Cell. Biochem. 284, 159–166 [DOI] [PubMed] [Google Scholar]
- 63. Sugiyama M. G., Hobson L., Agellon A. B., Agellon L. B. (2012) Visualization of sex-dimorphic changes in the intestinal transcriptome of Fabp2 gene-ablated mice. J. Nutrigenet. Nutrigenomics 5, 45–55 [DOI] [PubMed] [Google Scholar]
- 64. Krempler F., Hell E., Winkler C., Breban D., Patsch W. (1998) Plasma leptin levels: Interaction of obesity with a common variant of insulin receptor substrate-1. Arterioscler. Thromb. Vasc. Biol. 18, 1686–1690 [DOI] [PubMed] [Google Scholar]
- 65. Considine R. V., Sinha M. K., Heiman M. L., Kriauciunas A., Stephens T. W., Nyce M. R., Ohannesian J. P., Marco C. C., McKee L. J., Bauer T. L. (1996) Serum immunoreactive-leptin concentrations in normal-weight and obese humans. N. Engl. J. Med. 334, 292–295 [DOI] [PubMed] [Google Scholar]
- 66. Van Heek M., Compton D. S., France C. F., Tedesco R. P., Fawzi A. B., Graziano M. P., Sybertz E. J., Strader C. D., Davis H. R., Jr. (1997) Diet-induced obese mice develop peripheral, but not central, resistance to leptin. J. Clin. Invest. 99, 385–390 [DOI] [PMC free article] [PubMed] [Google Scholar]
- 67. Neeli I., Siddiqi S. A, Siddiqi S., Mahan J., Lagakos W. S., Binas B., Gheyi T., Storch J., Mansbach C. M., 2nd (2007) Liver fatty acid-binding protein initiates budding of pre-chylomicron transport vesicles from intestinal endoplasmic reticulum. J. Biol. Chem. 282, 17974–17984 [DOI] [PubMed] [Google Scholar]
- 68. Siddiqi S., Saleem U., Abumrad N. A, Davidson N. O., Storch J., Siddiqi S. A, Mansbach C. M., 2nd (2010) A novel multiprotein complex is required to generate the prechylomicron transport vesicle from intestinal ER. J. Lipid Res. 51, 1918–1928 [DOI] [PMC free article] [PubMed] [Google Scholar]
- 69. Douglass J. D., Malik N., Chon S.-H., Wells K., Zhou Y. X., Choi A. S., Joseph L. B., Storch J. (2012) Intestinal mucosal triacylglycerol accumulation secondary to decreased lipid secretion in obese and high fat fed mice. Front. Physiol. 3, 25. [DOI] [PMC free article] [PubMed] [Google Scholar]
- 70. Uchida A., Whitsitt M. C., Eustaquio T., Slipchenko M. N., Leary J. F., Cheng J.-X., Buhman K. K. (2012) Reduced triglyceride secretion in response to an acute dietary fat challenge in obese compared with lean mice. Front. Physiol. 3, 26. [DOI] [PMC free article] [PubMed] [Google Scholar]
- 71. Gangl A., Ockner R. K. (1975) Intestinal metabolism of plasma free fatty acids. Intracellular compartmentation and mechanisms of control. J. Clin. Invest. 55, 803–813 [DOI] [PMC free article] [PubMed] [Google Scholar]
- 72. Praslickova D., Torchia E. C., Sugiyama M. G., Magrane E. J., Zwicker B. L., Kolodzieyski L., Agellon L. B. (2012) The ileal lipid binding protein is required for efficient absorption and transport of bile acids in the distal portion of the murine small intestine. PLoS One 7, e50810. [DOI] [PMC free article] [PubMed] [Google Scholar]
- 73. Lambert D. M., Fowler C. J. (2005) The endocannabinoid system: drug targets, lead compounds, and potential therapeutic applications. J. Med. Chem. 48, 5059–5087 [DOI] [PubMed] [Google Scholar]
- 74. Storr M. A., Sharkey K. A. (2007) The endocannabinoid system and gut-brain signalling. Curr. Opin. Pharmacol. 7, 575–582 [DOI] [PubMed] [Google Scholar]
- 75. Di Marzo V., Matias I. (2005) Endocannabinoid control of food intake and energy balance. Nat. Neurosci. 8, 585–589 [DOI] [PubMed] [Google Scholar]
- 76. Burdyga G., Lal S., Varro A., Dimaline R., Thompson D. G., Dockray G. J. (2004) Expression of cannabinoid CB1 receptors by vagal afferent neurons is inhibited by cholecystokinin. J. Neurosci. 24, 2708–2715 [DOI] [PMC free article] [PubMed] [Google Scholar]
- 77. Izzo A. A., Piscitelli F., Capasso R., Aviello G., Romano B., Borrelli F., Petrosino S., Di Marzo V. (2009) Peripheral endocannabinoid dysregulation in obesity: relation to intestinal motility and energy processing induced by food deprivation and re-feeding. Br. J. Pharmacol. 158, 451–461 [DOI] [PMC free article] [PubMed] [Google Scholar]
- 78. DiPatrizio N. V., Astarita G., Schwartz G., Li X., Piomelli D. (2011) Endocannabinoid signal in the gut controls dietary fat intake. Proc. Natl. Acad. Sci. U.S.A. 108, 12904–12908 [DOI] [PMC free article] [PubMed] [Google Scholar]
- 79. DiPatrizio N. V., Joslin A., Jung K.-M., Piomelli D. (2013) Endocannabinoid signaling in the gut mediates preference for dietary unsaturated fats. FASEB J. 27, 2513–2520 [DOI] [PMC free article] [PubMed] [Google Scholar]
- 80. Leamy L. J., Kelly S. A., Hua K., Pomp D. (2012) Exercise and diet affect quantitative trait loci for body weight and composition traits in an advanced intercross population of mice. Physiol. Genomics 44, 1141–1153 [DOI] [PMC free article] [PubMed] [Google Scholar]
- 81. Primeau V., Coderre L., Karelis a D., Brochu M., Lavoie M.-E., Messier V., Sladek R., Rabasa-Lhoret R. (2011) Characterizing the profile of obese patients who are metabolically healthy. Int. J. Obes. 35, 971–981 [DOI] [PubMed] [Google Scholar]
- 82. Yen C.-L., Cheong M.-L., Grueter C., Zhou P., Moriwaki J., Wong J. S., Hubbard B., Marmor S., Farese R. V., Jr. (2009) Deficiency of the intestinal enzyme acyl CoA:monoacylglycerol acyltransferase-2 protects mice from metabolic disorders induced by high fat feeding. Nat. Med. 15, 442–446 [DOI] [PMC free article] [PubMed] [Google Scholar]
- 83. Smith S. J., Cases S., Jensen D. R., Chen H. C., Sande E., Tow B., Sanan D. A., Raber J., Eckel R. H., Farese R. V., Jr. (2000) Obesity resistance and multiple mechanisms of triglyceride synthesis in mice lacking Dgat. Nat. Genetics 25, 87–90 [DOI] [PubMed] [Google Scholar]
- 84. Chen H. C., Ladha Z., Smith S. J., Farese R. V. (2003) Analysis of energy expenditure at different ambient temperatures in mice lacking DGAT1. Am. J. Physiol. Endocrinol. Metab. 284, E213–E218 [DOI] [PubMed] [Google Scholar]