

Background: Autophagy is a response to nutrient deprivation.
Results: Inhibition of autophagy does not sensitize cells to apoptotic or necrotic cell death induced by glucose starvation. Moreover, glucose deprivation inhibits autophagy.
Conclusion: 2-Deoxyglucose, but not glucose deprivation, induces autophagy.
Significance: Not all forms of starvation induce cytoprotective autophagy in mammalian cells.
Keywords: Apoptosis, Autophagy, Glucose, mTOR, Necrosis (Necrotic Death)
Abstract
In response to nutrient shortage or organelle damage, cells undergo macroautophagy. Starvation of glucose, an essential nutrient, is thought to promote autophagy in mammalian cells. We thus aimed to determine the role of autophagy in cell death induced by glucose deprivation. Glucose withdrawal induces cell death that can occur by apoptosis (in Bax, Bak-deficient mouse embryonic fibroblasts or HeLa cells) or by necrosis (in Rh4 rhabdomyosarcoma cells). Inhibition of autophagy by chemical or genetic means by using 3-methyladenine, chloroquine, a dominant negative form of ATG4B or silencing Beclin-1, Atg7, or p62 indicated that macroautophagy does not protect cells undergoing necrosis or apoptosis upon glucose deprivation. Moreover, glucose deprivation did not induce autophagic flux in any of the four cell lines analyzed, even though mTOR was inhibited. Indeed, glucose deprivation inhibited basal autophagic flux. In contrast, the glycolytic inhibitor 2-deoxyglucose induced prosurvival autophagy. Further analyses indicated that in the absence of glucose, autophagic flux induced by other stimuli is inhibited. These data suggest that the role of autophagy in response to nutrient starvation should be reconsidered.
Introduction
Autophagy is an evolutionarily conserved cellular process activated upon starvation. In the absence of nutrients, cells engulf their own components in double membrane organelles called autophagosomes. These vesicles fuse to lysosomes, which promotes degradation of the content of the autophagosomes by digestive enzymes. This process produces new metabolites that can be used as new building blocks and as sources of energy (1, 2). For this reason, autophagy promotes cell survival under starvation (3).
Knockdown of genes essential for autophagy has been widely shown to enhance cell death in response to serum and amino acid starvation. However, it is presently unclear whether autophagy can help mammalian cells survive in the absence of glucose. Autophagy protects cancer cells from the glycolytic inhibitor 2-deoxyglucose (2-DG)3 (4–6), which suggests that autophagy is a prosurvival response to glucose deprivation in mammalian cells. However, we and others (7, 8) have shown that glucose deprivation and 2-deoxyglucose do not exert cytotoxicity through the same pathways. Autophagy is a highly energy-consuming process, which involves organelle trafficking and maintenance of the ATP-dependent lysosomal pH, and it is unclear whether under conditions of low ATP autophagy would provide more energy. For this reason, we hypothesized that autophagy could actually be detrimental for cells deprived of glucose because it may end up consuming more ATP that it can produce by degrading intracellular components.
Nutrient starvation induces autophagy, at least in part, through activation of the AMP-activated protein kinase (AMPK)/mechanistic target of rapamycin (mTOR) energy sensing pathway. Activity of the autophagy-initiating complex containing ULK1 and ULK2 is controlled by mTOR and AMPK (9, 10), which are pathways regulated both by amino acids and glucose. This suggests that autophagy would be induced in a similar manner by glucose or amino acid starvation to provide nutrients for survival. Autophagy is protective for cells undergoing energetic stress such as hypoxic/hypoglycemic tumor cells, and the inhibition of autophagy was shown to promote necrotic cell death in apoptosis-deficient cells (11). We and others have previously shown that glucose deprivation kills cells either by apoptosis (caspase-dependent cell death) or necrosis (reviewed in Refs. 12 and 13). We thus aimed to study the role of autophagy in survival of cells that die by apoptosis and in cells that die by necrosis upon glucose deprivation. Surprisingly, we observed that in contrast to the current view, autophagy does not protect cells from glucose deprivation. Moreover, glucose deprivation did not induce autophagic flux.
EXPERIMENTAL PROCEDURES
Cell Culture and Treatments
The alveolar rhabdomyosarcoma cell line Rh4, Bax/Bak-deficient MEFs immortalized with SV-40 (14), HEK293 cells, and HeLa cells (American Type Culture Collection) were maintained in high-glucose (25 mm), pyruvate-free DMEM (Invitrogen) supplemented with 2 mm l-glutamine, 200 mg/ml penicillin, 100 mg/ml streptomycin sulfate, and 10% FBS (Invitrogen).
For treatments, Rh4 cells were plated at a concentration of 200,000/ml and treated in fresh medium 24 h later at 70–80% confluence (600,000/ml). HeLa and MEF cells were plated at a concentration of 150,000/ml and treated 24 h later, when they reached the concentration of 500,000/ml (1 × 10⁶/ml HEK293).
Glucose deprivation was performed by rinsing the cells twice with glucose-free DMEM (Invitrogen/Invitrogen) and incubating them in glucose-free medium with freshly added 2 mm glutamine and antibiotics, plus 10% FBS dialyzed against PBS. Control cells were incubated in the same medium plus 25 mm glucose. Q-VD-OPH (SM Biochemicals LLC) as caspase inhibitor was used at 20 μm. 10 mm 2-deoxyglucose (Sigma) was added in regular culture medium. 10 mm metformin (1-1-dimethylbiguanide hydrochloride, Sigma) was used.
For induction of autophagy, cells were incubated in amino acid and serum-free, glucose-containing starvation buffers (Earle's starvation buffer (EBSS) or Hank's balanced salt solution, Invitrogen) or with 2 μm rapamycin (Calbiochem) or NVP-BEZ-235 (Selleck) in regular medium. EBSS was supplemented with 25 mm Hepes. Autophagy inhibitors as 20 nm bafilomycin A1 (Calbiochem, dissolved in dimethyl sulfoxide), chloroquine (Sigma), 3-methyladenine (Calbiochem, prepared in glucose-free medium or in starvation buffer), pepstatin A, and E-64d (Sigma-Aldrich) were added simultaneously with the treatments unless indicated. An equal amount of dimethyl sulfoxide was added to the controls for treatments with bafilomycin.
Measurement of Cell Death
For analysis of viability, cells were harvested by combining floating cells in the medium with adherent cells that were detached by trypsinization. Then they were subjected to FACS analysis to detect incorporation of 1 μg/ml propidium iodide (10-min incubation in PBS). For sub-G1 analysis, cells were washed in PBS, fixed in 70% cold ethanol while vortexing, and incubated for 1–10 days at −20 °C. Cells were further washed, resuspended in PBS with 40 μg/ml propidium iodide and 100 μg/ml RNase A (Sigma), and incubated for 30 min at 37 °C before FACS analysis.
For analysis of cell death by incorporation of DAPI in the microscope (Fig. 3C), cells were stained with 0.5 μg/ml DAPI. 70 transfected (red) cells per condition were analyzed on an inverted Microscope Zeiss Axio Observer.Z1.
FIGURE 3.
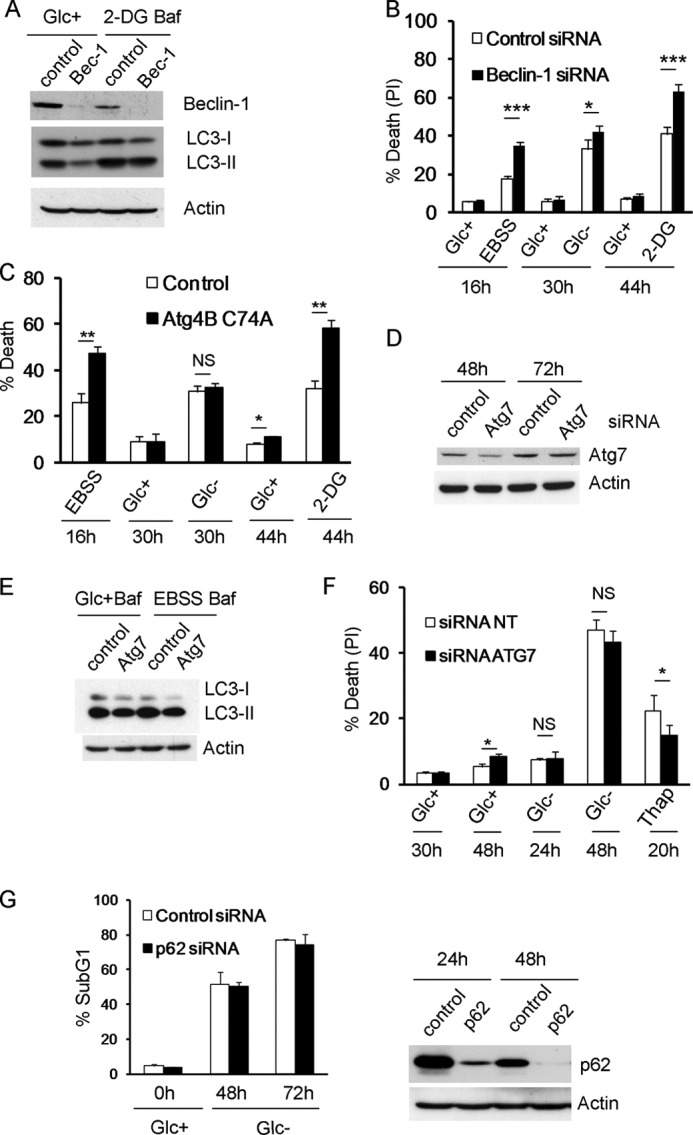
Inhibition of autophagy sensitizes to 2-deoxyglucose and starvation buffer but not to glucose deprivation. A and B, Rh4 cells were transfected with siRNA against Beclin-1 or control siRNA. A, 48 h after transfection, cells were treated with or without 2-DG for 48 h and bafilomycin (Baf) for the last 3 h of incubation. Protein was collected for Western blot. B, 48 h after transfection cells were treated with 2-DG, EBSS, or subjected to glucose deprivation for the indicated times. The average and S.E. of five experiments are shown. C, Rh4 cells were transfected with mStrawberry (Control) or mStrawberry-Atg4B (C74A) plasmids and incubated for 24 h. The cells were then cultured in EBSS, Glc+, Glc−, or 2-DG for the indicated times, and fluorescent (transfected) cells were scored as dead or alive with a low concentration of DAPI (see “Experimental Procedures”). D–F, Bax/Bak−/− MEFs were transfected with siRNA against ATG7 or control siRNA (NT, 5′-UAAGGCUAUGAGAGAUACtt). D, samples were collected for Western blot at times indicated. E, after 48 h of transfection, cells were cultured in regular culture medium or EBSS 95% + 5% medium and bafilomycin for 3 h and collected for Western blot. F, 48 h after transfection cells were cultured in Glc+, Glc−, or thapsigargin (1 μm) and collected for FACS analysis. The average and S.D. of three experiments are shown. G, Bax/Bak−/− MEFs were transfected with siRNA against p62 or control siRNA. 48 h later, they were deprived of glucose. Cell death was analyzed by sub-G1 analysis. The average and S.D. of two experiments are shown. Right panel, cells were collected at times indicated after transfection for Western blot analysis. PI, propidium iodide; NS, not significant.
Western Blotting
Cells were trypsinized, washed with PBS, lysed by resuspending them in Pierce radioimmune precipitation assay (RIPA) buffer (Thermo Scientific: 25 mmol/liter Tris-HCl (pH 7.6), 150 mm NaCl, 1% Nonidet P-40, 1% sodium deoxycholate, 0.1% SDS) plus Complete antiprotease mixture (Roche Applied Science) and phosphatase inhibitor mixture tablets PhosSTOP (Roche Applied Science), and frozen. After sonication, protein concentration was measured with BCA protein assay reagent (Pierce). Equal amounts of protein were mixed with Laemmli loading buffer. After electrophoresis, protein was transferred to a polyvinylidene difluoride membrane (Millipore) or nitrocellulose blotting membranes (Bio-Rad). PVDF membranes were blocked with 5% nonfat dry milk in Tris-buffered saline/Tween 20 (0.1%). Secondary antibodies (1:5000) were HRP-conjugated (Sigma) and detected with ECL reagent (Pierce). Nitrocellulose membranes were blocked with Odyssey blocking buffer (LI-COR Biosciences), and secondary antibodies (IRDye 800CW donkey anti-rabbit IgG1 (1:15,000) or IRDye 680LT anti-mouse IgG (1:20,000) from LI-COR Biosciences) were detected by fluorescence with the Odyssey Fc Imaging system. Primary antibodies used for Western blot were as follows: actin (ICN clone C4), LC3 (Abcam, ab48394), p62 (Progen, GP 62-C; Enzo, BML-PW9860), phospho-S6 (Cell Signaling, 2211), S6 (Upstate, 05-781R), Beclin-1 (BD Pharmingen, 612112), phospho-acetyl-CoA carboxylase (Ser-79; Cell Signaling), acetyl-CoA carboxylase (Cell Signaling C83B10), phospho-4E-BP1 (Thr-37/46) (Cell Signaling, 9459), and 4E-BP1 (Cell Signaling, 9452).
Quantification of band intensity was performed with Fiji/ImageJ software 1.47b. Intensity of LC3 bands shown was calculated relative to the actin band from the same membrane, and each experiment was normalized to the control treated with protease inhibitors or bafilomycin.
Virus Production and Generation of Stable Cell Lines
Plasmids encoding GFP-LC3 (15), Hit 60 (MoMuLV gag-pol expression plasmid), and pCG (VSV-G envelope protein expression vector) were transfected into HEK293T cells. Cells were incubated in 10-cm dishes in antibiotic-free DMEM and incubated for 6 h using 2 μl of Lipofectamine 2000 (Invitrogen) and 10 μg of DNA. Viruses were collected after 24 h (first supernatant) and 48 h (second supernatant). Then, virus-containing medium was filtered (0.45-μm SFCA membrane filter; Millipore), and aliquots were frozen.
Target cells (Rh4 and HeLa) were plated at 50% confluence and incubated overnight. For infections, the culture medium was replaced by 1 ml of first supernatant supplemented with 8 μg/ml polybrene (Sigma) in a total volume of 5 ml of DMEM+10% FBS and then incubated at 37 °C for 6 h or overnight. The infection process was repeated using the second supernatant. 48 h later, infected cell populations were selected using 1 μg/ml Zeocin (InvivoGen).
DNA and RNA Transfections and Plasmids
For DNA transfections at autophagic flux experiments, cells were incubated in 12-well dishes, and the tandem mRFP-EGFP-LC3 plasmid (ptfLC3 (16)) was transfected in antibiotic-free DMEM and incubated overnight with 1 μl of polyethylenimine (Polysciences) and 1 μg of DNA; for Atg4B (C74A) plasmid, cells were transfected with 3 μl of polyethylenimine and 1 μg of DNA. pBabeBlast-Strawberry was generated by digestion of pmStrawberry-C1 (Clontech) with NheI and BamHI. The excised insert was then blunt-ended and cloned into SnaBI-digested pBabeBlast. Orientation was determined by sequencing. mStrawberry-Atg4B-C74A was a kind gift of Tamotsu Yoshimori (Osaka University). This plasmid was digested with NheI and BamHI to isolate mStrawberry-Atg4B-C74A. This fragment was then blunt-ended and cloned into the SnaBI site of pBabe-Blast to generate pBabe-Blast-mStrawberry-Atg4B-C74A. Insert orientation was again determined by sequencing.
For transfections of siRNA, cells were incubated in antibiotic-free DMEM with 75 nmol/liter siRNA premixed with DharmaFECT 1 (Dharmacon) in 10-cm dishes. 18 h later, cells were trypsinized, plated, and 48 h after transfection were treated as indicated. Sense strain sequence for ATG7 was 5′-GUUUGUAGCCUCAAGUGUU-3′; Beclin-1 was 5′-CAGUUUGGCACAAUCAAUA-3′. As a control, a non-matching siRNA oligonucleotide (pBlue, 5′-GUAAGACACGACUUAUCGC-3′) was used. p62/SQSTM1 was down-regulated using Dharmacon (Lafayette, CO) On-Target SMARTpool (catalog no. M-047628-01); Dharmacon ON-TARGETplus non-targeting pool was used as a control.
Confocal Microscopy
Cells were cultured on glass coverslips pretreated with poly-l-lysine (Sigma), transfected with fluorescent constructs (if applicable), and treated with the indicated agents. Then, they were fixed with a fresh solution of paraformaldehyde for 15 min, washed with PBS twice, mounted in Vectashield (Vector Laboratories), and visualized at room temperature directly on a Leica TCS SP5 spectral confocal microscope with a HCX PL APO λ blue 63 × 1.4 oil objective lense. Acquisition software was LEICA application suite advanced fluorescence (version 2.6.0.7266). The projections of Z-stacks are shown. Vesicles (dots) from Z-stacks of whole-field images with multiple cells were analyzed with Fiji/ImageJ software followed by the Laplacian filter. Results are presented as mean rates and correlate with a measurement of the punctate area in a minimum of four independent images and 40 cells.
ATP Detection Assay
Cells were cultured in 96-well plates for 20 h before treatments. ATP levels were measured using ATPlite 1step Kit (PerkinElmer Life Science) following the manufacturer's instructions. Luminescence was measured at a microplate luminescence counter, Victor5 (PerkinElmer Life Science). A standard curve of ATPs was set up in the same microplate that was used for the experimental samples.
Statistics
Unless specified, a two-tailed, paired Student's t test was applied. N.S. indicates not significant; a single asterisk indicates p < 0.05, a double asterisk indicates p < 0.01, and a triple asterisk indicates p < 0.001.
RESULTS
Inhibition of Autophagy Does Not Sensitize Cells to Apoptosis or Necrosis Induced by Glucose Deprivation
We aimed to determine whether autophagy protects from apoptotic or necrotic cell death induced by glucose deprivation. For that aim, we subjected different cell lines to glucose deprivation in the presence of two different chemical inhibitors of autophagy. These inhibitors, although not selective, have been widely employed to analyze the role of autophagy in cell death. 3-Methyladenine (3-MA) is a PI3K inhibitor that can inhibit the phosphatidylinositol kinase VPS34 and thus prevent formation of autophagosomes. Chloroquine blocks lysosomal function and thus inhibits macroautophagy, chaperone-mediated autophagy, degradation of membrane proteins by endocytosis, and other lysosome-dependent processes. We subjected cells to glucose deprivation in the presence of 3-MA or chloroquine. We have shown previously that HeLa cells die in part by apoptosis (cell death prevented by caspase inhibitors) and in part by necrosis when subjected to glucose deprivation (17). In these cells, it was reported previously that autophagy is a protective mechanism against complete starvation (3). We observed that 3-MA did not sensitize HeLa cells to glucose deprivation, even though at doses commonly used to inhibit autophagy, 3-MA is toxic for these cells (Fig. 1, A and B).
FIGURE 1.
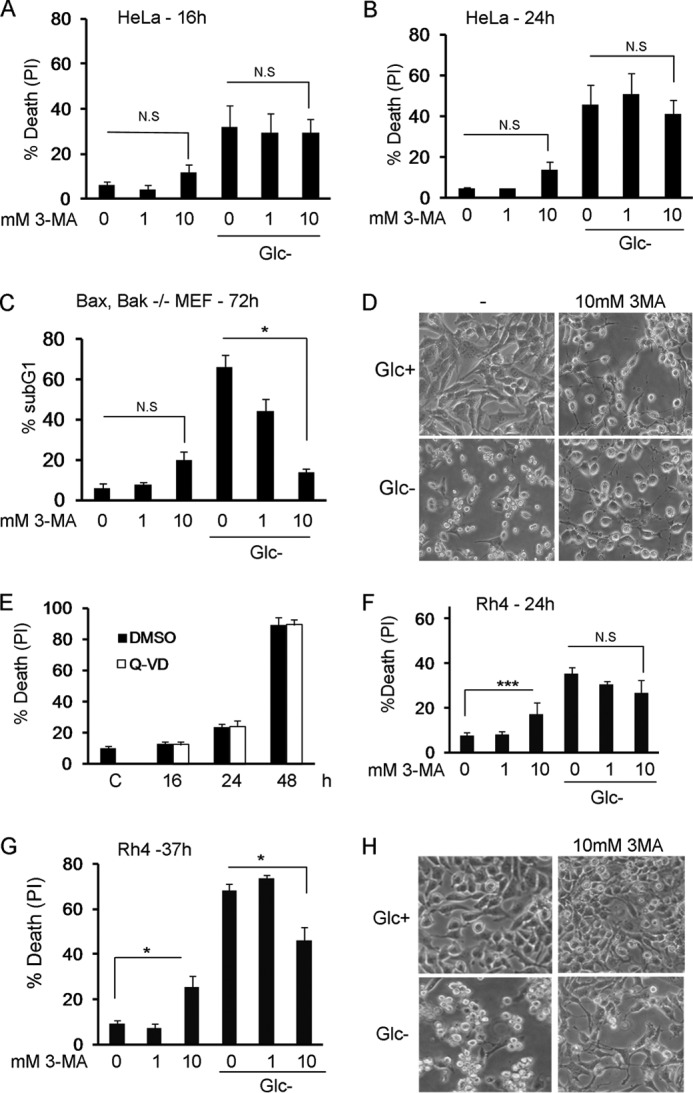
3-Methyladenine inhibits apoptosis or necrosis induced by glucose deprivation. A and B, HeLa cells were deprived of glucose in the absence or presence of 3-MA at indicated concentrations. Cell death was analyzed by propidium iodide incorporation at 16 (A) or 24 h (B). The figure shows the average and S.E. of three experiments. C, Bax/Bak−/− MEFs were subjected to glucose deprivation for the indicated times, in the absence or presence of 3-MA at indicated concentrations. Cells were collected for sub-G1 analysis at the times shown. The figure shows the average and S.E. of three experiments. D, Bax/Bak−/− MEFs were treated with 10 mm 3-MA for 48 h in the presence or absence of glucose. Photographs show 80% of the field and were taken using a 20× objective. Note that 3-MA prevents cell shrinkage induced by glucose deprivation. E, Rh4 cells were grown in glucose-free medium in the presence of caspase inhibitors (Q-VD) or DMSO as vehicle control. Cells were collected at indicated times and subjected to propidium iodide (PI) uptake analysis. Data represent average and S.E. of three experiments. Untreated control cells (labeled C) were cells incubated in DMEM for 16 h. F and G, Rh4 cells were deprived of glucose in the absence or presence of 3-MA at indicated concentrations. Cell death was analyzed by propidium iodide incorporation at 24 h (F) or 37 h (G). The figure shows the average and S.E. of a minimum three experiments. H, Rh4 cells were treated with 10 mm 3-MA for 30 h in the presence or absence of glucose. Photographs showing 25% of the field were taken using a 20× objective. N.S., not significant; DMSO, dimethyl sulfoxide.
We have previously shown that Bax/Bak-deficient MEFs die by caspase-8-mediated apoptosis when deprived of glucose (17). Strikingly, these cells are protected from glucose deprivation when incubated in the presence of 3-MA (Fig. 1, C and D). We analyzed a third cell type, the rhabdomyosarcoma cell line Rh4. These cells die in a necrotic manner in the absence of glucose as cell death cannot be rescued by caspase inhibitors (Fig. 1E). Although 3-MA on its own was also quite toxic to these cells, 3-MA prevented cell death of Rh4 cells by glucose deprivation (Fig. 1, F–H).
Chloroquine is widely employed to inhibit the last steps of autophagy because of its ability to neutralize the lysosomal pH. We treated the same cell lines with chloroquine in combination with starvation of glucose. The effects were in general quite different from those obtained with 3-MA. In Rh4 cells, which were markedly protected from cell death by 3-MA, chloroquine did not reduce cell death (Fig. 2A). Chloroquine mildly sensitized Bax/Bak-deficient MEFs (Fig. 2B) and HeLa cells (Fig. 2, C and D) to glucose deprivation. It should be noted that chloroquine is toxic to every cell line studied in a dose- and time-dependent manner (Fig. 2, C and D) (data not shown), and the sensitization observed is possibly due to an additive effect on signals involved in cell death.
FIGURE 2.
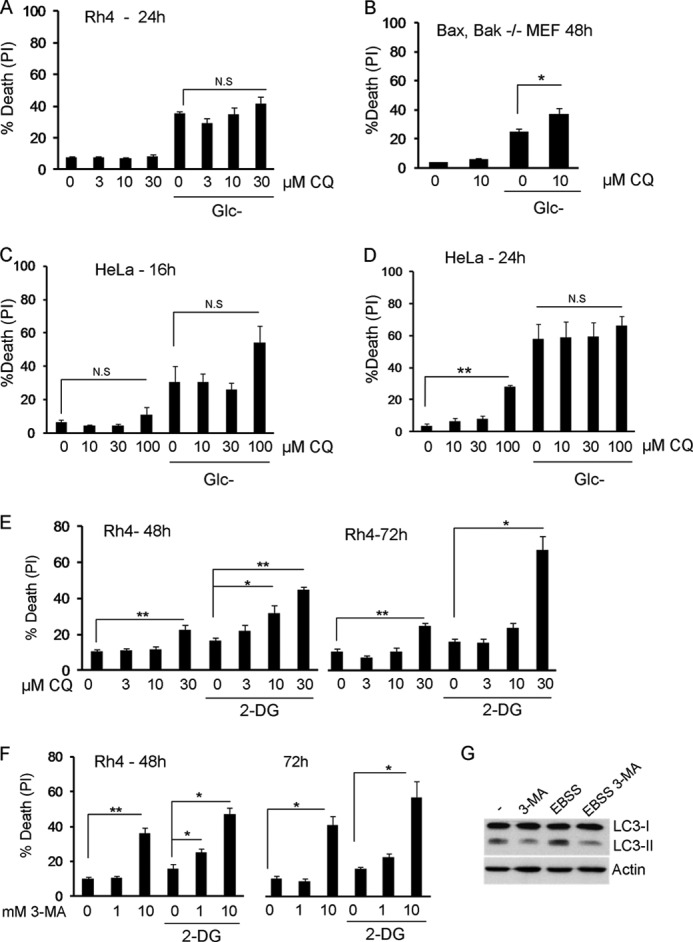
Inhibition of lysosomal function with chloroquine promotes mild sensitization to glucose deprivation. 3-MA and chloroquine sensitize to 2-deoxyglucose. A, Rh4 cells were deprived of glucose in the absence or presence of chloroquine (CQ) at indicated concentrations. Cell death was analyzed by propidium iodide incorporation after 24 h. The figure shows the average and S.E. of minimum four experiments. B, Bax/Bak−/− MEFs were subjected to glucose deprivation for the indicated times, in the absence or presence of 10 μm chloroquine. Cell death was analyzed by propidium iodide incorporation after 48 h. The figure shows the average and S.E. of three experiments. C and D, HeLa cells were deprived of glucose in the absence or presence of chloroquine at indicated concentrations. Cell death was analyzed by propidium iodide incorporation at indicated times. The average and S.E. of minimum three experiments are shown. E, Rh4 cells were treated with 2 mm 2-DG in the absence or presence of chloroquine at the indicated concentrations. Cell death was analyzed by propidium iodide incorporation after 48 and 72 h. The average and S.E. of six experiments are shown. F, Rh4 cells were treated with 2 mm 2-DG in the absence or presence of 3-MA at indicated concentrations. Cell death was analyzed by propidium iodide (PI) incorporation after 48 and 72 h. The figure shows the average and S.E. of a minimum four experiments. G, Rh4 cells were incubated with the protease inhibitors E64d and pepstatin A (20 μm each) for 6 h in regular medium (−) or EBSS, in the presence or absence of 3-MA (10 mm), and blotted for LC3 and actin. N.S., not significant.
Inactivation of Autophagy Sensitizes Cells to 2-Deoxyglucose and Starvation Buffer but Not to Glucose Deprivation
2-DG is a glucose analog that kills tumor cells by apoptosis and has been tested as an anti-tumor drug (12). Its toxic effects are generally attributed to interference with glycolysis and ATP depletion. However, we and others have shown that the effects of 2-deoxyglucose can be attributed to interference with N-glycosylation and endoplasmic reticulum stress rather than ATP depletion (7, 8). 2-DG has been shown to induce autophagy, and toxicity of 2-DG can be enhanced by treatment with 3-MA or with siRNA against Beclin-1 or Atg7 (4, 5). We verified that 3-MA but especially chloroquine sensitized Rh4 cells to 2-deoxyglucose (Fig. 2, E and F), corroborating previous results that suggest that the effects of 2-deoxyglucose and glucose deprivation are different.
Because these chemical inhibitors are quite unspecific (although we verified that they inhibit autophagy in our cells (data not shown and Fig. 2G), we employed siRNA to knock down genes involved in autophagy. We deliberately avoided the use of cells from mice deficient in autophagy genes because it has been shown that these cells up-regulate compensatory protein degradation pathways such as chaperone-mediated autophagy, which may protect from apoptosis and complicate interpretation of results (18). We thus transiently silenced Beclin-1, a protein involved in nucleation of the phagophore. Down-regulation of Beclin-1 reduced basal and 2-DG-induced autophagy (Fig. 3A), and it clearly enhanced sensitivity of Rh4 cells to amino acid/serum starvation (incubation in EBSS) and to treatment with 2-deoxyglucose. However, only a minor sensitization to glucose deprivation was observed (Fig. 3B). We employed another genetic method that would inhibit autophagy even faster than the use of siRNA: we transfected Rh4 cells with a dominant-negative form of ATG4B that hampers the lipidation of LC3 paralogues (19). Transfected cells were highly sensitized to 2-DG and EBSS, and some basal cell death was observed at longer time points. However, these cells were not sensitized to glucose deprivation (Fig. 3C). We also transiently knocked down ATG7 in Bax/Bak-deficient MEFs, which die by apoptosis. The knockdown efficiency was modest (Fig. 3D) but sufficient to down-regulate basal and EBSS-induced autophagy (Fig. 3E). Because these cells do not die with EBSS or 2-deoxyglucose for many days (data not shown), we employed thapsigargin as a control. This drug induces autophagy-dependent cell death in Bax/Bak-deficient MEFs (20). Indeed, knockdown of ATG7 reduced cell death induced by thapsigargin and promoted some cell death on its own at long time points, but it did not alter the response to glucose deprivation (Fig. 3F). We also silenced p62, a molecule involved in delivering cargo to autophagosomes. In the virtual absence of p62 cell death of Bax/Bak-deficient cells proceeded with identical kinetics (Fig. 3G).
Glucose Deprivation Does Not Induce Autophagic Flux
Inhibition of autophagy sensitized cells to 2-deoxyglucose but not to glucose deprivation. However, many studies had reported signs of autophagy in mammalian cells upon glucose deprivation (see Refs. 21–23). This prompted us to analyze whether glucose deprivation actually induced autophagic markers and, in particular, autophagic flux under our conditions of selective glucose deprivation. We generated HeLa and Rh4 cells stably expressing the autophagosomal marker LC3-GFP and starved them of glucose. Noticeable but modest puncta are observed in HeLa cells either growing under normal conditions or subjected to glucose deprivation (Fig. 4A). The fact that glucose deprivation does not induce an obvious translocation of LC3 could suggest that glucose deprivation does not induce autophagy; however, it is also possible that it is inducing autophagy, but autophagosomes are rapidly cleared by fusion with lysosomes. To distinguish between these two possibilities, we employed bafilomycin A1 to block lysosomal degradation of autophagosomal content. Bafilomycin A1 alone induced accumulation of LC3-GFP puncta, which indicates a high level of basal autophagy. However, incubation with bafilomycin A1 in the absence of glucose did not enhance the formation of the puncta (Fig. 4, A and B). Similar results were observed in Rh4 cells (Fig. 4, C and D). As controls, starvation buffers or the mTOR inhibitor rapamycin were used. Bafilomycin A clearly enhanced the formation of puncta triggered by these treatments (Fig. 4, A–D). We employed another method to analyze autophagic flux based on the lysosomal neutralization of GFP but not RFP (red fluorescent protein) fluorescence when these two molecules are fused to LC3. When LC3 is inside autophagolysosomes with acidic pH, only the red fluorescence is observed (16). We verified that incubation in starvation buffer EBSS or treatment with rapamycin induced autophagy in Rh4 cells, but glucose deprivation did not (Fig. 4E).
FIGURE 4.

Glucose deprivation does not induce autophagic flux. A–D, HeLa (A and B) or Rh4 (C and D) stably transfected with GFP-LC3 (HeLa-LC3, Rh4-LC3) were treated with DMEM with glucose (Glc+), glucose deprivation (Glc−), amino acid deprivation (Hank's balanced salt solution/EBSS) or rapamycin (Rapa) for 6 h with or without bafilomycin (Baf) for the last 3 h. The expression pattern of GFP-LC3 was examined under a confocal microscope. Punctate LC3 in cells was measured as described under “Experimental Procedures.” B and D show the mean + S.E. from two (HeLa, B) or four (Rh4, D) independent experiments. E, Rh4 were transfected with mRFP-GFP-LC3 plasmid and treated 24 h post-transfection for 15 h. Representative images from three independent experiments are shown. Arrows indicate red points (autophagolysosomes).
A different method to analyze autophagic flux is to measure the levels of p62 (an LC3-binding protein degraded by autophagy) and of lipidated (autophagosomal, LC3-II) LC3 by Western blot. We analyzed p62 and LC3-II levels after depriving cells of glucose. In HeLa cells, although levels of p62 are not reduced, LC3-II accumulates after treatment, which could indicate activation of autophagy (Fig. 5A). However, LC3-II accumulation may also mean autophagy is reduced compared with basal autophagy. When cells were incubated in regular culture medium in the presence or absence of inhibitors of the last stages of autophagy (the mixture of the protease inhibitors pepstatin A and E64D), LC3-II was accumulated at a much faster rate than in glucose-free medium. Moreover, the combination of glucose deprivation and protease inhibitors promotes similar or even lower accumulation (at long time points) than protease inhibitors alone. This indicates that although basal autophagy is high, glucose deprivation does not induce autophagy, and moreover, it seems to reduce it. In contrast, incubation in EBSS induced autophagy in HeLa (Fig. 5A) and in Bax/Bak-deficient cells (Fig. 5B). Intriguingly, glucose deprivation promotes the accumulation of p62 in these cells, suggesting that either glucose deprivation inhibits autophagic flux, whereas the rate of synthesis of p62 may remain the same, or that glucose regulates p62 levels independently of autophagy. LC3-II accumulated strongly upon depriving cells of glucose. However, the presence of bafilomycin A did not increase the levels of LC3-II. Altogether, these results suggest that both in HeLa and in Bax/Bak-deficient MEFs (that can be kept alone for almost 2 days without apparent toxicity (17)), glucose deprivation inhibits rather than induces autophagy. We then compared the effects of 2-deoxyglucose and glucose deprivation in Rh4 cells (Fig. 5, C and D). Glucose deprivation promoted a slow accumulation of LC3-II. However, bafilomycin A did not further increase this accumulation, suggesting that accumulation is due to inhibition. In contrast, incubation of these cells in EBSS buffer or treatment with 2-deoxyglucose clearly induced autophagy.
FIGURE 5.

Induction of autophagic flux by 2-deoxyglucose and starvation but not glucose deprivation. A, HeLa cells were deprived of glucose or incubated in 95% EBSS+5% culture medium for the indicated times, in the presence or absence of E64d and pepstatin A (EP) (10 μm each). Proteins were resolved by SDS-PAGE and immunoblot. Bands immunoreactive with anti-LC3 antibody and with anti-p62 are shown. Untreated control cells (labeled c) were cells incubated in DMEM for 3 h. The lower panel shows quantification of relative LC3 II levels as described under “Experimental Procedures” (average and S.E. of minimum three independent experiments). B, Bax/Bak−/− MEFs were subjected to glucose deprivation or incubated in 95% EBSS+5% culture medium for the indicated times, in the absence or presence of 20 nm bafilomycin (Baf) for the last 3 h to avoid toxicity. Untreated control cells (labeled as c) were cells incubated in DMEM for 6 h in the presence (B) or absence (C) of bafilomycin for the last 3 h. Bands immunoreactive with anti-LC3 antibody and with anti-p62 are shown. The lower panel shows quantification of relative LC3 II levels as described under “Experimental Procedures” (average and S.E. of three independent experiments). C, Rh4 cells were subjected to glucose deprivation or incubated in 90% EBSS+10% culture DMEM for the indicated times, in the absence or presence of 20 nm bafilomycin for the last 3 h to avoid toxicity. Untreated control cells were cells incubated in DMEM for 3 h in the presence (B) or absence (C) of bafilomycin for the last 3 h. Proteins were resolved by SDS-PAGE and immunoblot. The lower panel shows quantification of relative LC3 II levels as described under “Experimental Procedures.” Results are representative of three independent experiments; two for EBSS. D, Rh4 cells were treated with 2-DG for the indicated times, in the absence or presence of 20 nm bafilomycin for the last 3 h. Untreated control cells were cells incubated in DMEM for 3 h in the presence (B) or absence (C) of bafilomycin for the last 3 h. The lower panel shows quantification of relative LC3 II levels as described under “Experimental Procedures” (three independent experiments).
Glucose Deprivation Engages Starvation Signals but It Inhibits Autophagy
Two possibilities are non-exclusive and compatible with the results described above. Glucose deprivation may not engage the same pro-autophagic signals triggered by amino acid starvation or by 2-DG. Or glucose may be required for completion of autophagy even if starvation signals occur. To examine these possibilities, we first analyzed whether the cell types that we used do not properly inactivate mTOR in response to glucose deprivation due, for instance, to constitutive hyperactivation of the mTOR pathway. We observed that in Rh4 cells (Fig. 6A) and in HeLa and Bax/Bak-deficient MEFs (data not shown), mTOR is inactivated upon glucose deprivation, as measured by S6 and 4EBP1 dephosphorylation. 2-Deoxyglucose, which induces autophagy in Rh4 cells, inhibited mTOR with similar kinetics (Fig. 6A). Inhibition of mTOR is usually considered sufficient to trigger autophagy, and mTOR inhibitors are bona fide autophagy inducers. However, it is possible that, if the signal to inhibit mTOR in the absence of glucose was not sufficiently strong, AMPK activation was also required to induce autophagy by phosphorylating ULK1, Vps34, and Beclin-1 (9, 10, 24). HeLa cells cannot activate AMPK upon energy stress because they lack the kinase LKB1, and we could not consistently detect phospho-AMPK or phosphorylation of its substrate phospho-acetyl-CoA carboxylase in Rh4 cells (data not shown). For this reason, we analyzed AMPK and autophagy activation in a cell line that has been used to study induction of autophagy by glucose deprivation, HEK293 (10). Glucose removal inactivated mTOR, and as reported by Kim et al., it activated AMPK (Fig. 6B). However, autophagic flux was not induced (Fig. 6C). These data together with results described in Fig. 5 regarding accumulation of p62 suggest that although glucose deprivation may engage the right signals to promote autophagy, it cannot proceed.
FIGURE 6.

Glucose deprivation engages starvation signals, but it inhibits autophagy. A, Rh4 cells were treated with glucose-free medium, 2-DG, or metformin (Met) for the indicated times. Proteins were resolved by SDS-PAGE and immunoblot. Phospho-4E-BP1, 4E-BP1, phosphoS6, S6, and actin were detected using secondary infrared antibodies. B, HEK293 cells were incubated in glucose-free medium in the presence or absence of glucose. Proteins were resolved by SDS-PAGE and immunoblot. Phosphorylated and total acetyl-CoA carboxylase (ACC) and S6 proteins, 4E-BP1, and actin were detected using infrared antibodies. C, HEK293 cells were deprived of glucose for the times shown with or without E64d and pepstatin A (EP) at the concentration of 20 μm each, collected, and subjected to Western blot. D, Bax/Bak−/− MEFs were treated with or without glucose (Glc−) or EBSS for the indicated times (expressed in hours), followed by 2 h of treatment with 3-MA where indicated and collected for Western blot. E, Rh4 cells were incubated in glucose-free or glucose-rich medium for 15 h, in the presence or absence of E64d and pepstatin A at 20 μm each, and in the presence or absence of the mTOR inhibitor NVP-BEZ-235 (abbreviated as BEZ) at concentrations shown. Proteins were resolved by SDS-PAGE and immunoblot. Bands immunoreactive with LC3, phospho4E-BP1, 4E-BP1, phosphoS6, S6, and p62 are shown. F, quantification of LC3 II levels of cells treated as in E. Values were normalized to actin and to the control of cells treated in the presence of E64d and pepstatin (Glc+EP). Results show the mean and S.E. of three independent experiments. An asterisk indicates significance > 0.05 when compared with the same treatment in the presence of glucose.
We then performed an experiment to verify inhibition of basal autophagy (Fig. 6D). Bax/Bak-deficient MEFs accumulated LC3-II upon EBSS treatment. If 3-MA was added to block the initial steps of autophagy, LC3-II was cleared because autophagy keeps occurring, but no new LC3-II is produced (Fig. 6D). However, this was not the case with glucose deprivation. Cells accumulated LC3-II, and after addition of 3-MA, levels of LC3-II remained high, indicating that clearance of autophagosomes does not occur.
It is thus possible that glucose deprivation inhibits autophagic flux by not allowing completion of all steps from initiation to lysosomal degradation of autophagolysosomal content and recycling. If this was the case, glucose deprivation should inhibit autophagy induced by other stimuli. We thus incubated cells with an autophagy-inducing compound, the mTOR and Akt inhibitor NVP-BEZ-235 (25), in the absence or presence of glucose. We observed that, although mTOR was inhibited by this compound in both conditions, glucose deprivation inhibited autophagic flux induced by the drug (Fig. 6, E and F). Thus, we concluded that glucose deprivation inhibits, rather than induce autophagy.
To gather more insight about the mechanism, we analyzed ATP levels of cells treated by removing glucose or by addition of 2-deoxyglucose. Results described in Fig. 7A indicate that, surprisingly, glucose deprivation does not trigger the loss of ATP in Rh4, which may be obtaining ATP from glycogen or amino acids under these conditions. In contrast, 2-deoxyglucose promotes an early decrease in ATP levels. However, both treatments promote cell death starting at ∼20–24 h, and both treatments inactivate mTOR with similar kinetics. This could suggest a correlation between a loss of ATP and induction of autophagy. However, we analyzed loss of ATP in other cell lines employed in this study, and glucose deprivation reduced ATP levels at short time points (Fig. 7B), which did not correlate with autophagic flux (Figs. 4A and 5, A and B). We could not observe a significant effect of glucose deprivation on modulation of ATP levels by BEZ-235 or vice versa (Fig. 7C). We also tested the hypothesis that glucose deprivation, due to modulation of energy or metabolite levels, could be impairing lysosomal pH and thus its function. However, measurement of lysosomal pH using Lysosensor indicated that glucose deprivation reduces lysosomal pH (or enlarges the lysosomal compartment) in Bax/Bak-deficient MEFs similar to EBSS (Fig. 7D). Bafilomycin was used as a control of pH neutralization. In Rh4 cells, 2-DG, which induces autophagy, and glucose deprivation, which does not, did not significantly alter lysosomal pH (Fig. 7E).
FIGURE 7.

ATP levels or lysosomal pH do not explain the effects of glucose deprivation. A, Rh4 cells were incubated in glucose-free medium or in the presence of 2-DG for the indicated times. ATP levels were measured as described under “Experimental Procedures.” Values shown are relative to untreated controls for each time point and represent average and S.E. of three (2-DG) or six (Glc-) independent experiments. B, Bax/Bak−/− MEFs and HeLa cells were treated with glucose-free medium in the presence or absence of Q-VD for the indicated times. Error bars represent the average of three (Bax/Bak−/− MEFs) or five (HeLa) independent experiments. ATP levels were normalized to cell numbers in each well. C, Rh4 cells were treated with 100 nm glucose-free medium and BEZ (NVP-BEZ-235) for the indicated times. ATP levels were measured as described under “Experimental Procedures.” Values shown are relative to untreated controls for each time point. Data represent the average and S.E. of three independent experiments. D and E, Bax/Bak−/− MEFs (D) or Rh4 cells (E) were cultured in Glc+, Glc+ bafilomycin (Baf; 20 nm), EBSS, Glc-, or 2-DG (10 mm) for the indicated times. After trypsinization, cells were stained with 2.5 μm Lysosensor (LifeTechnologies) for 10 min at 37 °C. Mean Lysosensor intensity of live cells was analyzed by FACS. Data shown are relative to untreated controls and represent the average and S.E. of three independent experiments.
DISCUSSION
Glucose deprivation is thought to be a macroautophagy-inducing stimulus. We present data here that demonstrates that glucose depletion does not induce autophagy in a variety of cell lines and that it can actually inhibit basal autophagy and autophagic flux induced by a drug. Accumulation of lipidated (autophagosomal) LC3 upon treatment with a stimulus can mean that it induces autophagy but also that it inhibits basal autophagy because LC3-containing autophagosomes would accumulate. For this reason, it is necessary to compare punctate (or lipidated) LC3 in cells treated with and without lysosomal inhibitors or treated with these inhibitors on their own to determine the rate of basal autophagy. We have observed accumulation of lipidated (autophagosomal) LC3 upon glucose deprivation, which has probably led other authors to conclude that this is an autophagy-inducing stimulus similar to other forms of starvation. In some research, glucose deprivation was combined with starvation of other nutrients and growth factors contained in serum, or it was performed under hypoxia (11, 21, 26, 27). It is possible that it was the deprivation of these other nutrients or oxygen that triggered autophagy.
Physiologically, conditions that accompany low blood glucose (possibly, reduction of insulin levels) may induce autophagy in some tissues. Liver autophagy has been shown to contribute to the maintenance of blood glucose and amino acid levels (28). Autophagy in newborn mice is essential for their survival upon weaning, and mice in which mTOR cannot be inactivated show the same phenotype (neonatal cell death) than mice deficient in Atg5 (29, 30). Moreover, these mice can be rescued by providing glucose or gluconeogenic amino acids. Our results are not incompatible with the possibility that autophagy contributes to regulate glucose homeostasis via gluconeogenesis. Autophagy produces amino acids, which could potentially be converted to glucose by gluconeogenic cells. Additionally, autophagy can participate in digestion of lipid droplets and production of free fatty acids that could be used to make ATP (1). So it is possible that under some circumstances, autophagy can contribute to glucose and ATP generation. However, the cause for the induction of autophagy upon fasting remains to be determined: low blood glucose or low amino acids or other hormonal signals that follow hypoglycemia. Our results suggest that glucose is not the nutrient that regulates autophagy and that ATP loss does not correlate with autophagy induction.
We report here that glucose deprivation actually inhibits autophagy, although the mechanism is unclear. Glucose may alter multiple steps of autophagy, which is an ATP-demanding process. It has recently been reported that glucose deprivation does not stimulate production of WIPI2-containing membranes, which suggests that it fails to induce VPS34 activity (31). Experiments shown in Fig. 5 suggest that at long time points, autophagy is inhibited at the earlier steps. However, other experiments indicate that glucose deprivation inhibits the latest steps of autophagy: we observe accumulation of p62 even at short time points, and Fig. 6D indicates that upon treatment with 3-MA, autophagic vesicles are not cleared. Ammonia is produced under conditions of glucose deprivation (23). Because ammonia is a potent inhibitor of lysosomal function, it is possible that this is the reason why glucose deprivation inhibits autophagy. Lampidis and co-workers (32) have recently reported that under hypoxia, glucose deprivation inhibits, rather than induce autophagy, and Knecht and co-workers (33) have reported that glucose promotes autophagy under starvation, in agreement with our data. Moreover, it had been observed that raising glucose concentration enhanced autophagy and clearance of mutant huntingtin (34). In this regard, it should be noted that the buffers commonly employed to mimic starvation and induce autophagy in culture (Hank's balanced salt solution/EBSS) contain glucose.
It is possible that some forms of starvation or drugs commonly used to promote autophagy transduce signals that glucose deprivation does not. In this regard, 2-deoxyglucose has been shown to induce autophagy by a pathway more related to endoplasmic reticulum stress than to ATP depletion because mannose could prevent it but it could not revert ATP loss (5). Classical “starvation” in buffers is achieved by depriving cells simultaneously of growth factors, vitamins, and all amino acids, which may regulate signaling molecules such as reactive oxygen species or activate other signaling pathways besides mTOR inactivation. In this sense, it has been shown that rapamycin requires Ca2+ signals to induce autophagy (35), and complete starvation triggers DNA damage and PARP activation, which are required for autophagy to proceed (36). Alternatively, it is possible that glucose engages an anti-autophagic signal (33), or glucose, acetate, or some other glucose-derived molecule is required for vesicle trafficking or recycling.
Our results indicate that chloroquine, 3-MA, and genetic blockade of autophagy have different effects on cell survival. Possibly, 3-MA blocks class I PI3Ks, which may contribute to the observed effects. Alternatively, chloroquine is likely altering other lysosomal processes such as chaperone-mediated autophagy or endocytosis, which could potentially sensitize cells to 2-deoxyglucose or glucose deprivation. However, it is difficult to conclude that lysosomal blockade sensitizes cells specifically to glucose deprivation because it is toxic by itself, and we only observed some sensitization in two cell lines. However, protection by 3-MA was very reproducible and suggests that inhibitors of early steps of autophagy may be used to treat ischemic diseases as suggested previously (37). Altogether, our data prompt for a reevaluation of the role of autophagy in starvation.
Acknowledgments
We thank Stephen Tait, Doug Green, Chris Dillon, Patricia Boya, Oscar M. Tirado, and members of the Thomas/Kozma/Tauler laboratories for reagents and discussions. Dídac Domínguez, Noelia Barrio, Jin O'Prey, and Robin Macintosh are acknowledged for technical support, and Carmen Casal Moreno is acknowledged for assistance with confocal microscopy.
This work was supported by Fundació Marató TV3 Grant 111630/31 (to C. M.-P. and J. H. M. P.), Secretaria for Universities and Research (SUR) of the ECO of the Government of Catalonia fellowship (to R. I.), and Fondo de Investigaciones Sanitarias of Spain Grant PI10/00104 (to C. M.-P.).
- 2-DG
- 2-deoxyglucose
- 3-MA
- 3-methyladenine
- EBSS
- Earle's Balanced Salt Solution
- MEF
- mouse embryonic fibroblast
- mTOR
- mechanistic target of rapamycin
- PI
- propidium iodide
- EGFP
- enhanced GFP.
REFERENCES
- 1. Singh R., Cuervo A. M. (2011) Autophagy in the cellular energetic balance. Cell Metab. 13, 495–504 [DOI] [PMC free article] [PubMed] [Google Scholar]
- 2. Mizushima N., Yoshimori T., Ohsumi Y. (2011) The role of Atg proteins in autophagosome formation. Annu. Rev. Cell Dev. Biol. 27, 107–132 [DOI] [PubMed] [Google Scholar]
- 3. Boya P., González-Polo R. A., Casares N., Perfettini J. L., Dessen P., Larochette N., Métivier D., Meley D., Souquere S., Yoshimori T., Pierron G., Codogno P., Kroemer G. (2005) Inhibition of macroautophagy triggers apoptosis. Mol. Cell Biol. 25, 1025–1040 [DOI] [PMC free article] [PubMed] [Google Scholar]
- 4. DiPaola R. S., Dvorzhinski D., Thalasila A., Garikapaty V., Doram D., May M., Bray K., Mathew R., Beaudoin B., Karp C., Stein M., Foran D. J., White E. (2008) Therapeutic starvation and autophagy in prostate cancer: A new paradigm for targeting metabolism in cancer therapy. Prostate 68, 1743–1752 [DOI] [PMC free article] [PubMed] [Google Scholar]
- 5. Xi H., Kurtoglu M., Liu H., Wangpaichitr M., You M., Liu X., Savaraj N., Lampidis T. (2011) 2-Deoxy-d-glucose activates autophagy via endoplasmic reticulum stress rather than ATP depletion. Cancer Chemother. Pharmacol. 67, 899–910 [DOI] [PMC free article] [PubMed] [Google Scholar]
- 6. Altman B. J., Jacobs S. R., Mason E. F., Michalek R. D., MacIntyre A. N., Coloff J. L., Ilkayeva O., Jia W., He Y. W., Rathmell J. C. (2011) Autophagy is essential to suppress cell stress and to allow BCR-Abl-mediated leukemogenesis. Oncogene 30, 1855–1867 [DOI] [PMC free article] [PubMed] [Google Scholar]
- 7. Ramírez-Peinado S., Alcázar-Limones F., Lagares-Tena L., El Mjiyad N., Caro-Maldonado A., Tirado O. M., Muñoz-Pinedo C. (2011) 2-deoxyglucose induces noxa-dependent apoptosis in alveolar rhabdomyosarcoma. Cancer Res. 71, 6796–6806 [DOI] [PubMed] [Google Scholar]
- 8. Kurtoglu M., Gao N., Shang J., Maher J. C., Lehrman M. A., Wangpaichitr M., Savaraj N., Lane A. N., Lampidis T. J. (2007) Under normoxia, 2-deoxy-d-glucose elicits cell death in select tumor types not by inhibition of glycolysis but by interfering with N-linked glycosylation. Mol. Cancer Ther. 6, 3049–3058 [DOI] [PubMed] [Google Scholar]
- 9. Egan D. F., Shackelford D. B., Mihaylova M. M., Gelino S., Kohnz R. A., Mair W., Vasquez D. S., Joshi A., Gwinn D. M., Taylor R., Asara J. M., Fitzpatrick J., Dillin A., Viollet B., Kundu M., Hansen M., Shaw R. J. (2011) Phosphorylation of ULK1 (hATG1) by AMP-activated protein kinase connects energy sensing to mitophagy. Science 331, 456–461 [DOI] [PMC free article] [PubMed] [Google Scholar]
- 10. Kim J., Kundu M., Viollet B., Guan K. L. (2011) AMPK and mTOR regulate autophagy through direct phosphorylation of Ulk1. Nat. Cell Biol. 13, 132–141 [DOI] [PMC free article] [PubMed] [Google Scholar]
- 11. Degenhardt K., Mathew R., Beaudoin B., Bray K., Anderson D., Chen G., Mukherjee C., Shi Y., Gélinas C., Fan Y., Nelson D. A., Jin S., White E. (2006) Autophagy promotes tumor cell survival and restricts necrosis, inflammation, and tumorigenesis. Cancer Cell 10, 51–64 [DOI] [PMC free article] [PubMed] [Google Scholar]
- 12. El Mjiyad N., Caro-Maldonado A., Ramírez-Peinado S., Muñoz-Pinedo C. (2011) Sugar-free approaches to cancer cell killing. Oncogene 30, 253–264 [DOI] [PubMed] [Google Scholar]
- 13. Caro-Maldonado A., Munoz-Pinedo C. (2011) Dying for something to eat: how cells respond to starvation. Open Cell Signal J. 3, 42–51 [Google Scholar]
- 14. Wei M. C., Zong W. X., Cheng E. H., Lindsten T., Panoutsakopoulou V., Ross A. J., Roth K. A., MacGregor G. R., Thompson C. B., Korsmeyer S. J. (2001) Proapoptotic BAX and BAK: A Requisite Gateway to Mitochondrial Dysfunction and Death. Science 292, 727–730 [DOI] [PMC free article] [PubMed] [Google Scholar]
- 15. Sanjuan M. A., Dillon C. P., Tait S. W., Moshiach S., Dorsey F., Connell S., Komatsu M., Tanaka K., Cleveland J. L., Withoff S., Green D. R. (2007) Toll-like receptor signalling in macrophages links the autophagy pathway to phagocytosis. Nature 450, 1253–1257 [DOI] [PubMed] [Google Scholar]
- 16. Kimura S., Noda T., Yoshimori T. (2007) Dissection of the autophagosome maturation process by a novel reporter protein, tandem fluorescent-tagged LC3. Autophagy 3, 452–460 [DOI] [PubMed] [Google Scholar]
- 17. Caro-Maldonado A., Tait S. W., Ramírez-Peinado S., Ricci J. E., Fabregat I., Green D. R., Muñoz-Pinedo C. (2010) Glucose deprivation induces an atypical form of apoptosis mediated by caspase-8 in Bax-, Bak-deficient cells. Cell Death Differ. 17, 1335–1344 [DOI] [PubMed] [Google Scholar]
- 18. Wang Y., Singh R., Massey A. C., Kane S. S., Kaushik S., Grant T., Xiang Y., Cuervo A. M., Czaja M. J. (2008) Loss of macroautophagy promotes or prevents fibroblast apoptosis depending on the death stimulus. J. Biol. Chem. 283, 4766–4777 [DOI] [PMC free article] [PubMed] [Google Scholar]
- 19. Fujita N., Hayashi-Nishino M., Fukumoto H., Omori H., Yamamoto A., Noda T., Yoshimori T. (2008) An Atg4B mutant hampers the lipidation of LC3 paralogues and causes defects in autophagosome closure. Mol. Biol. Cell 19, 4651–4659 [DOI] [PMC free article] [PubMed] [Google Scholar]
- 20. Ullman E., Fan Y., Stawowczyk M., Chen H. M., Yue Z., Zong W. X. (2008) Autophagy promotes necrosis in apoptosis-deficient cells in response to ER stress. Cell Death Differ. 15, 422–425 [DOI] [PMC free article] [PubMed] [Google Scholar]
- 21. Matsui Y., Takagi H., Qu X., Abdellatif M., Sakoda H., Asano T., Levine B., Sadoshima J. (2007) Distinct roles of autophagy in the heart during ischemia and reperfusion: roles of AMP-activated protein kinase and beclin 1 in mediating autophagy. Circ. Res. 100, 914–922 [DOI] [PubMed] [Google Scholar]
- 22. Germain M., Nguyen A. P., Le Grand J. N., Arbour N., Vanderluit J. L., Park D. S., Opferman J. T., Slack R. S. (2011) MCL-1 is a stress sensor that regulates autophagy in a developmentally regulated manner. EMBO J. 30, 395–407 [DOI] [PMC free article] [PubMed] [Google Scholar]
- 23. Cheong H., Lindsten T., Wu J., Lu C., Thompson C. B. (2011) Ammonia-induced autophagy is independent of ULK1/ULK2 kinases. Proc. Natl. Acad. Sci. U.S.A. 108, 11121–11126 [DOI] [PMC free article] [PubMed] [Google Scholar]
- 24. Kim J., Kim Y. C., Fang C., Russell R. C., Kim J. H., Fan W., Liu R., Zhong Q., Guan K. L. (2013) Differential regulation of distinct Vps34 complexes by AMPK in nutrient stress and autophagy. Cell 152, 290–303 [DOI] [PMC free article] [PubMed] [Google Scholar]
- 25. Liu T. J., Koul D., LaFortune T., Tiao N., Shen R. J., Maira S. M., Garcia-Echevrria C., Yung W. K. (2009) NVP-BEZ235, a novel dual phosphatidylinositol 3-kinase/mammalian target of rapamycin inhibitor, elicits multifaceted antitumor activities in human gliomas. Mol. Cancer Ther. 8, 2204–2210 [DOI] [PMC free article] [PubMed] [Google Scholar]
- 26. Aki T., Yamaguchi K., Fujimiya T., Mizukami Y. (2003) Phosphoinositide 3-kinase accelerates autophagic cell death during glucose deprivation in the rat cardiomyocyte-derived cell line H9c2. Oncogene 22, 8529–8535 [DOI] [PubMed] [Google Scholar]
- 27. Sato K., Tsuchihara K., Fujii S., Sugiyama M., Goya T., Atomi Y., Ueno T., Ochiai A., Esumi H. (2007) Autophagy is activated in colorectal cancer cells and contributes to the tolerance to nutrient deprivation. Cancer Res. 67, 9677–9684 [DOI] [PubMed] [Google Scholar]
- 28. Ezaki J., Matsumoto N., Takeda-Ezaki M., Komatsu M., Takahashi K., Hiraoka Y., Taka H., Fujimura T., Takehana K., Yoshida M., Iwata J., Tanida I., Furuya N., Zheng D. M., Tada N., Tanaka K., Kominami E., Ueno T. (2011) Liver autophagy contributes to the maintenance of blood glucose and amino acid levels. Autophagy 7, 727–736 [DOI] [PMC free article] [PubMed] [Google Scholar]
- 29. Efeyan A., Zoncu R., Chang S., Gumper I., Snitkin H., Wolfson R. L., Kirak O., Sabatini D. D., Sabatini D. M. (2013) Regulation of mTORC1 by the Rag GTPases is necessary for neonatal autophagy and survival. Nature 493, 679–683 [DOI] [PMC free article] [PubMed] [Google Scholar]
- 30. Kuma A., Hatano M., Matsui M., Yamamoto A., Nakaya H., Yoshimori T., Ohsumi Y., Tokuhisa T., Mizushima N. (2004) The role of autophagy during the early neonatal starvation period. Nature 432, 1032–1036 [DOI] [PubMed] [Google Scholar]
- 31. McAlpine F., Williamson L. E., Tooze S. A., Chan E. Y. (2013) Regulation of nutrient-sensitive autophagy by uncoordinated 51-like kinases 1 and 2. Autophagy 9, 361–373 [DOI] [PMC free article] [PubMed] [Google Scholar]
- 32. Xi H., Barredo J. C., Merchan J. R., Lampidis T. J. (2013) Endoplasmic reticulum stress induced by 2-deoxyglucose but not glucose starvation activates AMPK through CaMKKβ leading to autophagy. Biochem. Pharmacol. 85, 1463–1477 [DOI] [PubMed] [Google Scholar]
- 33. Moruno-Manchón J. F., Pérez-Jiménez E., Knecht E. (2013) Glucose induces autophagy under starvation conditions by a p38 MAPK-dependent pathway. Biochem. J. 449, 497–506 [DOI] [PubMed] [Google Scholar]
- 34. Ravikumar B., Stewart A., Kita H., Kato K., Duden R., Rubinsztein D. C. (2003) Raised intracellular glucose concentrations reduce aggregation and cell death caused by mutant huntingtin exon 1 by decreasing mTOR phosphorylation and inducing autophagy. Hum. Mol. Genet. 12, 985–994 [DOI] [PubMed] [Google Scholar]
- 35. Decuypere J. P., Kindt D., Luyten T., Welkenhuyzen K., Missiaen L., De Smedt H., Bultynck G., Parys J. B. (2013) mTOR-controlled autophagy requires intracellular Ca2+ signaling. PLoS One 8, e61020. [DOI] [PMC free article] [PubMed] [Google Scholar]
- 36. Rodríguez-Vargas J. M., Ruiz-Magaña M. J., Ruiz-Ruiz C., Majuelos-Melguizo J., Peralta-Leal A., Rodríguez M. I., Muñoz-Gámez J. A., de Almodóvar M. R., Siles E., Rivas A. L., Jäättela M., Oliver F. J. (2012) ROS-induced DNA damage and PARP-1 are required for optimal induction of starvation-induced autophagy. Cell Res. 22, 1181–1198 [DOI] [PMC free article] [PubMed] [Google Scholar]
- 37. Puyal J., Vaslin A., Mottier V., Clarke P. G. (2009) Postischemic treatment of neonatal cerebral ischemia should target autophagy. Ann. Neurol. 66, 378–389 [DOI] [PubMed] [Google Scholar]