

Abstract
The purpose of this study was to evaluate the variability of subcutaneous abdominal adipose tissue (AT) dynamics in obese subjects with a wide range of insulin sensitivity (IS) and the correlation between these two metabolic measures. Ten obese (BMI 30–40 kg/m2) nondiabetic subjects with (n = 6) and without (n = 4) the metabolic syndrome were studied following a 12-wk 2H2O labeling period. Subcutaneous abdominal AT biopsies were collected. Deuterium incorporation into triglyceride (TG)-glycerol and TG-palmitate were measured by gas chromatography-mass spectrometry for the calculation of fractional TG synthesis (fTG) and fractional de novo lipogenesis (fDNL). Muscle IS and insulin-mediated nonesterified fatty acid (NEFA) suppression (a measure for adipose IS) indexes were derived from the oral glucose tolerance test (OGTT). The ability of subcutaneous abdominal AT to synthesize lipids varied significantly in obese subjects (fTG range 7–28%, fDNL range 1.1–4.6%) with significantly lower values (>35% reduction) for both parameters in obese with the metabolic syndrome. fTG correlated positively with muscle IS (r = 0.64, P = 0.04) and inversely with NEFA suppression during the OGTT (r = −0.69, P = 0.03). These results demonstrate a large variability in subcutaneous abdominal AT lipid turnover in obesity. Moreover, a reduced capacity for subcutaneous abdominal AT fat storage is associated with muscle and adipose tissue insulin resistance as well as with the metabolic syndrome, thus identifying a form of obesity at heightened risk for type 2 diabetes and cardiovascular disease.
Keywords: adipose tissue, adipocyte metabolism, obesity, lipid metabolism, insulin resistance
obesity is associated with increased risk for the two main chronic diseases affecting morbidity and mortality in our population, type 2 diabetes (T2DM) and cardiovascular disease (9, 19, 31). This increase in risk is largely mediated by metabolic abnormalities including systemic insulin resistance to glucose disposal and associated abnormalities of the metabolic syndrome (16). However, not all obese patients develop metabolic complications (21). “Metabolically healthy” and “metabolically unhealthy” obese have been described in previous studies and are about equally represented in our population (23, 30). Characterization of the mechanisms underlying the metabolic differences between these two groups promises to provide the clinician both with better tools to identify patients at risk and with novel therapeutic strategies.
Fat mass and distribution are thought to contribute to about 50% of the variability in insulin resistance among normoglycemic individuals (1, 17). However, increasing evidence suggests that adipocyte function, such as the ability to store triglyceride (TG) excess, also has a large role in determining systemic insulin resistance (8, 18, 20). A key function of adipose tissue is to buffer excessive caloric intake by storing TG and maintaining lipid and glucose homeostasis. A decreased capacity to store TG in adipose has the potential to increase flux of plasma nonesterified fatty acids (NEFA) to other tissues promoting fat redistribution and ectopic fat deposition leading to defective insulin-mediated glucose disposal in skeletal muscle (5, 22) and the development of the metabolic syndrome.
We, and others, have shown that not just visceral, but also subcutaneous adipose tissue fat mass increase is associated with insulin resistance to glucose disposal (1, 7, 2, 14, 11). Increased adipocyte size without a concomitant increase in number has been shown to occur in subcutaneous abdominal adipose tissue of insulin-resistant subjects even in the absence of obesity (7). Since an increase in adipocyte size has been shown to be associated with adipocyte insulin resistance to glucose uptake (10), it is possible that, during excessive caloric intake, an initial hypertrophy of insulin sensitive adipocytes can be followed by adipocyte insulin resistance, which leads to increased lipolysis and thus decreased TG storage capacity in subcutaneous abdominal adipose tissue. This could play a key role in the pathogenesis of systemic insulin resistance to glucose disposal and metabolic syndrome (28, 29) at any level of total body fat content. If true, this view is consistent with the hypothesis that decreased TG synthesis in subcutaneous abdominal adipose tissue could be a determinant of systemic insulin resistance. Therefore, the main goal of this study was to test the hypothesis that, among obese humans, adipose tissue lipid synthesis is variable and secondarily that this variability correlates with differences in muscle insulin sensitivity. To test these hypotheses we applied the deuterated water (2H2O) labeling technique for the concurrent in vivo measurement of abdominal adipose tissue TG synthesis, contribution of de novo lipogenesis (DNL) to TG synthesis and adipocyte proliferation in nondiabetic, obese subjects.
MATERIALS AND METHODS
Men and women (n = 10) with a stable diet and weight during the previous 6 mo, body mass index between 30 and 40 kg/m2, and a stable dose of medication for more than 90 days were recruited. Exclusion criteria were any evidence of acute illnesses, diabetes mellitus [defined as fasting plasma glucose (FPG) >126 mg/dl], pregnancy or lactation, a history of substance abuse, and the inability to provide informed consent. None of the subjects were taking medication known to affect glucose or lipid metabolism. All studies and procedures were approved by the Institutional Review Board at the University of Texas Medical Branch (UTMB), Galveston, TX, and all participants provided signed consent. Subjects were identified as having the metabolic syndrome by using the ATP III definition [any 3 of 1) elevated waist circumference: men >102 cm and women >88 cm; 2) elevated TG: >1.7 mmol/l; 3) reduced HDL: men <1.03 mmol/l and women <1.29 mmol/l; 4) elevated blood pressure: >130/85 mmHg or use of medication for hypertension; 5) elevated fasting glucose >5.6 mmol/l or use of medication for hyperglycemia] (12).
Body composition assessment.
Subjects underwent body composition and fat distribution assessment including waist and hip measurements as described previously (7), and determination of body fat content using dual-energy X-ray absorptiometry (DXA; GE Lunar DXA, GE Medical Systems Lunar, Madison, WI). Android fat (stored in the midsection of the body, including abdomen, chest, and upper arms) and gynoid fat (stored in the lower part of the body, primarily around the hips and thighs) were determined from DXA scans using GE/DXA encore data processing software.
Adipocyte size.
The adipocyte diameter in histological sections was determined using image analysis of digital photomicrographs. Tissue samples were stored in phosphate-buffered formalin solution with subsequent hematoxylin and eosin processing. Five sections (separated by 70 μm each) were photographed for analysis. The histology sections were viewed at ×10 magnification, and images were obtained with a SPOT digital camera (Diagnostic Instruments, Sterling Heights, MI) and converted into a binary format with Adobe PhotoShop 6.0.1 (Adobe Systems, San Jose, CA) and Image Processing Tool Kit (Reindeer Graphics, Gainesville, FL).
Deuterium labeling.
Subjects received 50 ml of 70% 2H2O (Cambridge Isotopes, Andover, MA) three times daily for 1 wk and 50 ml twice daily for the next 11 wk (total of 12 wk of 2H2O). Compliance was checked by measuring 2H enrichment in weekly saliva samples.
Adipose biopsy and adipocyte isolation.
Subcutaneous abdominal periumbilical adipose tissue biopsy samples were obtained under sterile conditions and local anesthesia with 1% Lidocaine. After a small incision, a biopsy needle (Bard Biopsy Systems, Crawley, UK) was used to obtain tissue samples. A portion of adipose tissue was immediately frozen in liquid nitrogen. Another portion of the tissue was immediately minced in HENKS buffer, a mixture of Hank's balanced buffer [0.4 mM KPO4, 5.37 mM KCl, 0.34 mM NaPO4 (dibasic), 136.89 mM NaCl, 5.55 mM d-glucose] and HEPES (25 mM), containing 10 mg/ml bovine serum albumin, centrifuged briefly to sediment red blood cells. Furthermore, the samples were digested in 5 ml of HENKS buffer with type I collagenase on a shaker at 37°C for 1 h. The digested tissue was then filtered using 250-μm mesh and centrifuged at 1,000 rpm at room temperature for 5 min. The top adipocyte layer was washed once with 3 ml of HENKS buffer and saved for DNA isolation.
Oral glucose tolerance test.
A 75-g oral glucose tolerance test (OGTT) was conducted at the end of the 2H2O labeling period after an overnight fast. Blood samples were collected before (−15 and 0 min) and after (30, 60, 90, 120, 150, and 180 min) the glucose ingestion.
Sample preparation and analyses.
Blood glucose concentration was measured using an enzymatic glucose analyzer (YSI 2300 STAT PLUS Glucose & l-Lactate Analyzer). Plasma insulin concentrations were measured using ELISA kits (Mercodia, Winstom-Salem, NC). Plasma lipid concentrations were measured at the Clinical Pathology Laboratory at UTMB.
Plasma free fatty acids (FFA) were extracted using heptane-propanol extraction buffer, separated using thin-layer chromatography (Partisil LK5D, Silica Gel 150 Å; Schleicher & Schuell, Maidstone, UK), and assayed by gas chromatography with flame ionization detection (GC-FID, model 6890; Agilent, Santa Clara, CA) using an internal standard (32).
Adipose tissue lipids were extracted with chloroform-methanol (2:1) Folch extraction; and TG were isolated via thin-layer chromatography. Adipose TG was incubated with 3 N methanol-HCl. FA methyl esters were separated from glycerol for GC-MS analysis. The fraction containing the glycerol was further derivatized to the glycerol triacetate derivative for GC-MS analysis (27).
DNA isolation and analysis.
DNA from adipocytes was isolated using a Qiagen DNEasy kit (Qiagen, Valencia, CA) hydrolyzed and derivatized to the PFTA (perfluorotriacetyl) derivative for enrichment analysis by GC-MS (6).
GC-MS analyses.
TG-glycerol isotopic enrichments were determined by GC-MS (5971 and 5973 models; Hewlett-Packard, Palo Alto, CA) of the glycerol-triacetate derivative using a DB-225 fused silica column in methane chemical ionization mode monitoring mass-to-charge ratios (m/z) 159, 160, and 161 for M0, M1, and M2, as previously described (27). Palmitate methyl ester enrichments were determined by GC-MS using a DB-17ms column with helium as carrier gas and electron ionization mode monitoring m/z 270, 271, and 272 for M0, M1, and M2, as previously described (31). Analysis of derivatized deoxyribose (dR) was performed on a GC-MS using a DB-17ms type column with helium as carrier and methane as reagent gas and negative chemical ionization mode monitoring m/z 435 and 436 for M0 and M1, as previously described (6).
Measurement of 2H2O enrichments in body water.
Enrichment of 2H2O in body water was done from saliva samples using one of two methods. In the first method, samples were analyzed by GC-MS as previously described, using the tetrabromomethane method (27). The majority of samples were analyzed using a wavelength-scanned cavity ring down spectrometer (Picarro L1102-I, Picarro) after dilution and distillation as previously described (24). The integrated (AUC) exposure to heavy water for each subject was calculated as the area under the water enrichment time course for individual water enrichment measurements using the trapezoid method.
Markers of muscle and adipose tissue insulin sensitivity.
The index of muscle insulin sensitivity (Muscle-ISI) was calculated using a model developed by Abdul-Ghani et al. (3), based on the OGTT. The OGTT-derived Muscle-ISI = dG/dt × I−1, where dG/dt− is the rate of decline in plasma glucose concentration and is calculated as the slope of the least square fit to the decline in plasma glucose concentration from peak to nadir (60–180 min), and I represents the mean plasma insulin concentration during OGTT (60–180 min). Plasma NEFA area under the curve (AUCNEFA) during the hyperinsulinemic phase of the OGTT (30–120 min) was calculated using the trapezoid formula as a measure for adipose tissue insulin sensitivity.
Calculations for TG-glycerol synthesis from 2H2O.
TG newly synthesized during the 2H2O administration is calculated as:
where f is the fraction (%) of newly synthesized TG molecules present, EM1 is the excess mass isotopomer abundance for M1-glycerol, and A1∞ is the asymptotic mass isotopomer M1 abundance of a fully labeled glycerol. The A1∞ was calculated using the body water deuterium enrichment, assuming that the number of exchangeable C-H bonds in glycerol during the deuterium labeling is 4 (27). The fractional replacement rate of TG k = −ln(1 − f)/t, where t is the time of labeling in days. To the extent that TG synthesis may have begun to plateau, this will represent a minimum estimate. The absolute TG synthesized during the labeling period was calculated from fractional TG synthesis multiplied by the total body adipose TG size and by the truncal adipose TG size, both determined by DXA and expressed in kilograms of absolute TG synthesized. The absolute retained TG synthesis was calculated normalizing the absolute TG synthesized (mg) by total body weight (kg) and expressed per minute of labeling (min). This calculation assumes that TG in the subcutaneous adipose tissue depot reflects the whole body TG kinetics, which is likely an oversimplification but supported by the high correlation between the absolute TG synthesis calculated using the total body TG and using the truncal TG (see results).
Calculations for DNL.
Fractional DNL (fDNL) was calculated from body water and TG-palmitate deuterium enrichment using precursor-product relationships as previously described and assuming that the number of exchangeable hydrogens (n) is 22 (25).
Calculations for DNA synthesis.
The fraction of new cells made during the labeling period was based on the incorporation of 2H from 2H2O into the dR moiety of purine deoxyribonucleosides in newly synthesized DNA, as described previously using 2H body water enrichment to calculate expected enrichment for 100% labeled cells (6).
Statistical analyses and data presentations.
Data are presented as means ± SD unless otherwise noted. Relationship analyses were performed using a linear regression model. The nonparametric data was log transformed for skewed distribution prior to use in the analysis. Student's t-test for independent variables was used to compare subgroups with and without the metabolic syndrome.
RESULTS
Subject characteristics.
The study included six male and fouyr female obese volunteers without diabetes. There were six Caucasians, three African Americans, and one white Hispanic. Body weight was stable for all participants over the course of the 12-wk study period (Fig. 1). The study subjects had a wide range of insulin sensitivity (Muscle-ISI range from 0.019 to 0.142). As shown in Table 1, when we divided subjects into two groups based on the presence or absence of the metabolic syndrome as defined by NCEP ATP III (12), there was a significant overlap for the various metabolic parameters studied, and the only significant difference was in the lower HDL-cholesterol for the obese with the metabolic syndrome compared with the obese without the metabolic syndrome. Although there were no differences in average age, the MS group included two subjects age 76 and one age 75 yr. All the obese without the metabolic syndrome had age of <65 yr.
Fig. 1.

Body weight in metabolic syndrome (MetS, n = 6) and nonmetabolic syndrome (NMS, n = 4) subjects over the 12-wk course of the study. Data are means ± SD.
Table 1.
Baseline characteristics
| Variables | All Subjects | No Metabolic Syndrome | Metabolic Syndrome | P Value |
|---|---|---|---|---|
| n | 10 | 4 | 6 | |
| Age, yr | 46 ± 22 | 36 ± 7 | 52 ± 26 | 0.27 |
| Sex (M/F) | 6/4 | 3/1 | 3/3 | 0.57 |
| BMI, kg/m2 | 34 ± 2 | 33 ± 1 | 34 ± 3 | 0.72 |
| Waist, cm | 106 ± 14 | 102 ± 15 | 108 ± 14 | 0.54 |
| Hip, cm | 113 ± 11 | 114 ± 14 | 112 ± 10 | 0.81 |
| Body fat content, kg | 38 ± 10 | 36 ± 10 | 39 ± 11 | 0.60 |
| Android fat mass, kg | 4.0 ± 1.5 | 3.8 ± 1.8 | 4.1 ± 1.5 | 0.70 |
| Gynoid fat mass, kg | 6.6 ± 1.9 | 6.5 ± 2.0 | 6.6 ± 2.1 | 0.95 |
| Adipocyte diameter, μm | 95.5 ± 6.2 | 94.0 ± 7.1 | 96.4 ± 6.2 | 0.63 |
| SBP, mmHg | 136 ± 14 | 132 ± 9 | 139 ± 17 | 0.52 |
| DBP, mmHg | 75 ± 10 | 76 ± 14 | 74 ± 8 | 0.80 |
| Triglyceride, mmol/l | 1.38 ± 0.90 | 0.90 ± 0.19 | 1.70 ± 1.06 | 0.18 |
| HDL, mmol/l | 1.2 ± 0.3 | 1.6 ± 0.2 | 1.0 ± 0.2 | < 0.05 |
| LDL, mmol/l | 2.8 ± 0.6 | 2.9 ± 0.03 | 2.7 ± 0.8 | 0.59 |
| VLDL, mmol/l | 0.65 ± 0.41 | 0.41 ± 0.10 | 0.78 ± 0.49 | 0.19 |
| Plasma NEFA, nmol/ml | 190 ± 72 | 154 ± 47 | 214 ± 79 | 0.22 |
| AUCNEFA 30–120, nmol/ml·min | 6,074 ± 1,428 | 5,395 ± 1,878 | 6,526 ± 970 | 0.24 |
| Fasting glucose, mmol/l | 5.5 ± 0.5 | 4.8 ± 0.6 | 5.2 ± 0.4 | 0.28 |
| Glucose, 2-h OGTT, mmol/l | 7.5 ± 1.9 | 6.2 ± 1.7 | 8.4 ± 1.6 | 0.06 |
| Fasting insulin, pmol/l | 52.5 ± 34.0 | 39.0 ± 13.8 | 61.4 ± 13.8 | 0.33 |
| Muscle-ISI | 0.082 ± 0.04 | 0.11 ± 0.03 | 0.06 ± 0.04 | 0.10 |
| Plasma adiponectin, μg/ml | 4.2 ± 2.5 | 4.9 ± 3.2 | 3.8 ± 2.0 | 0.54 |
Data are presented as means ± SD. SBP, systolic blood pressure; DBP, diastolic blood pressure; Muscle-ISI, muscle insulin sensitivity. P values were computed using Student's t-test for comparison of no metabolic syndrome and metabolic syndrome subgroups. Difference in sex composition of no metabolic syndrome and metabolic syndrome subgroups was analyzed using Fisher's exact test.
Adipose TG kinetics.
The 2H2O body water enrichment was stable over the course of the 12-wk labeling protocol for individual subjects, with an average enrichment across subjects of 1.71 ± 0.56%. Interindividual variability was observed for adipose TG synthesis and contribution of DNL to adipose TG. Fractional adipose TG synthesis (fTG) ranged from 6.6 to 28.7%, with a mean of 18.0 ± 7.3%. The replacement rate (k) and TG half-life were 0.236 ± 0.099%/day (range: 0.078–0.387%/day) and 372 ± 214 days (range: 174–893 days), respectively. The total amount of adipose TG synthesized and retained over 12 wk varied widely (absolute synthesis) and was 7 ± 3.7 kg (range 2.1–11.4 kg) or 82 ± 43 g/day (range 24–133 g/day). This large interindividual variation was also seen for the absolute retained TG synthesis rate of 0.57 ± 0.26 mg TG·kg body wt−1·min−1 ranging from 0.23 to 0.92 mg TG·kg body wt−1·min−1. The contribution of DNL to adipose TG ranged from 1.1 to 4.6% with a mean value of 3.1 ± 1.1%; and by dividing fDNL by fTG one can determine the fraction of newly synthesized TG that came from DNL, which was 19.5 ± 10.4% (range 7–45%).
Adipocyte proliferation.
Adipocytes were freshly isolated from tissue from all subjects. Data are available for only five subjects. Although very preliminary, the results on adipocyte proliferation showed that 23 ± 2% of adipocytes were newly synthesized during the 12-wk labeling period (range 7–24%).
Adipose tissue kinetics in the metabolic syndrome.
Abdominal adipose tissue kinetics were compared in those subjects in our obese cohort with (n = 6) and without (n = 4) the metabolic syndrome. Fractional adipose TG synthesis, contribution of DNL to adipose TG, and adipocyte proliferation were significantly reduced in obese subjects with the metabolic syndrome (Fig. 2). Since three subjects in the metabolic syndrome group had age above 65 yr, it is possible that age contributed to the observed differences. However, when the three subjects were excluded from analysis, the trend remained the same (fTG = 23.4 ± 9.3% in obese without the metabolic syndrome and 15.5 ± 8.0% in the obese with the metabolic syndrome). The P value increased to 0.15, likely as the results of insufficient power. Given the small number of elderly, the role of age on fTG variability remains undetermined. Absolute TG synthesis rate was also lower in the metabolic syndrome group (0.49 ± 0.25 vs. 0.68 ± 0.27 mg TG·kg body wt−1·min−1); however, this difference was not statistically significant.
Fig. 2.

Comparison of abdominal adipose tissue kinetics in obese with MetS (n = 6) and NMS (n = 4). A: fractional triglyceride (TG) synthesis (fTG, %). B: fractional de novo lipogenesis (fDNL, %). C: adipocyte proliferation (fraction new cells, %). Data are presented as means ± SD and compared using Student's t-test, 2-tail, unpaired.
Relationship between adipose tissue kinetics and other measures.
To understand the physiological implications of the intersubject variability in adipose kinetics, we correlated adipose TG synthesis, adipose DNL, and adipocyte proliferation with parameters of insulin sensitivity and body composition. Fractional adipose TG synthesis correlated with Muscle-ISI (r = 0.64, p = 0.04; Fig. 3A). This correlation improved after statistical adjustment for total body fat content (r = 0.72, P = 0.028), a known contributor to muscle insulin resistance, even for overtly obese subjects. Thus, fractional TG synthesis in subcutaneous adipose tissue was lower in the more insulin-resistant obese and explained about 41% of the variability of muscle insulin resistance in this cohort, as determined by regression analysis. DNL did not correlate with Muscle-ISI; however, it tended to correlate positively with adipose TG synthesis (r = 0.58, P =0.076), suggesting that there may be an association between the DNL and TG synthesis in subcutaneous abdominal adipose tissue (Fig. 3B).
Fig. 3.

Open and closed circles represent data from obese without and with the metabolic syndrome, respectively. Correlation analysis was performed using the linear regression model. A: greater insulin sensitivity (Muscle-ISI) correlates with higher fTG (%); Muscle-ISI is an OGTT-derived index of peripheral (or muscle) insulin resistance (27) and was log transformed for the skewed distribution. Increasing subcutaneous abdominal adipocyte TG synthesis (fTG, %) tended to be associated with increasing DNL (fDNL, %; B), and was significantly associated with lower plasma NEFA levels (C) during the hyperinsulinemic phase of the OGTT (AUCNEFA; better insulin-mediated NEFA suppression). D: adipocyte proliferation (fraction new cells, %) was positively correlated with fTG (%) in subcutaneous abdominal adipose tissue. E: trend was observed between increasing adipocyte proliferation (fraction new cells, %) and decreasing plasma NEFA during peak hyperinsulinemia (better adipocyte insulin sensitivity).
Plasma insulin concentrations were highest from 30 to 120 min post-OGTT (Fig. 4). Fractional TG synthesis correlated inversely with plasma NEFA concentrations during this hyperinsulinemic portion of the OGTT (Fig. 3C), suggesting a positive association between adipose TG synthesis and adipose insulin sensitivity.
Fig. 4.

Plasma insulin concentrations during standard OGTT are reported at each time point from 75-g glucose ingestion. Shaded area represents the hyperinsulinemic phase of the OGTT. Based on this information, the interval 30–120 min was used to calculate the area under the curve for plasma NEFA (AUCNEFA) as a measure of insulin-mediated NEFA suppression.
Adipocyte proliferation (% fraction new cells) tended to correlate positively with increased TG synthesis (fTG) (r = 0.87, P = 0.05; Fig. 3D), and there was a trend toward an inverse correlation between adipocyte proliferation and AUCNEFA during hyperinsulinemia (r = −0.59, NS; Fig. 3E), suggesting that lower adipocyte proliferation is a feature of obese subjects with reduced adipose insulin sensitivity and TG synthesis. There was no correlation between fTG and adipocyte diameter in subcutaneous abdominal adipose tissue.
Fractional and absolute TG synthesis did not correlate with either total body fat or waist circumference but did positively correlate with hip circumference (fractional TG synthesis: r = 0.64, P = 0.04; absolute TG synthesis: r = 0.79, P = 0.007) (Fig. 5, A and B). Absolute TG synthesis also correlated significantly with gynoid (r = 0.74, P = 0.013; Fig. 5C) but not android fat mass, as determined by DXA. Of note, the absolute TG synthesis, calculated using truncal fat mass and total body fat mass, were highly correlated (Fig. 6).
Fig. 5.
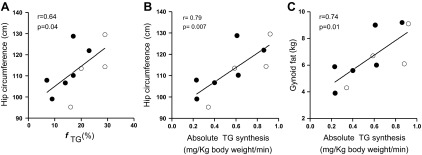
Open and closed circles represent data from obese without and with the metabolic syndrome, respectively. A: fTG (%) in subcutaneous abdominal adipose tissue was positively correlated with hip circumference. Absolute TG synthesis was also positively correlated with hip circumference (B) and with gynoid fat mass (C) as determined by DXA.
Fig. 6.

Linear correlation between absolute TG retention calculated using total body fat content and absolute TG retention calculated using abdominal fat content. DXA was used for measurements of body fat content in both areas.
DISCUSSION
TG synthesis, as measured by the 2H20 labeling technique, represents newly synthesized TG made from plasma NEFA (with an original source of diet, DNL, or lipolysis), FA newly synthesized in the adipose, or from reesterification of fatty acids within the adipocyte recently generated via lipolysis. Thus, it can be thought of as a marker of the capacity of the adipose tissue to both take up circulating FA and retain within the adipose FA generated via lipolysis or DNL. This method has high sensitivity and shows that during the 12 wk of the study 18% of TG was newly synthesized in subcutaneous abdominal adipose tissue of obese individuals, with an average fractional replacement rate of 0.23%/day and half-life (t1/2) of 372 days. Using this method, Strawford et al. (25) found a replacement rate almost twice as fast (0.42%/day; t1/2 154 days) in subcutaneous flank adipose in lean individuals. Thus, our data may suggest a lower adipose TG synthesis rate in obese compared with lean individuals, supporting the theory that obesity is associated with lower factional turnover of adipose lipids. However, given that flank and abdominal adipose are known to have differences (15), this could also account for our findings. Arner et al. (4), using TG labeling from endogenous 14C exposure, found an even slower TG turnover rate in obese individuals of 0.1%/day and t1/2 ≈690 days (derived from a mean lipid age of 2 yr).
While variation due to methodological differences and patient populations may exist, these quite disparate adipose turnover rates across studies are also suggestive of significant interindividual variation that has important physiological implications. Analysis of individual data within our study supports this hypothesis. We found that TG synthesis in subcutaneous abdominal adipose tissue varied significantly among obese individuals. There was a fourfold variation in fractional TG synthesis for the subcutaneous abdominal depot (6.6–28.7%). There was also significant variation in absolute TG synthesized (range 2.1–11.4 kg) and in the absolute TG synthesis rate (range 0.230–0.920 mg TG·kg body wt−1·min−1), suggesting that interindividual differences in adipose tissue kinetics may be an important factor in determining different metabolic phenotypes regardless of body weight. Not all obese individuals develop insulin resistance and the metabolic syndrome (21, 23), and we hypothesize that the interindividual variability in fractional TG synthesis observed in our study could help explain this variability in insulin resistance seen among the obese. Using the OGTT-based insulin sensitivity index of Abdul-Ghani et al. (3), we found that subcutaneous abdominal adipose tissue fractional TG synthesis and Muscle-ISI were positively correlated, with fractional TG synthesis explaining 41% of the variability in peripheral insulin resistance in our obese cohort. Interestingly, we also found that fractional DNL was increased with increased adipose TG synthesis. It is not possible, however, to distinguish between increased adipose tissue DNL, increased hepatic DNL, or increased delivery FA from hepatic DNL as the cause of the observed increase in fractional DNL. These findings of altered TG turnover in obese subjects with reduced systemic insulin-mediated glucose disposal are consistent with the view of decreased subcutaneous abdominal adipocyte capacity to store FA in patients with insulin resistance (13, 18).
The ability of adipose to store excessive caloric intake via deposition of TG in adipocytes has been proposed to be a protective mechanism against detrimental alterations in systemic FA metabolism and to the development of insulin resistance to glucose disposal (20, 8, 13, 28, 29). In the presence of excessive caloric intake, increased delivery of FA to the adipocytes should be met by an increase in TG synthesis and concomitant insulin-mediated suppression of lipolysis resulting in increased adipose TG storage and obesity without metabolic complications. The antilipolytic action of insulin can be evaluated by measuring plasma NEFA suppression during hyperinsulinemia. We found that lower NEFA during peak hyperinsulinemia (better suppression) was correlated with higher subcutaneous adipose tissue fractional TG synthesis, suggesting that improved adipocyte insulin sensitivity (better antilipolytic action) may be associated with the ability of adipose tissue to synthesize TG. If this is true, this scenario may predict normal adipocyte sensitivity to insulin, which in turn may favor the development of adipocyte hypertrophy and an associated tendency to weight gain. Consistent with this hypothesis, McGuaid et al. (18) reported that an enlargement in adipose tissue mass is accompanied by downregulation of NEFA delivery into plasma in the presence of stable plasma FFA concentrations. Progressive increases in adipocyte hypertrophy may then lead to development of adipocyte insulin resistance with ineffective insulin-mediated TG synthesis and suppression of lipolysis. If new insulin-sensitive adipocytes are recruited, TG storage needs may be met. However, if there is inadequate recruitment of new insulin-sensitive adipocytes, there would be an insufficient capacity for adipocyte TG storage, consistent with our preliminary findings of an association between new adipocytes and increased TG synthesis (Fig. 3D). Without new adipocytes, TG would be diverted to other tissues such as muscle and liver, promoting the development of insulin resistance and the metabolic syndrome.
According to this view, obesity associated with decreased fractional TG synthesis would be accompanied by a “metabolically unhealthy” phenotype. In our cohort of nondiabetic obese subjects, those with the metabolic syndrome (“metabolically unhealthy”) had significantly lower subcutaneous abdominal fractional TG synthesis and fractional DNL, supporting our hypothesis that less metabolically active (“quiescent”) subcutaneous abdominal adipose tissue is associated with “metabolically unhealthy” conditions independent of overall body fat content.
Interestingly, we found a correlation between fractional TG synthesis and hip circumference and gynoid fat distribution (Fig. 5), but not with waist circumference, despite measuring TG synthesis in abdominal (waist) adipose. There are several possible explanations for this apparent paradox. Intra-abdominal (visceral) fat, which is a large contributor to abdominal circumference, could have kinetics distinct from subcutaneous tissue; thus, our TG synthesis measure may be a better marker of subcutaneous tissue than abdominal adipose per se, hence correlating better with hip circumference. Another possibility is that, in the presence of stable body fat content, increased subcutaneous abdominal TG turnover with normal adipocyte insulin sensitivity is associated with redistribution of fat toward peripheral subcutaneous adipose tissue and an increase in hip circumference. Thus, obese subjects with increased subcutaneous abdominal lipid turnover would have a more gynoid fat distribution, normal insulin sensitivity, and the absence of the metabolic syndrome. An important caveat is that these data are from a cross-sectional study in weight-stable individuals. Adipose accumulation is a non-steady-state condition; thus, confirmation of these results awaits longitudinal studies during dynamic changes in body fat content.
A longitudinal study recently published by Tchoukalova et al. (26) shows a larger increase in adipocyte size of the subcutaneous abdominal adipose tissue with less fat gain in the lower body. Although we found similar subcutaneous adipocyte size in the obese with and without the metabolic syndrome, and no correlation between adipocyte size and fTG, our findings do not exclude the possibility of an enrichment (higher percentage) with maturing, insulin-sensitive adipocytes in the subcutaneous abdominal adipose tissue of obese without the metabolic syndrome, a topic to be specifically addressed in future studies.
Limitations of this study include the relatively small sample size and the use of the OGTT-derived measures of insulin resistance rather than the “gold-standard” hyperinsulinemic-euglycemic clamp. The Muscle-ISI index to glucose disposal has, however, been shown to be highly correlated to IR measures obtained using the hyperinsulinemic-euglycemic clamp method (3). In addition, the adipocyte proliferation data represent a very small sample size, and, given the relatively high proliferation rate compared with some (24) but not other (25) studies, these data may have been influenced by contamination from nonadipocyte cell types. For the other measurements, although the sample size was relatively small, we nonetheless were able to find significant correlations and differences between the metabolic syndrome and nonmetabolic syndrome groups, thus establishing novel data to guide future, larger studies.
In conclusion, our study is the first to report the relationship between in vivo measurements of adipose tissue function and insulin sensitivity in obese humans. We found a large variability in adipose tissue TG kinetics in obesity with lower TG synthesis, de novo lipogenesis, and adipocyte proliferation in the presence of reduced insulin sensitivity and the metabolic syndrome. These initial data suggest that more “quiescent” subcutaneous abdominal adipose tissue in obesity may contribute to susceptibility to type 2 diabetes and cardiovascular disease and allow the generation of new hypotheses regarding the role of subcutaneous abdominal adipose function on body fat distribution and ectopic fat deposition that merit further study.
GRANTS
This work was supported in part by National Institutes of Health Grant R01 DK-072158 from National Institute of Diabetes and Digestive and Kidney Diseases and by CTSA-NIH 1UL1 RR-029876.
DISCLOSURES
No conflicts of interest, financial or otherwise, are declared by the author(s).
AUTHOR CONTRIBUTIONS
Author contributions: D.T., C.B., E.J.M., and N.A. analyzed data; D.T. drafted manuscript; M.C., E.J.M., and N.A. conception and design of research; M.C., E.J.M., and N.A. interpreted results of experiments; M.C., C.B., E.J.M., and N.A. edited and revised manuscript; M.C., E.J.M., and N.A. approved final version of manuscript; T.B., M.S., and N.A. performed experiments; N.A. prepared figures.
ACKNOWLEDGMENTS
We acknowledge the contribution of Geetika Saraf (Division of Endocrinology at UTMB) for technical support and patient recruitment and E. Sbrana, PhD for performing cell sizing analysis. We acknowledge the Institute for Translational Sciences (ITS), key resources of the Clinical Research Center (CRC), Biostatistics, Epidemiology and Research Design (BERD), and Department of Pathology at the University of Texas Medical Branch at Galveston, for support in conduction of this study.
REFERENCES
- 1.Abate N, Garg A, Peshock RM, Stray-Gundersen J, Grundy SM. Relationships of generalized and regional adiposity to insulin sensitivity in men. J Clin Invest 96: 88–98, 1995 [DOI] [PMC free article] [PubMed] [Google Scholar]
- 2.Abate N, Garg A, Peshock RM, Stray-Gundersen J, Adams-Huet B, Grundy SM. Relationship of generalized and regional adiposity to insulin sensitivity in men with NIDDM. Diabetes 45: 1684–1693, 1996 [DOI] [PubMed] [Google Scholar]
- 3.Abdul-Ghani M, Matsuda M, Balsa B, DeFronzo RA. Muscle and liver insulin resistance indexes derived from the oral glucose tolerance test. Diabetes Care 30: 89–94, 2007 [DOI] [PubMed] [Google Scholar]
- 4.Arner P, Bernard S, Salehpour M, Possnett G, Liebi J, Steier P, Buchholz BA, Eriksson M, Arner E, Hauner H, Skurk T, Ryden M, Frayn KN, Spalding KL. Dynamics of human adipose lipid turnover in health and metabolic disease. Nature 478: 100–103, 2011 [DOI] [PMC free article] [PubMed] [Google Scholar]
- 5.Boden G, Chen X, Ruiz J, White JV, Rossetti L. Mechanisms of fatty acid-induced inhibition of glucose uptake. J Clin Invest 93: 2438–2446, 1994 [DOI] [PMC free article] [PubMed] [Google Scholar]
- 6.Busch R, Neese RA, Awada M, Hayes GM, Hellerstein MK. Measurement of cell proliferation by heavy water labeling. Nat Protocols 2: 3045–3057, 2007 [DOI] [PubMed] [Google Scholar]
- 7.Chandalia M, Lin P, Seenivasan T, Livingston EH, Snell PG, Grundy SM, Abate N. Insulin resistance and body fat distribution in South Asian men compared to Caucasian men. PLoS One 2: e812, 2007 [DOI] [PMC free article] [PubMed] [Google Scholar]
- 8.Danforth E., Jr Failure of adipocyte differentiation causes type II diabetes mellitus? Nat Genet 26: 13, 2000 [DOI] [PubMed] [Google Scholar]
- 9.Fox CS, Pencina MJ, Meigs JB, Vasan RS, Levitzky YS, D'Agostino RB., Sr Trends in the incidence of type 2 diabetes mellitus from the 1970s to the 1990s: the Flamingham Heart Study. Circulation 113: 2914–2918, 2006 [DOI] [PubMed] [Google Scholar]
- 10.Franck N, Stenkula KG, Ost A, Lindstrom T, Stralfors P, Nystrom FH. Insulin-induced GLUT4 translocation to the plasma membrane is blunted in large compared with small primary fat cells isolated from the same individual. Diabetologia 50: 1716–1722, 2007 [DOI] [PubMed] [Google Scholar]
- 11.Goodpaster BH, Thaete FL, Simoneau JA, Kelley DE. Subcutaneous abdominal fat and thigh muscle composition predict insulin sensitivity independently of visceral fat. Diabetes 46: 1579–1585, 1997 [DOI] [PubMed] [Google Scholar]
- 12.Grundy SM, Brewer HB, Cleeman JI, Kahn RA, American Heart Association, National Heart, Lung, and Blood Institute; American Diabetes Association Definition of metabolic syndrome: report of the National Heart, Lung and Blood Institute/American Heart Association conference on scientific issues related to definition. Circulation 109: 433–438, 2004 [DOI] [PubMed] [Google Scholar]
- 13.Karpe F, Dickmann JR, Frayn KN. Fatty acids, obesity, and insulin resistance: time for a reevaluation. Diabetes 60: 2441–2449, 2011 [DOI] [PMC free article] [PubMed] [Google Scholar]
- 14.Jensen MD. Gender differences in regional fatty acid metabolism before and after meal ingestion. J Clin Invest 96: 2297–2303, 1995 [DOI] [PMC free article] [PubMed] [Google Scholar]
- 15.Levi B, James AW, Glotzbach JP, Wan DC, Commons GW, Longaker MT. Depot-specific variation in the osteogenic and adipogenic potential of human adipose-derived stromal cells. Plast Reconstr Surg 126: 822–834, 2010 [DOI] [PubMed] [Google Scholar]
- 16.Liu J, Grundy SM, Wang W, Smith SC, Jr, Vega GL, Wu Z, Zeng Z, Wang W, Zhao D. Ten-year risk of cardiovascular incidence related to diabetes, prediabetes, and the metabolic syndrome. Am Heart J 153: 552–558, 2007 [DOI] [PubMed] [Google Scholar]
- 17.McLaughlin T, Allison G, Abbasi F, Lamendola C, Reaven G. Prevalence of insulin resistance and associated cardiovascular risk factors among normal, overweight, and obese individuals. Metabolism 53: 495–499, 2004 [DOI] [PubMed] [Google Scholar]
- 18.McQuaid SE, Hodson L, Neville MJ, Dennis AL, Cheeseman J, Humphreys SM, Ruge T, Gilbert M, Fielding BA, Frayn KN, Karpe F. Downregulation of adipose tissue fatty acid trafficking in obesity: a driver for ectopic fat deposition? Diabetes 60: 47–55, 2011 [DOI] [PMC free article] [PubMed] [Google Scholar]
- 19.Meigs JB, Wilson PW, Fox CS, Vasan RS, Nathan DM, Sullivan LM, D'Agostino RB. Body mass index, metabolic syndrome, and risk of type 2 diabetes or cardiovascular disease. J Clin Endocrinol Metab 91: 2906–2912, 2006 [DOI] [PubMed] [Google Scholar]
- 20.Ravussin E, Smith SR. Increased fat intake, impaired fat oxidation, and failure of fat cell proliferation result in ectopic fat storage, insulin resistance, and type 2 diabetes mellitus. Ann NY Acad Sci 967: 363–378, 2002 [DOI] [PubMed] [Google Scholar]
- 21.Reaven G. All obese individuals are not created equal: insulin resistance is the major determinant of cardiovascular disease in overweight/obese individuals. Diabet Vasc Dis Res 2: 105–112, 2005 [DOI] [PubMed] [Google Scholar]
- 22.Roden M, Price TB, Perseghin G, Petersen KF, Rothman DL, Cline GW, Shulman GI. Mechanism of free fatty acid-induced insulin resistance in humans. J Clin Invest 97: 2859–2864, 1996 [DOI] [PMC free article] [PubMed] [Google Scholar]
- 23.Ruderman N, Chisholm D, Pi-Sunyer X, Schneider S. The metabolically obese, normal-weight individual revisited. Diabetes 47: 699–713, 1998 [DOI] [PubMed] [Google Scholar]
- 24.Spalding KL, Arner E, Westermark PO, Bernard S, Buchholz BA, Bergmann O, Blomqvist L, Hoffstedt J, Näslund E, Britton T, Concha H, Hassan M, Rydén M, Frisén J, Arner P. Dynamics of fat cell turnover in humans. Nature 453: 783–787, 2008 [DOI] [PubMed] [Google Scholar]
- 25.Strawford A, Antelo F, Christiansen M, Hellerstein MK. Adipose tissue triglyceride turnover, de novo lipogenesis, and cell proliferation in humans with 2H2O. Am J Physiol Endocrinol Metab 286: E577–E588, 2004 [DOI] [PubMed] [Google Scholar]
- 26.Tchoukalova YD, Votruba SB, Tchkonia T, Giorgadze N, Kirkland JL, Jensen MD. Regional differences in cellular mechanisms of adipose tissue gain with overfeeding. Proc Natl Acad Sci USA 107: 18226–18231, 2010 [DOI] [PMC free article] [PubMed] [Google Scholar]
- 27.Turner SM, Murphy EJ, Neese RA, Antelo F, Thomas T, Agarwal A, Go C, Hellerstein MK. Measurement of TG synthesis and turnover in vivo by 2H2O incorporation into the glycerol moiety and application of MIDA. Am J Physiol Endocrinol Metab 285: E790–E803, 2003 [DOI] [PubMed] [Google Scholar]
- 28.Unger RH. Lipid overload and overflow: metabolic trauma and the metabolic syndrome. Trends Endocrinol Metab 14: 398–403, 2003 [DOI] [PubMed] [Google Scholar]
- 29.Virtue S, Vidal-Puig A. Adipose tissue expandability, lipotoxicity and the metabolic syndrome—an allostatic perspective. Biochim Biophys Acta 1801: 338–349, 2010 [DOI] [PubMed] [Google Scholar]
- 30.Wildman RP, Muntner P, Reynolds K, McGinn AP, Rajpathak S, Wylie-Rosett J, Sowers MR. The obese without cardiometabolic risk factor clustering and the normal weight with cardiometabolic risk factor clustering: prevalence and correlates of 2 phenotypes among the US population (NHANES 1999–2004). Arch Intern Med 168: 1617–1624, 2008 [DOI] [PubMed] [Google Scholar]
- 31.Wilson PW, D'Agostino RB, Sullivan I, Parise H, Kannel WB. Overweight and obesity as determinants of cardiovascular risk: the Framingham experience. Arch Intern Med 162: 1867–1872, 2002 [DOI] [PubMed] [Google Scholar]
- 32.Zhang XJ, Chinkes A, Wu D, Herndon DN, Wolfe RR. The synthetic rate of muscle triglyceride but not phospholipids is increased in obese rabbits in comparison with lean rabbits. Metabolism 58: 1649–1656, 2009 [DOI] [PubMed] [Google Scholar]