

Abstract
Periodontal disease is more prevalent and severe in patients with diabetes than in nondiabetic patients. In addition to diabetes, a large number of studies have demonstrated an association between obesity and chronic periodontal disease. However, the underlying mechanisms have not been well understood. Since plasma free fatty acids (FAs) are elevated in obese patients and saturated FAs such as palmitic acid (PA) have been shown to increase host inflammatory response, we sought to find out how PA interacts with lipopolysaccharide (LPS), an important pathological factor involved in periodontal disease, to enhance inflammation. We found that whereas low concentration of LPS (1 ng/ml) stimulated interleukin (IL)-6 expression in RAW 264.7 macrophages, PA further augmented it fourfold. Besides IL-6, PA amplified the stimulatory effect of LPS on a large amount of Toll-like receptor (TLR)4-mediated expression of proinflammatory signaling molecules such as IL-1 receptor-associated kinase-like 2 and proinflammatory molecules, including monocyte chemotactic protein-1 and colony-stimulating factor. We also observed that PA augmented TLR4 but not TLR2 signal, and the augmentation was mediated by nuclear factor-κB (NF-κB) pathways. To further elucidate the regulatory mechanism whereby PA amplifies LPS signal, our studies showed that PA and LPS synergistically increased hydrolysis of sphingomyelin by stimulating acid sphingomyelinase (ASMase) activity, which contributed to a marked increase in ceramide production and IL-6 upregulation. Taken together, this study has demonstrated that PA markedly augments TLR4-mediated proinflammatory signaling triggered by low concentration of LPS in macrophages, and ASMase plays a key role in the augmentation.
Keywords: fatty acid, sphingomyelinase, lipopolysaccharide, toll-like receptor, inflammation
lipopolysaccharide (LPS), a constituent of the outer membrane of gram-negative bacteria, activates Toll-like receptor (TLR) 4 and elicits inflammatory signaling (2). LPS plays a pivotal role in periodontal disease by inducing a chronic inflammatory response that leads to tissue destruction (40). Furthermore, studies have documented that LPS-triggered inflammatory signaling is enhanced by hyperglycemia and other diabetes-associated factors (32), which elucidates a potential mechanism by which diabetes increases the prevalence and severity of periodontal disease (31).
In recent years, a large number of studies have demonstrated an association between obesity and periodontal disease (4, 5). However, the mechanisms underlying the association remain largely undetermined. Given that it has been shown that free fatty acids (FAs) are elevated in patients with obesity (3), and saturated FAs are known to increase host inflammatory response (7, 18), it is plausible to determine how saturated FAs interact with LPS to regulate inflammatory signaling.
LPS is not only present locally in tissues such as periodontium when infection with gram-negative bacteria occurs; it also exists systematically in blood circulation at low concentrations (21). Interestingly, clinical studies have shown that circulating LPS is increased in patients with obesity (21, 33), and animal studies have shown that TLR4 deficiency in mice protects against the development of insulin resistance (41). Taking these clinical and animal findings together, it is indicated that TLR4 signaling triggered by low concentrations of LPS may contribute to the inflammatory state that is essential for developing insulin resistance (50). However, it remains unclear whether obesity augments inflammatory signaling triggered by low concentration of LPS.
In patients with type 2 diabetes and/or obesity, it has been shown that saturated FAs are associated with chronic low-grade inflammation and insulin resistance (12, 17). Furthermore, a recent study reported that dyslipidemia in patients with type 2 diabetes was associated with significantly increased palmitic acid (PA), an abundant FA in plasma, in triglycerides, and the levels of PA in triglycerides correlated with insulin resistance (52). Based on these reports, we hypothesized that saturated FAs amplify the inflammatory signaling triggered by low concentrations of LPS. In this study, we demonstrated that PA amplified inflammatory signaling triggered by 1 ng/ml LPS in macrophages. To elucidate the underlying mechanisms, we demonstrated that PA and LPS had a synergistic effect on acid sphingomyelinase (ASMase)-mediated sphingomyelin (SM) hydrolysis and a marked increase in ceramide (CER).
CER, a central sphingolipid, is produced mainly through either the SM hydrolysis or de novo synthesis (38). During the SM hydrolysis, CER is generated by breakdown of SM via the activation of SMase; during the de novo synthesis of CER, CER is generated by condensation of palmitoyl-CoA and serine, with serine palmitoyl transferase 1 (SPT) as the first and rate-limiting step. We found from this study that the SM hydrolysis pathway was largely responsible for the marked CER increase and robust upregulation of inflammatory molecules such as interleukin (IL)-6.
MATERIALS AND METHODS
Cell culture.
The murine macrophage cell line RAW 264.7 has been used extensively in the investigations of the role of macrophages in inflammation-related diseases (42). RAW 264.7 cells were purchased from American Type Culture Collection (Manassas, VA) and grown in DMEM (American Type Culture Collection, Manassas, VA) supplemented with 10% heat-inactivated fetal calf serum (HyClone, Logan, UT). The cells were maintained in a 37°C, 90% relative humidity, 5% CO2 environment. Human monocytes were isolated as described previously (48) from blood obtained from healthy donors. The blood donation for monocyte isolation was approved by the Medical University of South Carolina Institutional Review Board. Human monocytes were differentiated into macrophages by incubation with RPMI 1640 medium (Life Technologies, Grand Island, NY) containing 10% human serum, 1% minimum Eagle's medium nonessential amino acid solution, and 0.6 g/100 ml HEPES for 7 days (36). Human monocyte-derived macrophages were used to show that the augmentation of LPS-stimulated IL-6 secretion by PA observed from RAW 264.7 cells was also observed in human normal macrophages. For cell treatment, LPS from E. coli and PA (Sigma, St. Louis, MO) were used. The LPS was highly purified by phenol extraction and gel filtration chromatography and was cell culture tested.
PA preparation.
The PA used in this study was either bovine serum albumin (BSA) free or conjugated with BSA, as described previously (16, 47). To prepare PA without BSA, PA was dissolved in 0.1 N NaOH and 70% ethanol at 70°C to make 50 mM. To make PA conjugated with BSA, the 50 mM PA solution was added dropwise into 5% BSA with low endotoxin and without FA (Sigma) to make a final stock of 5 mM PA (final PA/BSA ratio was 2.3:1). The solution was kept at 55°C for 10 min, mixed, and brought to room temperature. Unless otherwise specified, PA without BSA was used in the experiments.
Cell treatments.
In all experiments, unless otherwise specified, RAW 264.7 cells were treated with 1 ng/ml LPS, 100 μM PA, or both 1 ng/ml LPS and 100 μM PA for 24 h. After the treatment, culture medium was collected for quantification of IL-6 protein, and cells were harvested for quantification of IL-6 mRNA.
Enzyme-linked immunosorbent assay.
IL-6 in medium was quantified using sandwich enzyme-linked immunosorbent assay (ELISA) kits according to the protocol provided by the manufacturer (Biolegend, San Diego, CA).
Real-time PCR.
Total RNA was isolated from cells using the RNeasy minikit (Qiagen, Santa Clarita, CA). First-strand complementary DNA (cDNA) was synthesized with the iScript cDNA synthesis kit (Bio-Rad Laboratories, Hercules, CA) using 20 μl of the reaction mixture containing 0.5 μg of total RNA, 4 μl of 5× iScript reaction mixture, and 1 μl of iScript reverse transcriptase. The complete reaction was cycled for 5 min at 25°C, 30 min at 42°C, and 5 min at 85°C using a PTC-200 DNA Engine (MJ Research, Waltham, MA). The reverse transcription reaction mixture was then diluted 1:10 with nuclease-free water and used for PCR amplification in the presence of the primers. The Beacon designer software (Premier Biosoft International, Palo Alto, CA) was used for primer designing (mouse IL-6: 5′ primer sequence, TGGAGTCACAGAAGGAGTGGCTAAG; 3′ primer sequence, TCTGACCACAGTGAGGAATGTCCAC). Primers were synthesized by Integrated DNA Technologies, (Coralville, IA). Mouse ASMase primers (PPM25140A) were purchased from Qiagen. Real-time PCR was performed in duplicate using 25 μl of the reaction mixture containing 1.0 μl of RT mixture, 0.2 μM of both primers, and 12.5 μl of iQ SYBR Green Supermix (Bio-Rad Laboratories). Real-time PCR was run in the iCycler real-time detection system (Bio-Rad Laboratories) with a two-step method. The hot-start enzyme was activated (95°C for 3 min), and cDNA was then amplified for 40 cycles consisting of denaturation at 95°C for 10 s and annealing/extension at 60°C for 45 s. A melt curve assay was then performed (55°C for 1 min, and then temperature was increased by 0.5°C every 10 s) to detect the formation of primer-derived trimmers and dimmers. Mouse glyceraldehyde 3-phosphate dehydrogenase (GAPDH) was used as a control (5′ primer sequence, GDDTTCCGTGTTCCTACC; 3′ primer sequence, GCCTGCTTCACCACCTTC). Data were analyzed with the iCycler iQ software. The average starting quantity of fluorescence units was used for analysis. Quantification was calculated using the starting quantity of targeted cDNA relative to that of GAPDH cDNA in the same sample.
PCR arrays.
First-strand cDNA was synthesized from RNA using the RT2 First Strand Kit (SuperArray Bioscience, Frederick, MD). Mouse TLR pathway-focused PCR arrays (SuperArray Bioscience) were performed using 2X SuperArray RT2 quantitative PCR master mix and the first-strand cDNA by following the instructions from the manufacturer.
IL-6 mRNA stability analysis.
RAW 264.7 cells were plated in 12-well plates at a density of 0.4 × 10⁶ cells/well overnight and treated with 1 ng/ml LPS, 100 μM PA, or both for 12 h, followed by addition of 10 μg/ml actinomycin D (Sigma-Aldrich, St. Louis, MO). RAW 264.7 cells were harvested 2 h after the addition of actinomycin D, and IL-6 mRNA was quantified using real-time PCR, as described above.
Transfection and luciferase activity assay.
RAW 264.7 cells were transiently transfected with p1168huIL6P-luc+ plasmids (Belgian Co-ordinated Collections of Micro-organisms, Brussels, Belgium) (1 μg/106 cells) with transfection reagent FuGENE HD (Promega, Madison, WI). Cells were cotransfected with the Renilla luciferase reporter plasmid pRL-TK (Promega) (50 ng/106 cells) as an internal control. Twenty-four hours after transfection, the cells were stimulated with 1 ng/ml LPS, 100 μM PA, or both LPS and PA. RAW 264.7 cells were also transfected with 1 μg of NF-κB or activator protein-1 (AP-1) Cignal Reporter (Qiagen, Valencia, CA), using FuGENE HD as transfection reagent, for 24 h. The renilla luciferase constructs were used as control. The cells were then treated with fresh medium containing 1 ng/ml LPS, 100 μM PA, or LPS plus PA for 12 or 24 h. After the treatment, the cells were rinsed with cold PBS and lysed with the buffer from the Dual-Luciferase Reporter Assay System (Promega). Both firefly and renilla luciferase levels were measured in a luminometer using the dual-luciferase reporter assay reagents (Promega) according to the instruction from the manufacturer. The firefly luciferase levels were normalized to the renilla luciferase levels.
Immunoblotting.
Cytoplasmic and nuclear protein was extracted using NE-PER nuclear and cytoplasmic extraction kit (Pierce, Rockford, IL). The concentration of protein was determined using a protein assay kit (Bio-Rad, Hercules, CA). Thirty micrograms of protein from each sample was electrophoresed in a 10% polyacrylamide gel. After proteins were transferred to a polyvinylidene fluoride membrane, immunoblotting was performed using antibodies against inhibitor of NF-κB (IκB, 1:1,000; Cell Signaling Technology, Danvers, MA), GAPDH (1:5,000), nuclear NF-κB p50 (1:500), and nuclear NF-κB p65 (1:1,000; Cell Signaling Technology). The proteins were visualized by incubating the membrane with chemiluminescence reagent (NEN Life Science Products, Boston, MA) for 1 min and exposing the membrane to X-ray films for 1–30 min.
Lipidomics.
RAW 264.7 cells were collected, fortified with internal standards, extracted with ethyl acetate-isopropyl alcohol-water (60:30:10, vol/vol/vol), evaporated to dryness, and reconstituted in 100 μl of methanol. Simultaneous electrospray ionization/mass spectrometry/mass spectrometry analyses of sphingoid bases, sphingoid base 1-phosphates, CERs, and SMs were performed on a Thermo Finnigan TSQ 7000 triple quadrupole mass spectrometer operating in a multiple-reaction monitoring positive ionization mode. The phosphate contents of the lipid extracts were used to normalize the MS measurements of sphingolipids. The phosphate contents of the lipid extracts were measured with a standard curve analysis and a colorimetric assay of ashed phosphate (53).
Treatment of cells with the inhibitors of signaling pathways.
RAW 264.7 cells were treated with 1 ng/ml LPS, 100 μM PA, or LPS plus PA in the absence or presence of 10 μM PD-98059 [inhibitor of the extracellular signal-regulated kinase (ERK) pathway], SP-600125 [inhibitor of the c-Jun NH2-terminal kinase (JNK) pathway], SB-203580 [inhibitor of p38 mitogen-activated protein kinase (MAPK) pathway], and 2.5 or 5 μM of Bay117085 (inhibitor of NF-κB pathway) (Calbiochem/EMD Biosciences, San Diego, CA) for 24 h. After the treatment, IL-6 in medium was quantified using ELISA.
RNA interference.
RAW 264.7 cells were transiently transfected with 200 nM ASMase siRNA (sc-41651; Santa Cruz Biotechnology, Santa Cruz, CA) or the scrambled control siRNA (sc-37007; Santa Cruz Biotechnology) using Lipofectamine 2000 (Life Technologies), following the manufacturer's instructions. Twenty-four hours later, transfected cells were treated with or without 1 ng/ml LPS, 100 μM PA, or LPS plus PA for 24 h.
ASMase activity assay.
RAW 264.7 cells were treated, and cell lysate was then used for ASMase activity assay using an ASMase assay kit (Cayman Chemical, Ann Arbor, MI) according to the manufacturer's instructions.
SPT activity assay.
Microsomal SPT activity was assayed in vitro, as described previously (26). RAW 264.7 cells were pelleted, rinsed in PBS, and resuspended in sonication buffer containing 25 mM Tris, pH 7.4, 5 mM EDTA, 1 mM phenylmethylsulfonyl fluoride, 20 μg/ml chymotripsin, leupeptin, antipain, and pepstin. Samples were disrupted by probe sonication, using three 10-s pulses, intercolated with incubation on ice. The resulting homogenate was then centrifuged for 5 min at 1,000 g, and the supernatant was subjected to centrifugation at 100,000 g for 1 h. The resulting pellet was resuspended by gentle pipetting in 20 μl of 25 mM Tris, pH 7.4, containing 30% glycerol, and protein concentration was measured using the Micro BCA Protein Assay Kit (Thermo-Fisher, Rockford, IL). For each replicate, 50 μg of microsomal protein was incubated for 20 min at 37°C in the presence of 100 mM HEPES, pH 8.3, 5 mM dithiothreitol, 50 μM pyridoxal-5′-phosphate, 5 mM [3H]serine (30,000 counts·min−1·nmol−1), and 50 μM palmitoyl-CoA. At the end of the assay period, reactions were stopped by the addition of 0.75 ml of CHCL3-CH3OH (1:2). Phase separation was induced by the addition of 1 ml of 0.5 N NH4OH and 0.5 ml of CHCl3. The aqueous phase was discarded, and the organic phase was washed twice with water and dried. Labeling of the sample was quantified by liquid scintillation. Three biological replicates, with three technical replicates each, were used for each treatment. Activity is presented as picomoles per milligram protein per minute.
Statistical analysis.
Data are presented as means ± SD. ANOVA was performed to determine the statistical significance among different experimental groups. A value of P < 0.05 was considered significant.
RESULTS
PA amplifies macrophage inflammatory response triggered by low concentrations of LPS.
In our first experiment, RAW 264.7 macrophages were treated with low concentrations (0.1–1 ng/ml) of LPS in the absence or presence of 100 μM of PA for 24 h, and IL-6 released into culture medium was then quantified. Results showed that the low concentrations of LPS, 0.5 and 1 ng/ml, were capable of stimulating IL-6 secretion (Fig. 1A). Interestingly, although PA itself had no effect on IL-6 secretion, it amplified LPS-stimulated IL-6 secretion 3.9-fold in response to 0.5 ng/ml LPS and 4.2-fold in response to 1 ng/ml LPS (Fig. 1A). Human monocyte-derived macrophages were more sensitive to LPS compared with RAW 264.7 cells, and 100 μM PA significantly potentiated IL-6 secretion stimulated by 0.1 or 0.5 ng/ml LPS 2.8- and 2.2-fold, respectively, which was less potent compared with RAW 264.7 cells (Fig. 1B). PA enhanced LPS effect on IL-6 secretion in a concentration-dependent manner, and the enhancement plateaued at 100 μM PA (Fig. 1C). In addition to PA, stearic acid (SA), an 18-carbon saturated FA, also increased LPS-stimulated IL-6 secretion significantly (Fig. 1D). In contrast, oleic acid (monounsaturated fatty acid), linoleic acid, and docosahexaenoic acid (polyunsaturated fatty acids) did not increase LPS-stimulated IL-6 secretion (data not shown).
Fig. 1.
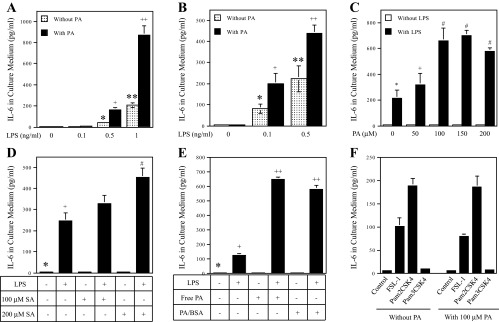
The effect of palmitic acid (PA) or stearic acid (SA) on LPS-stimulated IL-6 secretion from macrophages. Bars with different symbols in the bar graphs have significantly different values. A: RAW 264.7 cells were treated with different concentrations (0.1–1 ng/ml) of LPS in the absence or presence of 100 μM PA for 24 h. + and *P < 0.01; ++ and **P < 0.01. B: human monocyte-derived macrophages were treated with 0.1 or 0.5 ng/ml LPS in the absence or presence of 100 μM PA for 24 h. After treatment, IL-6 in culture medium was quantified using ELISA. + and *P < 0.01; ++ and **P < 0.01. C: RAW 264.7 cells were treated with or without 1 ng/ml LPS in the absence or presence of different concentrations of PA (50–200 μM) for 24 h. After the treatment, IL-6 in culture medium was quantified using ELISA. # and *P < 0.01; + and *P < 0.05. D: RAW 264.7 cells were treated with 1 ng/ml LPS in the absence or presence of 100 or 200 μM SA for 24 h. After treatment, IL-6 in culture medium was quantified using ELISA. + and *P < 0.01; # and *P < 0.01; # and +P < 0.01. E: the effect of bovine serum albumin (BSA)-unconjugated PA (free PA) and BSA-conjugated PA (PA/BSA) on IL-6 secretion induced by LPS. RAW 264.7 cells were treated with 1 ng/ml LPS in the absence or presence of 100 μM free or BSA-conjugated PA for 24 h. After treatment, IL-6 in in culture medium was quantified using ELISA. + and *P < 0.01; ++ and +P < 0.01. F: PA does not augment Toll-like receptor (TLR)2 signaling. RAW 264.7 cells were treated with 1 ng/ml fibroblast-stimulating ligand-1 (FSL-1) (TLR2/6 ligand), pam2CSK4 (TLR2/6 ligand), or pam3CSK4 (TLR2/1 ligand) in the absence or presence of 100 μM PA for 24 h. After treatment, IL-6 in culture medium was quantified using ELISA. The presented data (means ± SD) were from 1 of 3 experiments with similar results.
To better understand the effect of PA on LPS-triggered inflammatory responses, we profiled gene expression at 24 h in RAW 264.7 cells using a TLR signaling pathway-focused PCR array. The results in Table 1 are striking: In addition to IL-6, PA had a robust synergy with 1 ng/ml LPS on the stimulation of a large number of proinflammatory cytokines, such as tumor necrosis factor (TNF)α, IL-1α, IL-1β, colony-stimulating factor (CSF)2, CSF3, and monocyte chemotactic protein (MCP)-1. For example, whereas PA and LPS alone stimulated CSF3 3.3- and 4.6-fold, respectively, the combination of PA and LPS led to a 676.9-fold increase. More importantly, our data showed that PA and LPS also had a synergy on TLR4 signaling pathway-related molecules such as myeloid differentiation factor-2, IL-1 receptor-associated kinase 2, and TIR domain-containing, adapter-inducing interferon-β, suggesting that PA enhances TLR4 signaling.
Table 1.
Amplification of LPS-stimulated gene expression by PA
| CT in Control Cells | CT in LPS-Treated Cells | CT in PA-Treated Cells | CT in LPS and PA-Treated Cells | Ratio of LPS-Treated vs. Control | Ratio of PA-Treated vs. Control | Ratio of LPS and PA-Treated vs. Control | |
|---|---|---|---|---|---|---|---|
| Cytokines | |||||||
| IL-6 | 30.55 | 30.39 | 29.54 | 25.86 | 1.1 | 2.0 | 25.8 |
| TNFα | 23.96 | 22.32 | 23.33 | 20.43 | 3.1 | 1.5 | 11.6 |
| IL-1α | 30.88 | 29.32 | 30.05 | 24.33 | 2.9 | 1.8 | 94.0 |
| IL-1β | 30.33 | 27.94 | 30.09 | 24.75 | 5.2 | 1.2 | 47.7 |
| IL-2 | 31.3 | 31.15 | 29.77 | 27.56 | 1.1 | 2.9 | 13.4 |
| CSF2 | 32.53 | 30.31 | 30.11 | 27.91 | 4.7 | 5.4 | 24.6 |
| CSF3 | 31.04 | 28.83 | 29.30 | 21.64 | 4.6 | 3.3 | 676.9 |
| TNFβ | 30.52 | 29.87 | 29.71 | 27.47 | 1.6 | 1.8 | 8.3 |
| IFNβ | 31.99 | 31.83 | 30.39 | 28.49 | 1.1 | 3.0 | 11.3 |
| IFNγ | 31.63 | 30.83 | 30.52 | 27.93 | 1.7 | 2.2 | 13.0 |
| MCP-1 | 28.41 | 24.71 | 27.82 | 20.27 | 13.0 | 1.5 | 281.9 |
| IL-10 | 30.22 | 29.45 | 29.30 | 27.25 | 1.7 | 1.9 | 7.8 |
| IL-12α | 31.26 | 30.73 | 30.58 | 28.33 | 1.4 | 1.6 | 7.6 |
| COX-2 | 28.1 | 25.55 | 27.25 | 20.95 | 5.8 | 1.8 | 141.5 |
| TLR and TLR-related signaling molecules | |||||||
| TLR3 | 27.58 | 26.95 | 27.14 | 26.16 | 1.5 | 1.4 | 2.7 |
| TLR5 | 31.92 | 30.99 | 29.94 | 27.62 | 1.9 | 3.9 | 19.6 |
| MD-2 | 25.16 | 25.13 | 25.24 | 24.05 | 1.0 | 0.9 | 2.2 |
| Irak2 | 24.82 | 24.18 | 24.92 | 23.50 | 1.6 | 0.9 | 2.5 |
| TRIF | 25.72 | 25.21 | 25.34 | 24.02 | 1.4 | 1.3 | 3.2 |
| IkBβ | 29.04 | 29.41 | 28.55 | 26.52 | 0.8 | 1.4 | 5.7 |
| CD80 | 27.79 | 26.43 | 27.49 | 24.72 | 2.6 | 1.2 | 8.4 |
| CD86 | 31.1 | 29.97 | 29.93 | 25.90 | 2.2 | 2.3 | 36.7 |
| Transcription factors | |||||||
| Jun | 24.89 | 24.77 | 24.73 | 23.28 | 1.1 | 1.1 | 3.1 |
| C/EBP | 22.45 | 21.71 | 22.10 | 20.76 | 1.7 | 1.3 | 3.2 |
| PPARα | 30.91 | 30.42 | 29.51 | 27.59 | 1.4 | 2.6 | 10.0 |
| Housekeeping gene | |||||||
| GAPDH | 17.86 | 17.74 | 17.81 | 17.88 | 1.1 | 1.0 | 1.0 |
PA, palmitic acid; CT, threshold cycle; CSF, colony-stimulating factor; MCP-1, monocyte chemotactic protein-1; COX-2, cyclooxygenase-2; TLR, Toll-like receptor; MD-2, myeloid differentiation factor-2; Irak2, IL-1 receptor-associated kinase 2; TRIF, TIR-domain-containing adapter-inducing IFNβ; C/EBP, CCAAT enhancer-binding protein; PPARα, peroxisome proliferator-activated receptor-α. RAW 264.7 cells were treated with 1 ng/ml LPS, 100 μM PA, or both for 24 h. After treatment, cells were harvested and subjected to PCR array study, as described in materials and methods. The GAPDH mRNA was used as a housekeeping gene. To compare the gene expression in cells treated with LPS, PA, or LPS + PA with that in control cells, ΔCT was first calculated by the following formula: ΔCT = CT in LPS, PA, or LPS + PA-treated cells − CT in control cells. The gene expression in cells treated with LPS, PA, or LPS + PA was presented as the fold of the control gene expression and calculated as 2ΔCT.
The augmentation of LPS-stimulated expression of inflammatory molecules by PA was not observed in fibroblasts, adipocytes, or U937 mononuclear cells (data not shown), indicating that the potentiation of LPS-triggered inflammatory signaling by PA is specific for macrophages.
Either free PA or BSA-conjugated PA equally amplifies LPS-stimulated IL-6 secretion.
Given that most PA in the circulation is carried by albumin (51), we compared the effects of free PA and BSA-conjugated PA on LPS-stimulated IL-6 secretion. Results showed that although free PA or BSA-conjugated PA by itself did not stimulate IL-6 secretion, both amplified LPS-stimulated IL-6 secretion with similar potency (Fig. 1E), suggesting that the BSA conjugation does not affect the effect of PA on the augmentation of LPS-stimulated IL-6 secretion.
Specificity of PA amplification on TLR4 signaling.
Since LPS specifically binds to and activates TLR4, the above studies indicate that PA amplifies TLR4 signaling. To determine whether the amplification by PA is specific for TLR4 signaling, we assessed the effect of PA on TLR2/6 or TLR2/1 signaling. In this study, RAW 264.7 cells were treated with fibroblast-stimulating ligand-1 (ligand for TLR2/6), pam2CSK4 (another ligand for TLR2/6), or pam3CSK4 (ligand for TLR2/1) in the absence or presence of PA. Results showed that PA had no effect on IL-6 secretion triggered by TLR2 ligands (Fig. 1F), indicating that the effect of PA is specific for TLR4 signaling.
PA increases LPS-stimulated IL-6 expression by enhancing IL-6 transcription.
It has been shown that IL-6 expression can be regulated at the transcriptional or/and posttranscriptional levels in macrophages (45). To characterize the regulation of IL-6 expression by PA and LPS, we performed time course studies on both IL-6 protein secretion and IL-6 mRNA expression in response to LPS, PA, or LPS plus PA. As shown in Fig. 2A, PA amplified LPS-stimulated IL-6 secretion fourfold at 12 h. Furthermore, either LPS or LPS in combination with PA induced a rapid IL-6 secretion, and the peak of IL-6 in culture medium induced by LPS and LPS in combination with PA was observed at 8 and 12 h, respectively.
Fig. 2.

Time course of IL-6 secretion and mRNA expression by RAW 264.7 cells treated with LPS, PA, or both LPS and PA. A and B: RAW 264.7 cells were treated with 1 ng/ml LPS, 100 μM PA, or both LPS and PA for different times as indicated. At each time point, culture medium was collected and RNA isolated from cells. IL-6 in culture medium (A) and IL-6 mRNA (B) in cells were quantified using ELISA and real-time PCR, respectively. The presented data (means ± SD) were from 1 of 3 experiments with similar results. The lack of bars (SD) on some points is due to the fact that the SD was too small to be shown on the figure. C: the effect of LPS or the combination of LPS and PA on IL-6 mRNA stability. RAW 264.7 cells were treated with 1 ng/ml LPS or 1 ng/ml LPS + 100 μM PA for 12 h, followed by addition of 10 μg/ml actinomycin D. The cells were harvested 2 h after the addition of actinomycin D, and IL-6 mRNA was quantified using real-time PCR. The data presented (means ± SD) were from 1 of 2 experiments with similar results. + and *P < 0.01; * and **P > 0.05. Different symbols represent significantly different values.
IL-6 mRNA in the same cells was quantified to compare with IL-6 secretion. Results showed that, consistent with the effect on IL-6 protein secretion, the maximal IL-6 mRNA level induced by PA and LPS is six times that induced by LPS alone (Fig. 2B). Results also showed that either LPS alone or LPS in combination with PA induced a rapid IL-6 mRNA expression at 4 h, which was earlier than the time for the secretion of significant amounts of IL-6 protein. Interestingly, although IL-6 mRNA started declining rapidly in cells treated with LPS alone, it kept increasing for the next 8 h in cells treated with LPS in combination with PA (Fig. 2B). Comparing the kinetics of IL-6 mRNA expression and protein secretion, it is indicated that PA amplifies LPS-induced IL-6 secretion by enhancing IL-6 transcription.
In addition to the transcriptional regulation of IL-6 expression, it has been reported that IL-6 expression can be also regulated at the posttranscriptional level (45). Therefore, we determined whether the posttranscriptional regulation was involved in the augmentation of LPS-induced IL-6 expression by PA. In this study, the inhibitory effect of actinomycin D, an inhibitor of transcription, on IL-6 transcription was confirmed by the finding that the treatment of cells with actinomycin D for 2 h reduced LPS-stimulated IL-6 mRNA level by 46% (Fig. 2C). Furthermore, results showed that in the presence of actinomycin D, no significant difference of IL-6 mRNA level was observed between cells treated with LPS alone or LPS in combination with PA (Fig. 2C). Taking the above results together, it was indicated that the amplification by PA on LPS-stimulated IL-6 secretion was due to the transcriptional regulation.
The involvement of signaling pathways in IL-6 upregulation by the combination of LPS and PA.
It is known that both MAPK pathways (ERK, JNK, and p38 cascades) and the NF-κB pathway are involved in LPS-stimulated IL-6 expression in macrophages (8). Thus, we determined which pathway was involved in IL-6 upregulation by the combination of LPS and PA. In this study, RAW 264.7 macrophages were treated with LPS alone or LPS and PA in the presence of the pharmacological inhibitors of the MAPK and NF-κB pathways. Results showed that IL-6 upregulated by LPS alone was inhibited by SP-600125, an inhibitor for the JNK pathway, PD-98059, an inhibitor for ERK pathway (Fig. 3A), and Bay117082, an inhibitor for NF-κB pathway (Fig. 3C), whereas IL-6 upregulation by LPS and PA was inhibited by SB-203580, an inhibitor for p38 MAPK pathway, SP-600125, PD-98059 (Fig. 3B), and Bay117082 (Fig. 3D). These data indicate that although the NF-κB pathway is essential for IL-6 upregulation by both LPS alone and the combination of LPS and PA, the p38 MAPK pathway is involved in IL-6 upregulation by the combination of LPS and PA but not by LPS alone.
Fig. 3.

The signaling pathways and transcription factors involved in LPS and PA-induced IL-6 expression. Bars with different symbols represent significantly different values. A–D: the effect of pharmacological inhibitors of signaling pathways on IL-6 secretion stimulated by LPS alone or the combination of LPS and PA. RAW 264.7 cells were treated with 1 ng/ml LPS alone (A) or 1 ng/ml LPS + 100 μM PA (B) in the absence or presence of 10 μM SB-203580 (SB), an inhibitor for the p38 MAPK pthway, 10 μM SP-600125 (SP), an inhibitor for the JNK pathway, or 10 μM PD-98059 (PD), an inhibitor for the ERK pathway, for 24 h. The cells were also treated with 1 ng/ml LPS alone (C) and the combination of 1 ng/ml LPS + 100 μM PA (D) in the absence or presence of 2.5 or 5 μM Bay117085 (Bay), an inhibitor for the NF-κB pathway, for 24 h. After treatment, IL-6 in culture medium was quantified using ELISA. + and *P < 0.01; # and *P < 0.01; ★ and *P < 0.01. E: RAW 264.7 cells were transfected with plasmids (p1168huIL6P-luc+) for 24 h. The constitutively expressing renilla luciferase vectors were used as control (Ctl). After the transfection, the cells were treated with 1 ng/ml LPS, 100 μM PA, or both LPS and PA for 12 h. + and *P < 0.01; # and *P < 0.01. F and G: RAW 264.7 cells were transfected with the DNA vectors constructed with NF-κB (F) or activator protein-1 (AP-1)-binding element (G) in the promoter region and firefly luciferase reporter sequence in the presence of FuGENE HD as transfection reagent for 24 h. The constitutively expressing renilla luciferase vectors were used as control. After the transfection, the cells were treated with fresh medium containing 1 ng/ml LPS, 100 μM PA, or LPS and PA for 12 or 24 h. The NF-κB or AP-1 activity was presented as the ratio of firefly luciferase vs. renilla luciferase activity. The presented data (means ± SD) are from 1 of 2 experiments with similar results. + and *P < 0.01; # and +P < 0.01; ++ and **P < 0.1; # and ★P < 0.01. H–J: RAW 264.7 cells were treated with 1 ng/ml LPS, 100 μM PA, or both LPS and PA for the times as indicated, and cytoplasmic (H) and nuclear protein (I) were isolated and subjected to immunoblotting of p65 and p50. The cytoplasmic protein was also used for immunoblotting of IkB-α (J). Histone and GAPDH were used as nuclear and cytoplasmic control, respectively, to ensure loading of equal amount of protein for all samples to gel. The data presented are from 1 of 2 experiments with similar results.
PA enhances LPS-stimulated NF-κB transcript-ional activity.
LPS is known to stimulate AP-1 and NFκB transcriptional activities via MAPK and NFκB pathways, respectively (8). In this study, we further determined which LPS-induced transcriptional activity, AP-1 or NF-κB, was enhanced by PA. In the first experiment, RAW 264.7 macrophages were transfected with luciferase reporter constructs containing the 1,168-bp IL-6 promoter region that has both AP-1 and NF-κB binding motifs (49). After the transfection, cells were treated with LPS, PA, or both, and luciferase activity was then determined. Results showed that LPS stimulated luciferase activity and that PA further enhanced the stimulation (Fig. 3E). To determine which transcription factor, NF-κB or AP-1, is involved in the transcriptional activation by LPS and PA, in the next experiment, RAW 264.7 cells were transfected with the luciferase reporter vectors constructed with either NF-κB or AP-1-binding element in the promoter. Results showed that LPS stimulated NF-κB activity at 12 h, and PA further enhanced it significantly (Fig. 3F). In contrast, although LPS stimulated AP-1 activity at both 12 and 24 h, PA did not further enhance it (Fig. 3G). These findings suggest that whereas LPS activates both NF-κB and AP-1, PA selectively enhances LPS-stimulated NF-κB transcriptional activity.
To further confirm the action of PA on LPS-stimulated NF-κB activation, the effect of PA on LPS-stimulated NF-κB nuclear translocation was examined. Immunoblotting showed that whereas both LPS and PA decreased the cytoplasmic p65, a major subunit of NF-κB, at 2 h, the combination of LPS and PA further decreased the cytoplasmic p65 (Fig. 3H). Furthermore, the markedly decreased cytoplasmic p65 in response to LPS plus PA was accompanied by an increase in nuclear p65 (Fig. 3I). Whereas either LPS or PA alone increased nuclear p65, the combination of LPS and PA further increased it. In contrast, although both LPS and PA increased nuclear p50, the combination of LPS and PA did not further increase nuclear p50, suggesting that p65 is the major target by PA to potentiate the stimulatory effect of LPS on NF-κB. Moreover, we also determined the effect of LPS and PA on the inhibitor of NF-κB (IκB)α that has been shown to be degraded by LPS for NF-κB activation. Results showed that whereas LPS alone induced only a brief degradation of IκBα at 20 min, LPS and PA treatment led to a potent and prolonged IκBα degradation after 20 min (Fig. 3J).
PA and LPS exert a stimulatory synergy on cellular CER production.
Since it has been reported that CER was involved in LPS-stimulated expression of proinflammatory genes (35), we conducted lipidomics to determine the effect of PA and LPS on the levels of different CER species in RAW 264.7 macrophages. Time course studies showed that LPS had an insignificant effect on CER levels, but PA alone increased contents of C16-, C18-, C20-, C22-, and C24-CER in a time-dependent manner, and the increase was plateaued at 8 h for C16-, C18-, C20-, and C22-CER (Fig. 4 and Table 2). Interestingly, the combination of PA and LPS led to a remarkable increase in CERs compared with PA alone (Fig. 4 and Table 2). Furthermore, the increase in C16-, C18-, C20-, and C22-CER in response to PA and LPS plateaued at 12 h (Fig. 4), which is well-matched with the time frame for the peak increase of IL-6 mRNA expression (Fig. 2B).
Fig. 4.

The time courses of cellular ceramide production in response to treatment with LPS, PA, or both LPS and PA. RAW 264.7 cells had no treatment or were treated with 1 ng/ml LPS, 100 μM PA, or LPS + PA for different times as indicated, and cells were harvested at each time point and subjected to lipidomic analysis to quantify different ceramides and sphingosine. The data presented are from 1 of 2 experiments with similar results.
Table 2.
Effect of LPS, PA, or LPS + PA on CER Level
| Time, h | C14-CER | C16-CER | C18-CER | C20-CER | C22-CER | C24-CER | C24:1-CER | Total CERs |
|---|---|---|---|---|---|---|---|---|
| Control | ||||||||
| 0 | 0.06 | 0.65 | 0.05 | 0.03 | 0.28 | 0.93 | 0.84 | 2.89 |
| 4 | 0.05 | 0.62 | 0.05 | 0.03 | 0.29 | 0.87 | 0.87 | 2.89 |
| 8 | 0.08 | 0.55 | 0.05 | 0.03 | 0.26 | 0.84 | 0.86 | 2.72 |
| 12 | 0.09 | 0.54 | 0.05 | 0.03 | 0.22 | 0.91 | 0.82 | 2.77 |
| 24 | 0.10 | 0.38 | 0.03 | 0.02 | 0.18 | 1.14 | 0.75 | 2.73 |
| LPS | ||||||||
| 0 | 0.06 | 0.65 | 0.05 | 0.03 | 0.28 | 0.93 | 0.84 | 2.89 |
| 4 | 0.04 | 0.73 | 0.05 | 0.04 | 0.33 | 0.95 | 0.84 | 3.10 |
| 8 | 0.09 | 0.55 | 0.05 | 0.03 | 0.24 | 0.83 | 0.77 | 2.70 |
| 12 | 0.09 | 0.55 | 0.05 | 0.03 | 0.21 | 1.08 | 0.70 | 2.84 |
| 24 | 0.06 | 0.33 | 0.02 | 0.02 | 0.14 | 1.29 | 0.61 | 2.63 |
| PA | ||||||||
| 0 | 0.06 | 0.65 | 0.05 | 0.03 | 0.28 | 0.93 | 0.84 | 2.89 |
| 4 | 0.05 | 1.04 | 0.19 | 0.11 | 0.64 | 1.12 | 0.97 | 4.25 |
| 8 | 0.09 | 1.13 | 0.23 | 0.14 | 0.85 | 1.14 | 0.91 | 4.55 |
| 12 | 0.09 | 0.94 | 0.21 | 0.14 | 0.85 | 1.03 | 0.79 | 4.15 |
| 24 | 0.11 | 0.58 | 0.16 | 0.11 | 0.72 | 1.19 | 0.77 | 3.76 |
| LPS + PA | ||||||||
| 0 | 0.06 | 0.65 | 0.05 | 0.03 | 0.28 | 0.93 | 0.84 | 2.89 |
| 4 | 0.12 | 1.59 | 0.32 | 0.18 | 0.89 | 1.32 | 1.06 | 5.56 |
| 8 | 0.15 | 2.09 | 0.53 | 0.31 | 1.34 | 1.33 | 0.94 | 6.83 |
| 12 | 0.16 | 2.14 | 0.59 | 0.38 | 1.88 | 1.80 | 1.05 | 8.14 |
| 24 | 0.19 | 1.96 | 0.54 | 0.41 | 2.07 | 3.17 | 1.11 | 9.61 |
The unit of the values is pmol/nmol Pi. CER, ceramide. RAW 264.7 cells were treated with 1 ng/ml LPS, 100 μM PA, or both LPS and PA for different times as indicated. After treatment, cells were harvested and subjected to the lipidomic analysis of CERs, as described in materials and methods.
Composition of CER in cells treated with LPS and PA.
The relative composition of different CER species in cells treated with LPS, PA, or LPS plus PA at 12 h was further analyzed. We selected the time point of 12 h for this analysis since IL-6 expression in response to LPS plus PA peaked at 12 h (Fig. 2B). Results showed that LPS did not change the composition of CERs, but PA increased the percentage of CERs with shorter carbon chains such as C16-, C18-, C20-, and C22-CER and decreased the percentage of CERs with longer chains such as C24- and C24:1-CER (Fig. 5). Interestingly, the combination of PA and LPS further increased the percentage of C16-, C18-, C20-, and C22-CER but decreased the percentage of C24- and C24:1-CER (Fig. 5), suggesting that the CERs with shorter carbon chains, such as C16-, C18-, C20-, and C22-CER, may play an important role in the upregulation of IL-6 expression by LPS and PA.
Fig. 5.

Composition of ceramides in RAW 264.7 cells after 12-h treatment with 1 ng/ml LPS, 100 μM PA, or both LPS and PA. The data presented in Fig. 4 were used for the analysis.
PA and LPS exert a stimulatory synergy on cellular SM hydrolysis that plays a key role in IL-6 upregulation.
CER is generated mainly by hydrolysis of the membrane SM through the action of SMases. To determine whether SM hydrolysis in response to LPS, PA, or LPS plus PA contributes to the CER increase described in Fig. 4 and Table 2, we quantified cellular SMs using lipidomics. Results in Table 3 showed that whereas PA and LPS alone decreased the total SM content by 6.1 and 6.7%, respectively, the combination of PA and LPS reduced total SM levels by 41%, suggesting a synergy of LPS and PA on SM hydrolysis. In analyzing the changes of each SM species in response to LPS, PA, or LPS plus PA, we found that whereas LPS reduced C16-, C18-, C22-, and C24:1-SM, PA reduced C14-, C16-, C24-, and C24:1-SM but increased C18-, C20-, C22-, and C22:1-SM (Table 3). Interestingly, the combination of LPS and PA further reduced C16-, C24-, and C24:1-SM and partially abolished PA-increased C18-, C20-, and C22-SM (Table 3). These data indicate that the increase in C16-, C24-, and C24:1-CER levels in response to LPS plus PA is likely a result of SM hydrolysis since C16-, C24-, and C24:1-SM levels were reduced markedly by LPS plus PA. In contrast, the increase in C18-, C20-, and C22-CER is likely due to the CER de novo synthesis since no significant reduction of C18-, C20-, or C22-SM levels by LPS plus PA was observed.
Table 3.
Effect of LPS, PA, or LPS + PA on SM Levels
| C14-SM | C16-SM | C18-SM | C18:1-SM | C20-SM | C22-SM | C22:1-SM | C24-SM | C24:1-SM | Total SM | |
|---|---|---|---|---|---|---|---|---|---|---|
| Control | 0.60 | 20.66 | 0.82 | 0.10 | 0.22 | 2.59 | 0.68 | 5.33 | 9.58 | 40.58 |
| LPS | 0.68 | 19.24 | 0.66 | 0.09 | 0.23 | 2.11 | 0.58 | 5.32 | 8.96 | 37.86 |
| PA | 0.48 | 15.79 | 2.17 | 0.15 | 0.65 | 5.71 | 0.95 | 3.41 | 8.79 | 38.10 |
| LPS + PA | 0.31 | 13.17 | 1.11 | 0.11 | 0.28 | 2.30 | 0.55 | 1.93 | 4.02 | 23.79 |
The unit of the values is pmol/nmol Pi. SM, sphingomyelin. RAW 264.7 cells were treated with 1 ng/ml LPS, 100 μM PA, or both LPS and PA for 12 h. After treatment, cells were harvested and subjected to the lipidomic analysis of SM, as described in materials and methods.
Since both SM hydrolysis and CER de novo synthesis contribute to CER production, we sought to determine which process plays a major role in the amplification of LPS-stimulated IL-6 by PA. Results showed that imipramine (IMP), an inhibitor of acid ASMase (23), inhibited the stimulatory effect of LPS and LPS plus PA on IL-6 secretion by 50 and 60%, respectively (Fig. 6A). To confirm that IMP inhibits SM hydrolysis and subsequent CER production, our lipidomic analysis showed that it inhibited total SM hydrolysis and CER production induced by LPS plus PA by 74 (Table 4) and 65% (Table 5), respectively. Taken the above data together, it was strongly indicated that the SM hydrolysis-dependent CER production plays an important role in the synergy by LPS and PA on IL-6 expression.
Fig. 6.
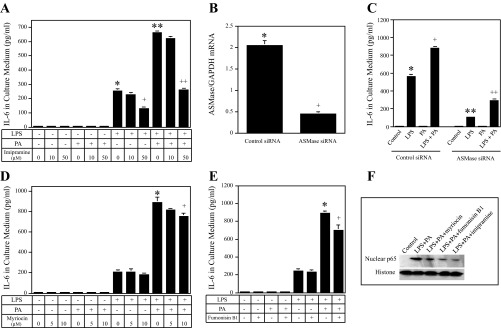
The effect of imipramine (IMP), myriocin, fumonisin B1, and acid sphingomyelinase (ASMase) knockdown on IL-6 secretion induced by LPS, PA, or both LPS and PA. Bars with different symbols in the bar graphs have significantly different values. A: RAW 264.7 cells were treated with 1 ng/ml LPS, 100 μM PA, or both LPS and PA in the absence or presence of IMP at either 10 or 50 μM for 24 h. After the treatment, IL-6 in culture medium was quantified using ELISA. + and *P < 0.01; * and **P < 0.01; ++ and **P < 0.01. B and C: RAW 264.7 cells were transfected with 200 nM ASMase or scrambled siRNA (control siRNA) for 24 h. After the transfection, ASMase knockdown by siRNA was confirmed using real-time PCR (B); the transfected cells were then treated with or without 1 ng/ml LPS, 100 μM PA, or both LPS and PA for 24 h, and IL-6 in culture medium was quantified using ELISA (C). + and *P < 0.01; ** and *P < 0.01; ++ and +P < 0.01. D and E: the effect of myriocin (serine palmitoyl-CoA transferase inhibitor) or fumonisin B1 (ceramide synthase inhibitor) on IL-6 secretion by RAW 264.7 cells treated with 1 ng/ml LPS, 100 μM PA, or both LPS and PA. RAW 264.7 cells were treated with 1 ng/ml LPS, 100 μM PA, or both LPS and PA in the absence or presence of either 5 or 10 μM myriocin (D) or 250 μM fumonisin B1 (E) for 24 h. + and *P < 0.05. F: reduction of LPS and PA-stimulated nuclear p65 level by inhibitors of ceramide synthesis and sphingomyelin hydrolysis. RAW 264.7 cells were treated with 1 ng/ml LPS and 100 μM PA in the absence or presence of 10 μM myriocin, 250 μM fumonisin B1, or 50 μM IMP for 24 h. After the treatment, nuclear protein was isolated and immunoblotting performed to detect p65, as described in materials and methods.
Table 4.
The Effect of IMP on SM levels in cells treated with LPS, PA, or LPS + PA
| C16-SM | C18-SM | C20-SM | C22-SM | C24-SM | C24:1-SM | Total SM | |
|---|---|---|---|---|---|---|---|
| Control | 27.25 | 1.58 | 0.53 | 2.80 | 2.02 | 5.62 | 43.13 |
| Control + IMP | 27.30 | 1.84 | 0.62 | 3.06 | 1.92 | 4.97 | 42.77 |
| LPS | 26.72 | 1.24 | 0.44 | 2.19 | 1.61 | 4.13 | 39.68 |
| LPS + IMP | 25.79 | 1.52 | 0.49 | 2.43 | 1.91 | 3.69 | 38.58 |
| PA | 21.24 | 3.38 | 1.06 | 4.78 | 2.03 | 5.50 | 40.54 |
| PA + IMP | 26.63 | 3.11 | 0.86 | 3.99 | 1.80 | 5.41 | 44.43 |
| LPS + PA | 15.08 | 1.76 | 0.51 | 2.20 | 0.92 | 3.33 | 25.44 |
| LPS + PA + IMP | 24.50 | 2.21 | 0.65 | 2.82 | 1.26 | 4.67 | 38.51 |
The unit of the values is pmol/nmol Pi. IMP, imipramine. RAW264.7 cells were treated with 1 ng/ml LPS, 100 μM PA, or both LPS and PA in the presence or absence of 50 μM IMP for 12 h. After treatment, cells were harvested and subjected to the lipidomic analysis of SM, as described in materials and methods.
Table 5.
The effect of IMP on CER levels in cells treated with LPS, PA, or LPS + PA
| C16-CER | C18-CER | C20-CER | C22-CER | C24-CER | C24:1-CER | Total CER | |
|---|---|---|---|---|---|---|---|
| Control | 0.63 | 0.04 | 0.02 | 0.31 | 1.92 | 1.23 | 4.28 |
| Control+ IMP | 0.82 | 0.11 | 0.03 | 0.39 | 1.45 | 1.21 | 4.16 |
| LPS | 0.99 | 0.05 | 0.02 | 0.29 | 1.89 | 1.30 | 4.72 |
| LPS+IMP | 1.14 | 0.09 | 0.04 | 0.37 | 1.71 | 1.04 | 4.55 |
| PA | 1.30 | 0.24 | 0.14 | 1.32 | 1.70 | 1.13 | 6.00 |
| PA + IMP | 1.78 | 0.39 | 0.20 | 1.38 | 1.34 | 0.65 | 5.85 |
| LPS + PA | 4.15 | 1.05 | 0.56 | 3.05 | 2.89 | 2.33 | 14.57 |
| LPS + PA + IMP | 2.64 | 0.53 | 0.24 | 1.66 | 1.61 | 0.99 | 7.88 |
The unit of the values is pmol/nmol Pi. RAW 264.7 cells were treated with 1 ng/ml LPS, 100 μM PA, or both LPS and PA in the presence or absence of 50 μM IMP for 12 h. After treatment, cells were harvested and subjected to the lipidomic analysis of CERs, as described in materials and methods.
To further demonstrate the role of ASMase in the amplification of LPS-stimulated IL-6 secretion by PA, we inhibited ASMase expression using an RNA interference approach (Fig. 6B). Results showed that ASMase knockdown inhibited LPS-stimulated IL-6 secretion by 81% and LPS/PA-stimulated IL-6 secretion by 67% (Fig. 6C).
In contrast, GW-4869, the inhibitor for neutral SMase (43), had no effect on IL-6 secretion induced by LPS or LPS plus PA (data not shown). Results also showed that 10 μM myriocin, an inhibitor of SPT (39), and 250 μM of fumonisin B1, an inhibitor of CER synthase (CerS) (39), inhibited IL-6 secretion augmented by LPS plus PA by 12 and 25%, respectively (Fig. 6, D and E). Furthermore, results showed that myriocin, fumonisin, and IMP inhibited p65 nuclear translocation induced by LPS and PA (Fig. 6F), indicating that the inhibition of ceramide production plays an essential role in NF-κB activation.
LPS and PA have a cooperative effect on ASMase but not SPT activity.
The effect of LPS, PA, or LPS plus PA on ASMase and SPT activity was further determined. Results showed that whereas LPS or PA alone stimulated ASMase activity, the combination of LPS and PA further increased ASMase activity significantly (Fig. 7A). In contrast, although PA increased SPT activity slightly, LPS did not stimulate SPT activity, and LPS in combination with PA did not further increase SPT activity compared with PA alone (Fig. 7B).
Fig. 7.

The effect of LPS, PA, or LPS and PA on ASMase activity (A) and serine palmitoyl-CoA transferase (SPT) activity (B). Bars with different symbols in the bar graphs have significantly different values. A: RAW 264.7 cells were treated with 1 ng/ml LPS, 100 μM PA, or LPS and PA for 4 h. After the treatment, cells were lysed and cell lysates used for ASMase activity assay. * and +, #, or ★P < 0.01; ★ and + or #P < 0.01. B: RAW 264.7 cells were treated with 1 ng/ml LPS, 100 μM PA, or LPS and PA for 4 h. After the treatment, cells were collected for SPT activity assay. * and # or ★P < 0.05.
DISCUSSION
In the present study, we have focused on IL-6 because IL-6 is a key inflammatory cytokine involved in many diseases via its multiple functions (25, 29, 30). IL-6 increases matrix degradation by stimulating matrix metalloproteinase expression and promotes bone loss by increasing osteoclastogenesis and reducing osteoblast activity (34). IL-6 is promptly and highly responsive to inflammatory stimuli, as its expression rises rapidly and robustly and reaches the peak in a few hours (1). Clinical trials have shown that blockade of IL-6 action by the IL-6 receptor-specific monoclonal antibody tocilizumab is highly efficient for controlling not only the symptoms of rheumatoid arthritis but also inflammatory bone loss (11), confirming a critical role for IL-6 in inflammation and inflammation-related diseases.
Our present study showed that although low-level LPS (1 ng/ml) induced a small increase in IL-6 secretion by mouse macrophages, PA augmented this response fourfold. In addition to IL-6, PA augmented LPS-induced expression of a large number of TLR-related genes by an even larger extent (Table 1). For example, although PA and LPS alone increased mRNA expression of MCP-1, an important chemokine for inflammatory disease (10), 1.5- and 13.0-fold, respectively, the combination of PA and LPS led to a 281.9-fold increase, which is 22-fold of that induced by LPS alone. Similar robust increases were also found for CSF3 and cyclooxygenase (COX)-2, two key inflammatory regulators (22, 44). More intriguingly, whereas LPS alone did not significantly stimulate TNFα, IFNβ, or IFNγ (<2-fold), LPS in combination with PA markedly increased their expression by 8.3-, 11.3-, and 13.0-fold, respectively (Table 1). All of these data demonstrated clearly that PA is a potent amplifier for TLR4 signaling triggered by low-level LPS in macrophages.
Our data showed that, in the absence of LPS, PA alone was unable to stimulate IL-6 secretion despite its stimulated ASMase activity and increased CER production. This observation confirmed that PA did not engage TLR4. Furthermore, this observation along with the finding that PA increased CER production (Fig. 4) indicates that the level of the increase in CER production induced by PA alone is not sufficient to trigger signaling activation for IL-6 upregulation. It is likely that only when PA is combined with LPS in treatment, the CER production could reach to a threshold level necessary for NF-κB signaling activation, leading to IL-6 upregulaton.
Given that the content of PA in triglycerides is increased in patients with type 2 diabetes (52) and that TLR4 signal plays a crucial role in periodontal disease and other complications of type 2 diabetes, our current study has revealed a potential mechanism that may explain why periodontal disease is linked to dyslipidemia (4) and why intake of saturated fatty acids in patients with diabetes and metabolic disorders is associated with a chronic low-grade inflammation and development of insulin resistance (12, 27). The findings indicate that when accompanied by PA, LPS at low concentrations is capable of eliciting a strong inflammatory response in macrophages that play a key role in tissue inflammations and diabetic complications.
To understand how PA and LPS have a synergy on IL-6 expression, we focused on CER since it is known that uptake of PA increases cellular level of palmitoyl-CoA and subsequent CER production (13, 28), and increased CER level enhances LPS signaling (47). The findings from the present study have provided the following evidence that CER plays a crucial role in the augmentation of LPS-stimulated IL-6 expression by PA. First, our results showed that PA and LPS exerted a similar synergy on both IL-6 expression and CER production and a similar kinetics on both IL-6 expression and CER production (Figs. 2 and 4). Second, our results showed that blocking CER production by inhibitors of ASMase SPT and CerS significantly inhibited IL-6 expression (Fig. 6, A, D, and E). Third, the relationship between CER production and IL-6 expression was demonstrated further by the studies showing that IMP inhibited the synergy of PA and LPS on both CER production and IL-6 expression (Table 4 and Fig. 6A). All of these results indicate that the synergistic effect of PA and LPS on IL-6 upregulation is CER dependent.
Since it is known that PA increases CER de novo synthesis (13), whereas LPS stimulates SM hydrolysis that leads to CER production (9), we determined which mechanism plays a major role in IL-6 upregulation by PA and LPS. Our studies showed that the inhibition of ASMase with the pharmacological inhibitor and RNA interference inhibited LPS/PA-stimulated IL-6 secretion by 60 and 67%, respectively, whereas inhibition of de novo CER synthesis led to a 30% reduction of IL-6 upregulation, suggesting that although both ASMase-mediated SM hydrolysis and de novo CER synthesis are involved in the upregulation of IL-6 by LPS and PA, the former is the major mechanism. Furthermore, our study showed that LPS and PA had a synergistic effect on ASMase activity but not SPT activity (Fig. 7). Since the reaction catalyzed by SPT is a key step in the de novo biosynthesis of CERs (20, 24), this finding is consistent with the results from the inhibition studies (Fig. 6), indicating that ASMase-mediated SM hydrolysis, but not the CER de novo synthesis pathway, plays a major role in IL-6 upregulation by LPS and PA. A recent study by Chang et al. (6) showed that LPS upregulated mRNA expression of Sptlc2, a subunit of SPT, and protein level in RAW 264.7 cells. Another recent study by Schilling et al. (46) also demonstrated that PA and LPS synergistically induce de novo CER biosynthesis in mouse peritoneal macrophages. It is possible that the higher concentrations of LPS (1 and 50 ng/ml, respectively, applied in these 2 studies) may exert more impact with PA on the de novo CER biosynthesis, whereas the lower concentration of LPS (1 ng/ml) used in our current study and PA may influence more on SM hydrolysis. In supporting this notion, the studies by Chang et al. (6) and Memon et al. (37) have shown the concentration-dependent effect of LPS on the expression and activity of SPT that catalyzes the condensation of palmitate and serine to form 3-keto-dihydrosphingosine, a rate-limiting step in the CER de novo synthesis.
ASMase hydrolyzes SM to CER and phosphocholine and is located mainly in the endosomal/lysosomal compartments (38, 54). ASMase is not only important for sphingolipid homeostasis but is also involved in the cellular response to inflammatory mediators, as studies have shown that ASMase deficiency in mice is protective against the detrimental effects of LPS (19), TNFα (14), and CD95 (15). Further studies have shown that ASMase is regulated by LPS, TNFα, IL-1β, CD95, and γ-irradiation (54). Thus, it is likely that ASMase plays an important role in the pathogenesis of inflammation-related diseases. In line with these findings, our present study further demonstrated that ASMase was subjected to the regulation by not only LPS but also PA and mediated the stimulatory actions of LPS and PA on the expression of IL-6 and other genes important for the inflammatory response.
Another interesting finding from the present study is that LPS, PA, and the combination of LPS and PA exert different effects on SM hydrolysis and CER production. Results showed that LPS alone only slightly decreased the total SM by 7% (Tables 3) and increased CER production by 3% of control at 12 h (Table 2). Interestingly, although these data indicate that 1 ng/ml LPS alone has a very mild effect on the SM hydrolysis and CER production, results showed that IMP inhibited LPS-stimulated IL-6 secretion by 50% (Fig. 6A) and that ASMase knockdown by siRNA inhibited LPS-stimulated IL-6 secretion by 81% (Fig. 6C), suggesting that although the ASMase-mediated SM hydrolysis induced by LPS is moderate, it affects LPS-triggered inflammatory signaling considerably.
Table 3 showed that whereas LPS slightly reduced nearly all SM such as C16-, C18-, C22-, and C24:1-SM, PA selectively reduced C16-, C24-, and C24:1-SM but increased C18-, C20-, and C22-SM. Interestingly, Table 2 showed that PA increased not only C16-, C24-, and C24:1-CER but also C18-, C20-, and C22-CER at 12 h. Taken these data together, it is suggested that PA may increase the de novo synthesis of C18-, C20-, and C-22-CER and that the increase in these CERs leads to the increase in SM biosynthesis. Clearly, PA exerts its actions on both SM and CER metabolism, resulting in different effects on various SM or CER species.
Table 3 also showed that the combination of PA and LPS further enhanced PA-induced hydrolysis of C16-, C24-, and C24:1-SM but abolished PA-induced synthesis of C18-, C20-, and C22-SM, suggesting that the combination of PA and LPS enhances SM hydrolysis. To confirm that the ASMase was the major player for the action of the combination of PA and LPS, results showed that IMP treatment reversed the inhibitory effect of the combination of PA and LPS on the total SM level by 74% (Table 4), and IMP treatment reduced the stimulatory effect of the combination of PA and LPS on the total CER level by 65% (Table 5).
Taking all the results together, we proposed the mechanism whereby PA amplifies LPS signaling (Fig. 8); i.e., low concentration (1 ng/ml) of LPS initiates TLR4-mediated signals, including NF-κB cascade, leading to IL-6 upregulation. TLR4 activation by the low concentration of LPS also increases ASMase-mediated SM hydrolysis that enhances NF-κB-dependent IL-6 expression. PA has a synergy with LPS in the stimulation of ASMase, which induces a robust SM hydrolysis and subsequent CER production. On the other hand, PA increases CER production through the de novo synthesis pathway, which further increases cellular CER level. The markedly increased CER level enhances LPS-stimulated NF-κB signal and amplifies LPS-triggered upregulation of proinflammatory cytokines, including IL-6 in macrophages.
Fig. 8.
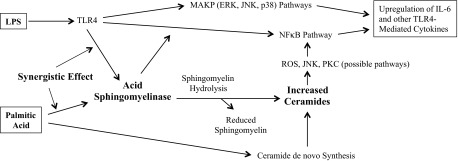
Schematic diagram to show the proposed mechanism involved in the upregulation of IL-6 expression in RAW 264.7 macrophages by LPS and PA. ROS, reactive oxygen species.
GRANTS
This work was supported by the Biomedical Laboratory Research and Development Program of the Department of Veterans Affairs and National Institutes of Health Grant DE-016353 (to Y. Huang) and Grant CA-97132 (to Y. A. Hannun). The work on sphingolipid analysis was supported in part by the Lipidomics Shared Resource, Hollings Cancer Center, Medical University of South Carolina (P30 CA138313), the Lipidomics Core in the SC Lipidomics and Pathobiology COBRE (P20 RR017677), and the National Center for Research Resources and the Office of the Director of the National Institutes of Health through Grant No. C06 RR-018823.
DISCLOSURES
The authors declare no competing financial interests.
AUTHOR CONTRIBUTIONS
J.J., X.Z., Z.L., S.B.R., and Y.L. performed the experiments; J.J., X.Z., Z.L., D.M.P., Y.L., L.A.C., Y.A.H., and Y.H. analyzed the data; J.J., X.Z., Z.L., D.M.P., L.A.C., Y.A.H., and Y.H. interpreted the results of the experiments; J.J. and Y.H. prepared the figures; D.M.P., Y.A.H., and Y.H. contributed to the conception and design of the research; Y.H. drafted the manuscript.
ACKNOWLEDGMENTS
Current Address of J. Jin: Laboratory of Liver-Biliary Tract-Pancreas Surgery, Affiliated Hospital of Guilin Medical University, Guangxi Key Laboratory of Molecular Medicine in Liver Injury and Repair, Guilin, 541001, Guangxi, China.
REFERENCES
- 1.Akira S, Kishimoto T. IL-6 and NF-IL6 in acute-phase response and viral infection. Immunol Rev 127: 25–50, 1992 [DOI] [PubMed] [Google Scholar]
- 2.Beutler B. TLR4 as the mammalian endotoxin sensor. Curr Top Microbiol Immunol 270: 109–120, 2002 [DOI] [PubMed] [Google Scholar]
- 3.Boden G. Obesity, insulin resistance and free fatty acids. Curr Opin Endocrinol Diabetes Obes 18: 139–143, 2011 [DOI] [PMC free article] [PubMed] [Google Scholar]
- 4.Bullon P, Morillo JM, Ramirez-Tortosa MC, Quiles JL, Newman HN, Battino M. Metabolic syndrome and periodontitis: is oxidative stress a common link? J Dent Res 88: 503–518, 2009 [DOI] [PubMed] [Google Scholar]
- 5.Chaffee BW, Weston SJ. Association between chronic periodontal disease and obesity: a systematic review and meta-analysis. J Periodontol 81: 1708–1724, 2010 [DOI] [PMC free article] [PubMed] [Google Scholar]
- 6.Chang ZQ, Lee SY, Kim HJ, Kim JR, Kim SJ, Hong IK, Oh BC, Choi CS, Goldberg IJ, Park TS. Endotoxin activates de novo sphingolipid biosynthesis via nuclear factor kappa B-mediated upregulation of Sptlc2. Prostaglandins Other Lipid Mediat 94: 44–52, 2011 [DOI] [PMC free article] [PubMed] [Google Scholar]
- 7.Cheng AM, Handa P, Tateya S, Schwartz J, Tang C, Mitra P, Oram JF, Chait A, Kim F. Apolipoprotein A-I attenuates palmitate-mediated NF-κB activation by reducing Toll-like receptor-4 recruitment into lipid rafts. PLoS One 7: e33917, 2012 [DOI] [PMC free article] [PubMed] [Google Scholar]
- 8.Cronin JG, Turner ML, Goetze L, Bryant CE, Sheldon IM. Toll-like receptor 4 and MYD88-dependent signaling mechanisms of the innate immune system are essential for the response to lipopolysaccharide by epithelial and stromal cells of the bovine endometrium. Biol Reprod 86: 51, 2012 [DOI] [PMC free article] [PubMed] [Google Scholar]
- 9.Cuschieri J, Bulger E, Billgrin J, Garcia I, Maier RV. Acid sphingomyelinase is required for lipid Raft TLR4 complex formation. Surg Infect (Larchmt) 8: 91–106, 2007 [DOI] [PubMed] [Google Scholar]
- 10.Deshmane SL, Kremlev S, Amini S, Sawaya BE. Monocyte chemoattractant protein-1 (MCP-1): an overview. J Interferon Cytokine Res 29: 313–326, 2009 [DOI] [PMC free article] [PubMed] [Google Scholar]
- 11.Fonseca JE, Santos MJ, Canhao H, Choy E. Interleukin-6 as a key player in systemic inflammation and joint destruction. Autoimmun Rev 8: 538–542, 2009 [DOI] [PubMed] [Google Scholar]
- 12.Funaki M. Saturated fatty acids and insulin resistance. J Med Invest 56: 88–92, 2009 [DOI] [PubMed] [Google Scholar]
- 13.Gao D, Pararasa C, Dunston CR, Bailey CJ, Griffiths HR. Palmitate promotes monocyte atherogenicity via de novo ceramide synthesis. Free Radic Biol Med 53: 796–806, 2012 [DOI] [PubMed] [Google Scholar]
- 14.García-Ruiz C, Colell A, Marí M, Morales A, Calvo M, Enrich C, Fernández-Checa JC. Defective TNF-alpha-mediated hepatocellular apoptosis and liver damage in acidic sphingomyelinase knockout mice. J Clin Invest 111: 197–208, 2003 [DOI] [PMC free article] [PubMed] [Google Scholar]
- 15.Grassme H, Cremesti A, Kolesnick R, Gulbins E. Ceramide-mediated clustering is required for CD95-DISC formation. Oncogene 22: 5457–5470, 2003 [DOI] [PubMed] [Google Scholar]
- 16.Green CD, Olson LK. Modulation of palmitate-induced endoplasmic reticulum stress and apoptosis in pancreatic β-cells by stearoyl-CoA desaturase and Elovl6. Am J Physiol Endocrinol Metab 300: E640–E649, 2011 [DOI] [PubMed] [Google Scholar]
- 17.Grill V, Qvigstad E. Fatty acids and insulin secretion. Br J Nutr 83, Suppl 1: S79–S84, 2000 [DOI] [PubMed] [Google Scholar]
- 18.Gupta S, Knight AG, Gupta S, Keller JN, Bruce-Keller AJ. Saturated long-chain fatty acids activate inflammatory signaling in astrocytes. J Neurochem 120: 1060–1071, 2012 [DOI] [PMC free article] [PubMed] [Google Scholar]
- 19.Haimovitz-Friedman A, Cordon-Cardo C, Bayoumy S, Garzotto M, McLoughlin M, Gallily R, Edwards CK, 3rd, Schuchman EH, Fuks Z, Kolesnick R. Lipopolysaccharide induces disseminated endothelial apoptosis requiring ceramide generation. J Exp Med 186: 1831–1841, 1997 [DOI] [PMC free article] [PubMed] [Google Scholar]
- 20.Hanada K. Serine palmitoyltransferase, a key enzyme of sphingolipid metabolism. Biochim Biophys Acta 1632: 16–30, 2003 [DOI] [PubMed] [Google Scholar]
- 21.Harte AL, Varma MC, Tripathi G, McGee KC, Al-Daghri NM, Al-Attas OS, Sabico S, O'Hare JP, Ceriello A, Saravanan P, Kumar S, McTernan PG. High fat intake leads to acute postprandial exposure to circulating endotoxin in type 2 diabetic subjects. Diabetes Care 35: 375–382, 2012 [DOI] [PMC free article] [PubMed] [Google Scholar]
- 22.Hartung T, von Aulock S, Wendel A. Role of granulocyte colony-stimulating factor in infection and inflammation. Med Microbiol Immunol 187: 61–69, 1998 [DOI] [PubMed] [Google Scholar]
- 23.He Q, Wang G, Dasgupta S, Dinkins M, Zhu G, Bieberich E. Characterization of an apical ceramide-enriched compartment regulating ciliogenesis. Mol Biol Cell 23: 3156–3166, 2012 [DOI] [PMC free article] [PubMed] [Google Scholar]
- 24.Hojjati MR, Li Z, Jiang XC. Serine palmitoyl-CoA transferase (SPT) deficiency and sphingolipid levels in mice. Biochim Biophys Acta 1737: 44–51, 2005 [DOI] [PubMed] [Google Scholar]
- 25.Ishihara K, Hirano T. IL-6 in autoimmune disease and chronic inflammatory proliferative disease. Cytokine Growth Factor Rev 13: 357–368, 2002 [DOI] [PubMed] [Google Scholar]
- 26.Jenkins GM, Cowart LA, Signorelli P, Pettus BJ, Chalfant CE, Hannun YA. Acute activation of de novo sphingolipid biosynthesis upon heat shock causes an accumulation of ceramide and subsequent dephosphorylation of SR proteins. J Biol Chem 277: 42572–42578, 2002 [DOI] [PubMed] [Google Scholar]
- 27.Kadotani A, Tsuchiya Y, Hatakeyama H, Katagiri H, Kanzaki M. Different impacts of saturated and unsaturated free fatty acids on COX-2 expression in C2C12 myotubes. Am J Physiol Endocrinol Metab 297: E1291–E1303, 2009 [DOI] [PubMed] [Google Scholar]
- 28.Kelpe CL, Moore PC, Parazzoli SD, Wicksteed B, Rhodes CJ, Poitout V. Palmitate inhibition of insulin gene expression is mediated at the transcriptional level via ceramide synthesis. J Biol Chem 278: 30015–30021, 2003 [DOI] [PubMed] [Google Scholar]
- 29.Kishimoto T. Interleukin-6: discovery of a pleiotropic cytokine. Arthritis Res Ther 8, Suppl 2: S2, 2006 [DOI] [PMC free article] [PubMed] [Google Scholar]
- 30.Kristiansen OP, Mandrup-Poulsen T. Interleukin-6 and diabetes: the good, the bad, or the indifferent? Diabetes 54, Suppl 2: S114–S124, 2005 [DOI] [PubMed] [Google Scholar]
- 31.Lakschevitz F, Aboodi G, Tenenbaum H, Glogauer M. Diabetes and periodontal diseases: interplay and links. Curr Diabetes Rev 7: 433–439, 2011 [DOI] [PubMed] [Google Scholar]
- 32.Lalla E, Lamster IB, Drury S, Fu C, Schmidt AM. Hyperglycemia, glycoxidation and receptor for advanced glycation endproducts: potential mechanisms underlying diabetic complications, including diabetes-associated periodontitis. Periodontology 2000 23: 50–62, 2000 [DOI] [PubMed] [Google Scholar]
- 33.Lassenius MI, Pietiläinen KH, Kaartinen K, Pussinen PJ, Syrjänen J, Forsblom C, Pörsti I, Rissanen A, Kaprio J, Mustonen J, Groop PH, Lehto M. Bacterial endotoxin activity in human serum is associated with dyslipidemia, insulin resistance, obesity, and chronic inflammation. Diabetes Care 34: 1809–1815, 2011 [DOI] [PMC free article] [PubMed] [Google Scholar]
- 34.Li Y, Samuvel DJ, Sundararaj KP, Lopes-Virella MF, Huang Y. IL-6 and high glucose synergistically upregulate MMP-1 expression by U937 mononuclear phagocytes via ERK1/2 and JNK pathways and c-Jun. J Cell Biochem 110: 248–259, 2010 [DOI] [PMC free article] [PubMed] [Google Scholar]
- 35.MacKichan ML, DeFranco AL. Role of ceramide in lipopolysaccharide (LPS)-induced signaling. LPS increases ceramide rather than acting as a structural homolog. J Biol Chem 274: 1767–1775, 1999 [DOI] [PubMed] [Google Scholar]
- 36.Mamputu JC, Renier G. Differentiation of human monocytes to monocyte-derived macrophages is associated with increased lipoprotein lipase-induced tumor necrosis factor-alpha expression and production: a process involving cell surface proteoglycans and protein kinase C. Arterioscler Thromb Vasc Biol 19: 1405–1411, 1999 [DOI] [PubMed] [Google Scholar]
- 37.Memon RA, Holleran WM, Moser AH, Seki T, Uchida Y, Fuller J, Shigenaga JK, Grunfeld C, Feingold KR. Endotoxin and cytokines increase hepatic sphingolipid biosynthesis and produce lipoproteins enriched in ceramides and sphingomyelin. Arterioscler Thromb Vasc Biol 18: 1257–1265, 1998 [DOI] [PubMed] [Google Scholar]
- 38.Mullen TD, Hannun YA, Obeid LM. Ceramide synthases at the centre of sphingolipid metabolism and biology. Biochem J 441: 789–802, 2012 [DOI] [PMC free article] [PubMed] [Google Scholar]
- 39.Mullen TD, Jenkins RW, Clarke CJ, Bielawski J, Hannun YA, Obeid LM. Ceramide synthase-dependent ceramide generation and programmed cell death: involvement of salvage pathway in regulating postmitochondrial events. J Biol Chem 286: 15929–15942, 2011 [DOI] [PMC free article] [PubMed] [Google Scholar]
- 40.Page RC. The etiology and pathogenesis of periodontitis. Compend Contin Educ Dent 23: 11–14, 2002 [PubMed] [Google Scholar]
- 41.Poggi M, Bastelica D, Gual P, Iglesias MA, Gremeaux T, Knauf C, Peiretti F, Verdier M, Juhan-Vague I, Tanti JF, Burcelin R, Alessi MC. C3H/HeJ mice carrying a toll-like receptor 4 mutation are protected against the development of insulin resistance in white adipose tissue in response to a high-fat diet. Diabetologia 50: 1267–1276, 2007 [DOI] [PubMed] [Google Scholar]
- 42.Qi HY, Daniels MP, Liu Y, Chen LY, Alsaaty S, Levine SJ, Shelhamer JH. A cytosolic phospholipase A2-initiated lipid mediator pathway induces autophagy in macrophages. J Immunol 187: 5286–5292, 2011 [DOI] [PMC free article] [PubMed] [Google Scholar]
- 43.Qin J, Berdyshev E, Poirer C, Schwartz NB, Dawson G. Neutral sphingomyelinase 2 deficiency increases hyaluronan synthesis by up-regulation of Hyaluronan synthase 2 through decreased ceramide production and activation of Akt. J Biol Chem 287: 13620–13632, 2012 [DOI] [PMC free article] [PubMed] [Google Scholar]
- 44.Rajakariar R, Yaqoob MM, Gilroy DW. COX-2 in inflammation and resolution. Mol Interv 6: 199–207, 2006 [DOI] [PubMed] [Google Scholar]
- 45.Rola-Pleszczynski M, Stankova J. Leukotriene B4 enhances interleukin-6 (IL-6) production and IL-6 messenger RNA accumulation in human monocytes in vitro: transcriptional and posttranscriptional mechanisms. Blood 80: 1004–1011, 1992 [PubMed] [Google Scholar]
- 46.Schilling JD, Machkovech HM, He L, Sidhu R, Fujiwara H, Weber K, Ory DS, Schaffer JE. Palmitate and LPS trigger synergistic ceramide production in primary macrophages. J Biol Chem 288: 2923–2932, 2012 [DOI] [PMC free article] [PubMed] [Google Scholar]
- 47.Schwartz EA, Zhang WY, Karnik SK, Borwege S, Anand VR, Laine PS, Su Y, Reaven PD. Nutrient modification of the innate immune response: a novel mechanism by which saturated fatty acids greatly amplify monocyte inflammation. Arterioscler Thromb Vasc Biol 30: 802–808, 2010 [DOI] [PubMed] [Google Scholar]
- 48.Seager Danciger J, Lutz M, Hama S, Cruz D, Castrillo A, Lazaro J, Phillips R, Premack B, Berliner J. Method for large scale isolation, culture and cryopreservation of human monocytes suitable for chemotaxis, cellular adhesion assays, macrophage and dendritic cell differentiation. J Immunol Methods 288: 123–134, 2004 [DOI] [PubMed] [Google Scholar]
- 49.Seong GJ, Hong S, Jung SA, Lee JJ, Lim E, Kim SJ, Lee JH. TGF-beta-induced interleukin-6 participates in transdifferentiation of human Tenon's fibroblasts to myofibroblasts. Mol Vis 15: 2123–2128, 2009 [PMC free article] [PubMed] [Google Scholar]
- 50.Shoelson SE, Lee J, Goldfine AB. Inflammation and insulin resistance. J Clin Invest 116: 1793–1801, 2006 [DOI] [PMC free article] [PubMed] [Google Scholar]
- 51.Spector AA. Fatty acid binding to plasma albumin. J Lipid Res 16: 165–179, 1975 [PubMed] [Google Scholar]
- 52.Stahlman M, Pham HT, Adiels M, Mitchell TW, Blanksby SJ, Fagerberg B, Ekroos K, Boren J. Clinical dyslipidaemia is associated with changes in the lipid composition and inflammatory properties of apolipoprotein-B-containing lipoproteins from women with type 2 diabetes. Diabetologia 55: 1156–1166, 2012 [DOI] [PubMed] [Google Scholar]
- 53.Van Veldhoven PP, Bell RM. Effect of harvesting methods, growth conditions and growth phase on diacylglycerol levels in cultured human adherent cells. Biochim Biophys Acta 959: 185–196, 1988 [DOI] [PubMed] [Google Scholar]
- 54.Zeidan YH, Hannun YA. The acid sphingomyelinase/ceramide pathway: biomedical significance and mechanisms of regulation. Curr Mol Med 10: 454–466, 2010 [DOI] [PubMed] [Google Scholar]