

Abstract
The mouse hind limb ischemia (HLI) model is well established for studying collateral vessel formation and testing therapies for peripheral arterial disease, but there is a lack of quantitative techniques for intravitally analyzing blood vessel structure and function. To address this need, non-invasive, quantitative optical imaging techniques were developed to assess the time-course of recovery in the mouse HLI model. Hyperspectral imaging and optical coherence tomography (OCT) were used to non-invasively image hemoglobin oxygen saturation and microvessel morphology plus blood flow, respectively, in the anesthetized mouse after induction of HLI. Hyperspectral imaging detected significant increases in hemoglobin saturation in the ischemic paw as early as 3 days after femoral artery ligation (P < 0.01), and significant increases in distal blood flow were first detected with OCT 14 days postsurgery (P < 0.01). Intravital OCT images of the adductor muscle vasculature revealed corkscrew collateral vessels characteristic of the arteriogenic response to HLI. The hyperspectral imaging and OCT data significantly correlated with each other and with laser Doppler perfusion imaging (LDPI) and tissue oxygenation sensor data (P < 0.01). However, OCT measurements acquired depth-resolved information and revealed more sustained flow deficits following surgery that may be masked by more superficial measurements (LDPI, hyperspectral imaging). Therefore, intravital OCT may provide a robust biomarker for the late stages of ischemic limb recovery. This work validates non-invasive acquisition of both functional and morphological data with hyperspectral imaging and OCT. Together, these techniques provide cardiovascular researchers an unprecedented and comprehensive view of the temporal dynamics of HLI recovery in living mice.
Keywords: peripheral arterial disease, hyperspectral imaging, optical coherence tomography, ischemia, intravital imaging
peripheral arterial disease (PAD) affects an estimated 8 million Americans and is associated with increased risk of myocardial infarction, stroke, and reduced quality of life (1, 40, 53). Development of novel PAD treatments that are less invasive and more effective than the current standard of care is a significant focus within basic and clinical cardiovascular research. Although promising results from preclinical studies have justified translation of pro-angiogenic therapies, recent clinical trials have yielded only mildly encouraging, insignificant trends toward improvement in secondary endpoints (17, 28, 31, 33, 38). There are several factors that may contribute to the disparity between successful preclinical studies and unsuccessful clinical trials. For example, novel therapeutic strategies are often evaluated with the mouse hind limb ischemia (HLI) model (6) in young and healthy animals, rather than in more relevant preclinical models (e.g., aged, diabetic, hypertensive mice) that are more time- and cost intensive to implement (17). Preclinical models are also typically assessed only in the early stages of HLI recovery, and very few experimental designs include time points to assess long-term stability of therapeutically stimulated neovasculature. However, this is a myopic strategy, since it has been recently shown that therapeutic angiogenesis treatments can induce unstable vessels that regress after cessation of treatment. Additionally, late-stage regression of vascular responses that occur immediately following induction of HLI is particularly prevalent in the challenged setting of diabetes (15, 26).
A key limitation to the use of more relevant models and carrying out more thorough temporal analyses during preclinical testing of pro-angiogenic therapies is the lack of quantitative, non-invasive techniques to monitor relevant physiological endpoints (e.g., microvascular density and perfusion, blood velocity, blood oxygenation) longitudinally in the same animal. Currently, it is standard to use a combination of intravital methods such as laser Doppler perfusion imaging (LDPI) (6, 41) and MRI angiography (21) and postmortem methods such as microcomputed tomography (micro-CT) (9–11) and histology (41) to study the effects of pro-angiogenic therapies over time. With this toolset, numerous cohorts of mice as well as access to and expertise in the use of multiple complementary instruments are required to complete a comprehensive, longitudinal analysis of the vascular response. This makes preclinical studies expensive and time-consuming. Providing the research community with enabling technologies for robust, standardized, and longitudinal measurements would catalyze new discoveries through better elucidation of the angiogenesis and arteriogenesis processes, more rapid screening of new therapeutic agents, and acceleration of the engineering of delivery systems (24, 50).
The objective of this study was to fulfill this unmet need through development and validation of an optical imaging approach that combines hyperspectral imaging with optical coherence tomography (OCT) to intravitally quantify blood oxygenation as well as vascular morphology and function as metrics of mouse ischemic limb recovery. Hyperspectral imaging can noninvasively provide superficial, spatially resolved maps of the hemoglobin oxygen saturation in vivo (46). This technique has never been used to assess preclinical models of HLI, but it has been successfully applied for other applications in mice (42, 46) and for assessment of blood circulation in diabetic patients (25). OCT is a complementary optical method that is ideal for obtaining structural and functional endpoints of the microvasculature over time. This three-dimensional (3D) imaging technique can nondestructively visualize structural features in tissue at cellular-level resolution with imaging depths of ∼1–3 mm (12, 51). The speed of OCT allows for image volumes to be collected quickly (∼2 × 2 × 2 mm volume in as little as 12 s) (47). Doppler OCT, a functional extension of OCT, images microvessel networks and blood flow velocities in 3D (20, 55) in humans (8, 37) and in preclinical models (16, 23, 43, 44).
In this study, a combination of hyperspectral imaging and OCT was used to quantitatively and longitudinally assess parameters related to HLI recovery. Hyperspectral data were used to quantify recovery of blood oxygenation at a site distal to femoral artery obstruction (paw). Doppler OCT techniques were applied to image formation of collateral vessels that bypass the site of arterial blockage and to measure restoration of blood flow in the femoral artery distal to the ligation sites. Together, hyperspectral imaging and OCT enable non-invasive acquisition of both functional and morphological measurements of recovery in the HLI model, providing new insight into the dynamics of vascular remodeling, perfusion, and oxygen delivery at multiple tissue depths and anatomical locations. The combined application of these non-invasive optical imaging modalities provides researchers with a new toolset to quantitatively and intravitally evaluate recovery from HLI, enabling more efficient preclinical development of improved PAD therapies.
MATERIALS AND METHODS
Animals.
Male, 8- to 10-wk-old A/J mice (Jackson Laboratories) were used in these studies. The animals were fed a standard chow diet ad libitum and had free access to water. All protocols were approved by the Institutional Animal Care and Use Committee of Vanderbilt University and done in accordance with the National Institutes of Health Guide for the Care and Use of Laboratory Animals.
HLI model.
HLI was surgically induced in 20 mice according to the well-established model of femoral artery ligation and transection (5, 6, 27). Surgery was carried out under 1.5–2.5% isoflurane anesthesia with the mice maintained at normal body temperature. After subcutaneous administration of pre-operative analgesia (ketoprofen, 10 mg/kg) and removal of hair, the surgical site was thoroughly cleansed with alternating iodine and chlorhexidine scrubs. A 5-mm unilateral incision was then made over the right medial thigh of the mouse. The femoral artery and vein were dissected away from the femoral nerve and were ligated with 6-0 silk sutures at two locations: immediately distal to the origins of the epigastric artery and deep branch of the femoral artery and ∼2 mm distal to the first ligation, proximal to the origin of the nearest distal branch. The artery and vein were transected between the two ligations, leaving a gap of 2 to 3 mm. The wound was irrigated with sterile saline, and the incision was closed with interrupted 5-0 nylon sutures. The contralateral limb served as the control for each animal. Analgesia (ketoprofen, 5–10 mg/kg) was administered subcutaneously every 18–24 h postoperatively for 72 h or until animals exhibited normal appearance and behavior.
Hyperspectral imaging system.
Two-dimensional diffuse reflectance images were collected with a 200 W halogen lamp coupled into a 10-mm core diameter liquid light guide for epi-illumination. The collection head consisted of a Varispec VIS-20 liquid-crystal tunable filter (LCTF) for bandlimited optical filtering (CRI, Inc.), a variable focal length (f = 28–80 mm) camera lens (Nikon), and a 512 × 512 pixel PhotonMax charge-coupled device (CCD) camera (Princeton Instruments), resulting in a sampling density of 58 μm (schematic in Fig. 1A). The LCTF tuning, CCD camera communication, shutter control, and data handling were controlled with a custom C-based computer program with graphic user interface controls from the Fast Light Toolkit (13).
Fig. 1.

Hyperspectral imaging system. A: hyperspectral system for diffuse reflectance imaging. White light from the halogen lamp is coupled into a liquid light guide for illumination of the footpads. Specific wavelengths are collected with a liquid crystal tunable filter (LCTF) mounted on the end of a variable focal length (f = 28–80 mm) camera lens and a 512 × 512 pixel charge-coupled device (CCD) camera. B: hyperspectral quantification of hemoglobin oxygen saturation was validated in vitro in glass capillary tubes with whole blood diluted with phosphate-buffered saline at pH 7.4.
Hyperspectral imaging validation.
To obtain calibrated hemoglobin absorption spectra for the hyperspectral imaging system, oxyhemoglobin and deoxyhemoglobin solutions were prepared from red blood cells obtained from mouse whole blood collected from anesthetized mice via cardiac puncture with a heparinized needle. After lysis of the red blood cells, the hemolysate was diluted 1:10 with Dulbecco's phosphate-buffered saline (DPBS; Gibco). An aliquot of the solution was inverted repeatedly in room air to prepare an oxygenated hemoglobin solution, and a deoxygenated hemoglobin solution was prepared by adding 5% wt/vol sodium dithionite (Sigma-Aldrich) to a separate aliquot. Glass capillary tubes with an inner diameter of 1 mm were filled with the oxygenated and deoxygenated hemoglobin solutions, sealed on the ends, and submerged in index-matching immersion oil on a glass slide. A diffuse reflectance standard (Spectralon) was placed below the glass slide to provide total reflection in areas where light was not absorbed by hemoglobin. The measured spectra for oxyhemoglobin and deoxyhemoglobin were corrected for the dark offset and the lamp spectrum. Repeated measures of oxy- and deoxyhemoglobin solutions yielded similar spectra (n = 3). These calibrated hemoglobin absorption spectra were then used to fit measured absorption spectra for mouse whole blood at 100% and 0% (treated with 5% wt/vol sodium dithionite) oxygenation in vitro to validate quantification of hemoglobin oxygen saturation. Blood gas measurements were performed on parallel samples prepared in the same way to verify that the Po2 values in each solution were sufficiently high or low enough to assume the mouse whole blood was 100% or 0% oxygenated, respectively. Hemoglobin saturation images for whole blood were calculated from hyperspectral data (500 to 620 nm in 10-nm increments) by using a model derived from an extension of the Beer-Lambert law (34, 42, 46). The model calculates the hemoglobin saturation in each pixel by fitting the measured spectra to the calibrated spectra for oxy- and deoxyhemoglobin, using linear least-squares regression (34, 42, 46). Oxygenated and deoxygenated hemoglobin were assumed to be the dominant factors contributing to absorption in this model. The measured saturation of 100% and 0% oxygenated blood was 99.9% ± 0.3% and 6.7% ± 3.5%, respectively (Fig. 1B), thus validating the accuracy of the system.
Hyperspectral imaging.
Immediately after surgery (day 0) and at 3, 7, 14, and 21 days postsurgery, control and ischemic footpads were imaged non-invasively through the skin with hyperspectral imaging (500 to 620 nm in 10-nm increments). Hyperspectral images can be collected at any location, but in this study the footpads were selected as the site of interest since the most severe ischemia/hypoxia occurs in the distal limb in this model (27). All imaging was carried out under 1% to 2% isoflurane anesthesia with the mice maintained at normal body temperature with a circulating water heating pad. Anesthesia was delivered with 21% oxygen rather than 100% oxygen to avoid artificial elevation of normal hemoglobin saturation. Measurements of the dark offset and reflectance from a diffuse reflectance standard (Spectralon) were made before each imaging session. Hemoglobin saturation images were calculated as described above, providing two-dimensional spatial maps of hemoglobin oxygen saturation that have not been previously obtained in this model. For in vivo image processing, the effective attenuation coefficient (Eq. 1) for skin at each wavelength was incorporated into a modified version of the Beer-Lambert law (Eq. 2) to account for attenuation due to nonhemoglobin absorption and scattering effects (34, 42, 46):
| (Eq.1) |
| (Eq.2) |
where μeff is the effective attenuation coefficient calculated for representative skin optical properties (absorption coefficient μa and reduced scattering coefficient μs′) as a function of wavelength (22), A(λ) is the absolute tissue attenuation, b0 is a constant term accounting for overall changes in signal, b1 is a free parameter modulating the magnitude of the μeff(λ) term, εi(λ) is the extinction coefficient of the ith absorber as a function of wavelength (in this case, oxygenated and deoxygenated hemoglobin), and Ci is a composite term that is the product of the concentration and path length of light attenuated by each absorber (34). For quantitative analysis of hemoglobin saturation images, regions of interest (ROI) in each image were defined by outlining the footpads using ImageJ software. Absolute hemoglobin saturation values were quantified for each footpad by averaging the values for all pixels contained within the ROI. The ratio of the hemoglobin saturation in the ischemic footpad to that in the control footpad was also computed to serve as an endpoint that is analogous to the quantification typically done with LDPI.
LDPI.
After hyperspectral imaging, perfusion in the footpads was measured by LDPI (6, 41) (Perimed) at 0, 3, 7, 14, and 21 days postsurgery under isoflurane anesthesia and normal body temperature maintained with a circulating water heating pad. The ambient light was consistent across all imaging days. For analysis of perfusion data sets, ROIs in each image were defined by outlining the footpads. Perfusion values were obtained for each footpad by averaging the values for all pixels contained within the ROI. Because LDPI is an intrinsically semiquantitative and relative measurement, perfusion images were quantified as a ratio of the average perfusion value of the ischemic footpad to that of the control footpad.
OxyLite Po2 measurements.
Tissue oxygen tension (Po2) was measured in the footpads of five mice under isoflurane anesthesia and maintained at normal body temperature at 0, 3, 7, 14, and 20 days postsurgery using the commercially available fiber-optic OxyLite (Oxford Optronix) tissue oxygenation sensor. To measure oxygen tension, the probe tip was inserted into the superficial region of the footpad at a depth of ∼1 mm with a needle, and pulses of LED light were transmitted along the fiber optic probe to excite a platinum-based fluorophore enclosed within a silicone matrix at the tip. The fluorescent light is quenched in the presence of oxygen, and the instrument detects the fluorescence lifetime, which is inversely proportional to the concentration of dissolved oxygen. This value is used to calculate the absolute value of Po2 in millimeters of mercury. The OxyLite system simultaneously corrects for temperature effects with an integrated temperature probe that provides the mouse core temperature during measurements. For this study, measurements were taken in two locations on each footpad. After insertion of the probe, the Po2 reading was allowed to stabilize for 10–15 min. Once the reading stabilized, seven measurements were recorded over 30 s to obtain an average Po2 value. Data were collected from two locations on the footpad, and the two values were averaged to provide a single value for each footpad. The Po2 data were analyzed as both absolute values in millimeters of mercury and as ratios of the ischemic footpad to the control footpad.
OCT.
A spectral domain OCT system (Bioptigen) with 25 μm lateral resolution and an 860 nm center wavelength, 51 nm bandwidth superluminescent diode (SLD) source (6.4 μm axial resolution in air) was used (Fig. 2A). The SLD light is fiber coupled and split between a reference mirror and the sample arm using a 50/50 fiber coupler, while X-Y galvos in the sample arm perform lateral scanning. An aiming beam (642 nm) was also used to facilitate positioning of the hind limb at the sample arm of the OCT system. Returning interference light is sent through an 860-nm center wavelength circulator to a spectrometer with a 2,048 pixel line scan CCD (Atmel-AViiVA SM2). Before in vivo imaging of blood flow, Doppler OCT flow rate measurements were validated in an Intralipid flow phantom controlled with a syringe pump (Fig. 2B). The displacement sensitivity of the OCT system is ∼6 nm, resulting in theoretical minimum and maximum detectable velocities (2, 45) of 0.08 mm/s and 11.6 mm/s, respectively, for an 80-μs integration time and a range of Doppler angles. This sensitivity is in line with other OCT blood flow detection techniques reported in literature (2, 30).
Fig. 2.

Optical coherence tomography (OCT) system. A: spectral domain OCT system used for imaging, which includes a superluminescent diode (SLD) source centered at 860 nm with a 51-nm bandwidth. B: measurement of flow rate with Doppler OCT was validated with an Intralipid phantom experiment for a range of flow rates controlled with a syringe pump. Cross-sectional flow profiles were fit to a second-order polynomial, assuming parabolic flow. The Doppler OCT-measured flow rate was calculated using the average velocity (half of maximum velocity) and the cross-sectional area of the capillary tube.
For the HLI study, two-dimensional B-scans and three-dimensional C-scan volumes of Doppler OCT data were collected from two locations on each hind limb (ischemic and contralateral) for mice (n = 8) on days 0, 3, 7, 14, and 21 after surgery under isoflurane anesthesia and normal body temperature. During imaging, a thin layer of water-based index matching agent containing glycerin was applied to the skin and a glass cover slip was secured over the area to reduce bulk motion. Doppler B-scans spanning 4 mm in length were acquired with an 80 μs integration time per A-line (axial scan), 800 A-lines/B-scan (cross-sectional image), and a Doppler number of 8 (n = 9 repeated A-lines), resulting in a frame rate of 1.7 frames/s for Doppler B-scans. Repeated B-scans were collected in each area to allow for temporal averaging and reduction in noise. For 3 mm by 3 mm speckle variance OCT volume scans (“C-scans”), an 80 μs integration time per A-line, 200 A-lines/B-scan, 200 B-scans/C-scan, and a Doppler number of 6 (n = 7 repeated A-lines) were used, resulting in a total volume acquisition time of 22.4 s. OCT was evaluated in regions located proximally on the limb relative to the hyperspectral imaging site, because the adductor muscle of the thigh is where the arteriogenic collateral vessels form that are considered to be the most efficient mechanism for restoring flow to the limb (41). The first imaging site (area 1) contained segments of the femoral artery and vein distal to the ligation site and proximal to the popliteal/saphenous bifurcation. This region was selected to monitor restoration of blood flow over time as a biomarker for formation of functional vascular anastomoses that bypass the more proximal site of femoral artery obstruction. The second area (area 2) was located in the adductor muscle region medial to the site of femoral artery resection and was chosen to directly monitor changes in the morphology and blood flow signal in anastomotic collateral vessels. Each limb was permanently marked with tattoo ink to provide fiducial markers on the skin, facilitating alignment of the OCT beam at the defined areas at each time point. All OCT imaging was performed non-invasively through the skin, and longitudinal measurements were taken from the same set of mice, which is unique relative to any other intravital OCT imaging previously accomplished with the HLI model.
Doppler OCT B-scans containing cross-sectional images of the femoral artery and vein were processed to reduce speckle noise and bulk motion artifact. Phase noise due to signal fall-off with depth in the tissue was excluded by a threshold in the corresponding structural image, and the bulk motion artifact due to respiration was reduced using a histogram-based correction method (29). The resulting tissue depth for which data was included for further processing was 0.92 ± 0.11 mm (mean ± SD) from the surface of the skin. After this processing, the repeated B-scans from the same location were averaged temporally, and then a Doppler signal threshold was computed for each limb at each time point from a region of static tissue (skin) to further separate blood flow detection from background noise. Pixels with a Doppler signal greater than the threshold were summed across the cross-sectional images and divided by the total pixel area to define a vascular index for blood flow (including all arterial and venous vessels combined) in the detected vasculature (48). The vascular index ratio is defined as the ratio of the vascular index in the ischemic limb to that in the control limb. It should be noted that that because Doppler OCT measures the velocity component that is parallel to the incident laser beam, the vascular index is Doppler-angle dependent. It is possible to underestimate total flow with this angle-dependent measurement, and vessels with high flow velocity can go undetected. We hypothesized that the femoral artery would have the highest flow rate in these images, and because Doppler signal was observed throughout the femoral artery in all of the quantified images, we do not believe that angle dependency had a significant effect on our flow index calculation.
To visualize projection images of the vasculature at the distal femoral artery and adductor muscle regions, volume data sets were processed with a speckle variance technique that computes the variance in each pixel over seven repeated A-lines at each lateral position (30). The resulting speckle variance images represent OCT flow signal for perfused vessels within the imaged volume. Noise due to signal fall-off was excluded by thresholding the corresponding structural images to create a mask, and an average signal projection over the depth (∼1 mm) of the speckle variance OCT data was used to visualize all vessels present in the volume.
Correlations between techniques.
The relationships between LDPI and our non-invasive optical techniques were tested with the Pearson's correlation coefficient (36) for the pooled data consisting of LDPI, hyperspectral imaging, and OCT measurements performed on the same animals, allowing for robust comparisons between techniques. Because the OxyLite probe was introduced with a needle, a cutaneous wound was created that affected LDPI and hyperspectral imaging data. Thus a separate cohort of mice was used to obtain OxyLite Po2 measurements for comparison, and mean values were used to obtain the Pearson's correlation coefficient between hemoglobin oxygen saturation measured with hyperspectral imaging and tissue Po2 measured with the OxyLite probe.
Statistical analysis.
All data are presented as means ± SE. Paired Wilcoxon Signed-Rank statistics were computed using MATLAB software (MathWorks) for comparisons between ischemic and control limb measurements within each animal for each time point. The effect of time postsurgery on the response variables within each animal was tested with the paired Wilcoxon Signed-Rank test followed by a Bonferroni correction for multiple comparisons. Pearson's correlation coefficients were used to compare hyperspectral imaging and OCT endpoints to each other and to LDPI and OxyLite Po2 endpoints. P < 0.05 was interpreted as significant.
RESULTS
Measures of vascular structure and function following induction of HLI were obtained using optical imaging methods (hyperspectral imaging and optical coherence tomography) and were compared with traditional methods of evaluating the mouse HLI model (LDPI and tissue oxygen tension).
LDPI measurement of paw perfusion.
LDPI-based perfusion in the footpads was analyzed in the same animals for which hyperspectral imaging and OCT data were collected. The ischemic-to-control perfusion ratio was severely reduced at day 0 as shown by a representative perfusion image (Fig. 3A), then increased significantly beginning at day 7 until perfusion was completely recovered in the ischemic limb by day 21 (Fig. 3B). Significant increases in the ratio were observed between days 3 and 7, days 7 and 14, and days 14 and 21 postsurgery (P < 0.05).
Fig. 3.

Measurements with laser Doppler perfusion imaging (LDPI) and the OxyLite tissue oxygen tension sensor confirm time course of recovery in ischemic limb. A: representative LDPI image of ischemic (bottom) and control (top) footpads immediately postsurgery. The white “x” indicates the approximate location of the distal ligation site. B: LDPI ratios demonstrate full recovery of perfusion in the ischemic footpad relative to the control footpad by day 21 (means ± SE with n = 15). C: absolute Po2 values from control and ischemic footpads measured with the OxyLite system (means ± SE with n = 5). D: individual animal ratios (ischemic Po2 normalized to mean control Po2 for each animal) plotted with lines representing mean ratio ± SE at each time point. *One-sided P < 0.05 and **P < 0.01 as determined by a Wilcoxon Signed-Rank test (B–D) followed by a Bonferroni correction for multiple comparisons (B, D) with respect to the corresponding control measurement (C) or the preceding time point (B, D).
Fiber-optic probe sensor measurement of paw tissue oxygen tension.
Tissue Po2 in the footpads measured with the OxyLite sensor showed significant differences between the control and ischemic footpads on days 0 through 7 (Fig. 3C). However, there was large standard deviation in the ischemic-to-control footpad ratio on days 7 through 20 (Fig. 3D). Figure 4 illustrates the variability between control footpad measurements taken at two different locations in each foot and also highlights the lack of reliability of the OxyLite system to measure normoxic Po2 levels (greater than 10 mmHg). Because the dynamic range of the OxyLite is better aligned with measurement of Po2 in ischemic tissues, the data recorded in the ischemic footpad at early time points (days 0 and 3) was less variable than at later time points (Fig. 4).
Fig. 4.
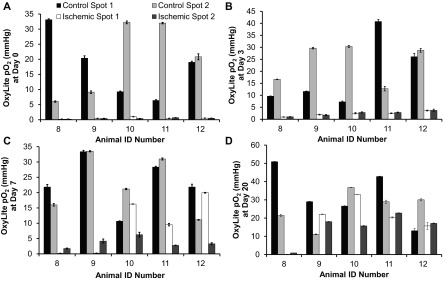
OxyLite measurements are variable at normal tissue Po2 levels. OxyLite tissue oxygenation sensor measurements are more precise at low tissue Po2 and show high spatial variability at normal Po2 levels. Tissue Po2 data are shown from each animal for 2 locations on each footpad at day 0 (A), day 3 (B), day 7 (C), and day 20 (D). Data presented as means ± SD of 7 readings in each location collected over 30 s.
Hyperspectral imaging of paw hemoglobin oxygen saturation.
We used an LCTF-based hyperspectral imaging system to non-invasively acquire quantitative hemoglobin saturation measurements on the hind feet of mice after unilateral induction of ischemia. This method provides an absolute measurement and yields a value integrated over the entire footpad, unlike semiquantitative LDPI and invasive probe-based Po2 techniques. Analysis of hemoglobin saturation images (representative images, Fig. 5, A and B) revealed a significant reduction in oxygenation of the ischemic footpad relative to contralateral controls from day 0 through day 7 postsurgery (Fig. 5C). Normalized data (ischemic/control) shows that hemoglobin saturation in the ischemic footpad was reduced to ∼40% of the control immediately following surgery (Fig. 5D) and that the ratio increased significantly at each subsequent time point relative to the prior time point (3 vs. 0, 7 vs. 3, 14 vs. 7, and 21 vs. 14) (P < 0.05). The hemoglobin saturation ratio fully recovered by day 21. Because hyperspectral imaging acquires a two-dimensional image rather than a point measurement like the OxyLite system, we were able to obtain the distribution of hemoglobin oxygen saturation across all of the pixels within the footpad in addition to quantifying the mean value over the entire footpad (Fig. 6). The distribution peak is shifted toward zero in the ischemic footpad upon induction of ischemia, and the variance (s2) in hemoglobin saturation values differed significantly between the ischemic and control footpads at days 0 (P < 0.05), 7 (P < 0.05), and 14 (P < 0.001). The distribution of pixel values within hyperspectral images of the ischemic footpad shifts over time and is similar to the control footpad distribution by day 21 (P = 0.096).
Fig. 5.

Hemoglobin oxygen saturation measured with hyperspectral imaging resolves ischemic recovery in the footpad. Representative hemoglobin saturation images of the ischemic (top) and control (bottom) footpads at day 0 after surgery (A) and at 21 days postsurgery (B) are shown. C: absolute hemoglobin saturation was quantified as the mean of all pixels within each footpad. Significant differences existed between the ischemic and control footpads at days 0, 3, and 7. D: data normalized to the control footpad demonstrated complete recovery from hypoxia in the ischemic footpad relative to the control footpad with significant increases in the ratio between successive time points. Data are presented as means ± SE with n = 15. *P < 0.05, **P < 0.01, and ***P < 0.001 as determined with a Wilcoxon Signed-Rank test (C and D) and a Bonferroni correction for multiple comparisons (D) with respect to the corresponding control measurement (C) or the preceding time point (D).
Fig. 6.

Average histograms of hemoglobin oxygen saturation in the control and ischemic footpads show the distribution of hemoglobin saturation over all pixels within the regions of interest (ROIs) of all n = 15 animals. Histograms of hemoglobin saturation were generated from all pixels within the control and ischemic footpads and normalized to the ROI pixel area at day 0 (A), day 7 (B), day 14 (C), and day 21 (D) postsurgery. The distribution of hemoglobin saturation values is shifted toward 0 in the early time points for the ischemic footpad. This is followed by shifting of the peak to overlap with the control footpad data by day 14. The variance of hemoglobin saturation values within each footpad (average of n = 15 animals) is indicated by s2 above each histogram. The variance of the ischemic footpad differed significantly from that of the control footpad at days 0, 7, and 14. *P < 0.05 and ***P < 0.001 as determined with a Wilcoxon Signed-Rank test with respect to the corresponding control measurement.
OCT vascular imaging and blood flow measurement.
OCT provides quantitative, three-dimensional, structure-function information that is complementary to the blood oxygenation measurements acquired with hyperspectral imaging. Here, images of newly recruited collateral vessels in the adductor region (speckle variance OCT) and functional blood flow measurements in the distal femoral artery region (Doppler OCT) were both acquired non-invasively through the skin of the ischemic and control hind limbs.
Average intensity projections of speckle variance OCT images of the ischemic hind limb revealed restoration of blood flow in the femoral artery region distal to the ligation site (area 1) and visible recruitment of collateral vessels in the adductor region (area 2) over time (Fig. 7). Representative images of area 1 at day 0 from the control (Fig. 7Ai) and ischemic (Fig. 7Aii–iv) limbs showed that anatomical images of the vasculature in the control limb could be resolved (Fig. 7Ai) and that the OCT flow signal was absent immediately following HLI surgery (Fig. 7Aii). Images from the same animal at days 14 and 21 postsurgery showed re-appearance of blood flow in the ischemic limb at this site (Fig. 7A, iii and iv). Small pre-existing arterioles were visible in the adductor muscle (area 2) of both the control and ischemic limbs at day 0 (Fig. 7B, i and ii). By day 7, there was evidence of arteriogenic collateral recruitment based on appearance of new, larger vessels with increased OCT flow signal that were more clearly resolved than the small arterioles present in the same region at day 0 in the same animal (Fig. 7Biii). Vessels with corkscrew morphology characteristic of remodeling collateral vessels (41) were present at 7 and 14 days postsurgery (arrowheads, Fig. 7B, iii and iv).
Fig. 7.
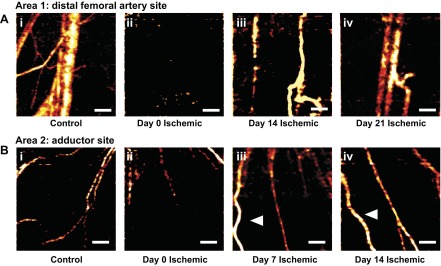
Speckle variance OCT volumes noninvasively illustrate reperfusion and collateral vessel formation in vivo. A: representative speckle variance OCT average intensity projections containing the distal femoral artery and vein in area 1 (i) in a control limb and in an ischemic limb of the same animal at day 0 (ii), day 14 (iii), and day 21 (iv). B: representative speckle variance OCT average intensity projections containing collateral vessels in the adductor muscle in area 2 (i) in a control limb and in an ischemic limb of 1 animal at day 0 (ii), day 7 (iii), and day 14 (iv). White arrowheads indicate collateral vessels with corkscrew morphology. All images collected through the skin; scale bars = 500 μm.
Color-coded Doppler OCT images were overlaid onto structural OCT images at day 0 for area 1 (cross section over femoral artery/vein distal to the site of femoral artery resection and just proximal to the popliteal bifurcation). These images illustrated the presence of perfusion in the femoral artery (red) and vein (blue) in the control limb, whereas there was no Doppler OCT signal from these vessels in the ischemic limb immediately after surgery (Fig. 8, A and B). The corresponding structural OCT image provided confirmation that the vessels were located within the scanned area (Fig. 8B). The Doppler OCT vascular index in area 1, which includes smaller vessels located near the obstructed femoral artery and vein, was reduced to ∼30% of the contralateral control limb at day 0 (Fig. 8D). Recovery of functional blood flow in this region was delayed relative to recovery as measured by hyperspectral imaging and other gold standard methods, showing no significant increase at days 3 or 7 relative to measurements taken immediately postsurgery. However, by weeks 2 and 3 postsurgery, perfusion at this distal site increased significantly in the ischemic limb (Fig. 8, C and D), with significant increases in the vascular index ratio at days 14 and 21 with respect to the preceding time point (P < 0.01).
Fig. 8.

Perfusion measured with Doppler OCT resolves ischemic recovery in the hind limb distal to vessel occlusion. A: representative Doppler OCT B-scan of distal femoral artery (red) and vein (blue) in area 1 (see materials and methods) imaged through the skin in a control limb, ischemic limb at day 0 (D0) postsurgery with occluded vessels indicated with black arrows (B), and ischemic limb at day 21 (D21) postsurgery (C). Color Doppler OCT data are overlaid onto corresponding grayscale OCT intensity images. D: quantification of perfusion from the Doppler OCT vascular index ratio shows recovery of perfusion in these vessels at weeks 2 and 3 postsurgery. Data are presented as means ± SE with n = 8. **P < 0.01.
Correlations between hyperspectral imaging, OCT, and gold standard techniques.
The relationships between standard methods and our noninvasive optical techniques were tested across all animals and time points, to define these new optical methods in the context of existing methods used to assess recovery in the mouse HLI model. The hemoglobin oxygen saturation ratio measured with hyperspectral imaging positively correlated with both LDPI-measured perfusion and OxyLite-measured tissue oxygen tension ratios with Pearson's correlation coefficients (r) of 0.74 and 0.97, respectively (Fig. 9, A and B). Although the Doppler OCT vascular index ratio appeared to better measure a later stage of recovery relative to the other techniques, it did positively correlate with LDPI perfusion and hemoglobin oxygen saturation ratios with correlation coefficients of 0.63 and 0.56, respectively (Fig. 9, C and D). All correlations are statistically significant (P < 0.01). The interanimal variability observed with each technique is illustrated by plots of the longitudinal responses of individual animals in Fig. 10.
Fig. 9.

Vascular endpoints in the hind limb ischemia (HLI) model are positively correlated and exhibit differences in time rate of recovery due to measurement of distinct physiological processes. Correlations between hyperspectral imaging measurement of hemoglobin oxygen saturation (HbSat) and LDPI perfusion (A) and OxyLite Po2 ratios (B) and between the Doppler OCT vascular index and LDPI perfusion (C) and HbSat ratios (D) are shown. In A, C, and D, the data include measurements from all mice at all time points. In B, mean values for each time point are compared since the invasiveness of the OxyLite sensor necessitated the use of a separate cohort of mice. The Pearson correlation coefficients for all 4 comparisons are significant (P < 0.01).
Fig. 10.

Interanimal variability is smallest in hyperspectral imaging and largest in OxyLite Po2 measurements. Hyperspectral imaging of hemoglobin oxygen saturation shows more consistent trends across all animals measured than both LDPI perfusion and OxyLite Po2 measurements in this model. A: hemoglobin saturation ratio data for n = 15 animals over 21 days shows a consistent increasing trend. B: LDPI perfusion ratio data for n = 15 animals over 21 days shows an increasing trend with high interanimal variation. C: OxyLite Po2 ratio data for n = 5 animals over 20 days is highly variable and lacks a consistent increasing or decreasing trend across all animals. D: Doppler OCT vascular index ratios for n = 8 animals show interanimal variability in the recovery of blood flow through vessels in the distal femoral artery region (area 1) and a slower temporal response, indicating that the greater imaging depth of OCT provides insight into residual flow deficits not detectable by the superficial measurements obtained with hyperspectral imaging, LDPI, and OxyLite Po2. This may represent a useful metric for analysis of the later stages of recovery. The average standard error over the time course is indicated by SEMavg for each technique.
DISCUSSION
The mouse HLI model is used extensively for preclinical studies of postnatal blood vessel formation and testing the efficacy of new therapies for PAD, but no single methodology currently used in this model provides multifunctional, quantitative information from the living mouse. The current standard approach, a combination of intravital (LDPI and MRI) and postmortem (micro-CT, angiography, histology) techniques, to evaluate the vascular response over time is expensive and time consuming. Based on this toolset, researchers are disincentivized against completing more physiologically relevant and thorough analyses because these techniques require a separate cohort of mice for each time point, time-consuming postmortem tissue preparations, and multiple methodologies for evaluation (17). Therefore, the ability to identify and quantify robust biomarkers for angiogenesis and arteriogenesis and measure these endpoints repeatedly in a given animal provides valuable longitudinal data to complement traditional endpoints. This could significantly accelerate and improve the development of novel therapeutics for PAD.
The current study validates a new approach that combines hyperspectral imaging and OCT for intravital acquisition of comprehensive vascular structure and function information in the mouse HLI model. Hyperspectral and OCT images from the HLI model revealed previously inaccessible insights into the dynamic changes of physiological endpoints at different tissue sites. Hemoglobin oxygen saturation and LDPI perfusion, both measured superficially in the footpads, have the strongest correlation within a single cohort of mice (Fig. 9A). However, hemoglobin saturation is recovered more rapidly in the first week with a significant increase in the ischemic-to-control ratio at day 3 (Fig. 5D). Hemoglobin oxygen saturation is also less severely reduced and recovered more rapidly than tissue Po2 measured with the OxyLite sensor (Fig. 9B). All three of these endpoints (hemoglobin saturation, Po2, and LDPI perfusion) were measured superficially in a distal site of ischemia, the footpad, but the temporal differences observed between techniques suggests that they qualify as distinct physiological endpoints rather than being linearly correlated with each other. In addition to correlation with the LDPI and OxyLite Po2 measurements performed in this study, the absolute hemoglobin oxygen saturation values measured by hyperspectral imaging of the control and ischemic footpads are similar to published data acquired with volume-averaged diffuse optical spectroscopy measures (32).
Hyperspectral imaging overcomes some limitations of current gold standards (LDPI and OxyLite Po2 measurements). The Po2 measurement technique was used as a comparison because of its similarity to the hyperspectral imaging endpoint of hemoglobin oxygen saturation, but its invasiveness further limits the potential usefulness of this technique for the HLI model. Interpretation of OxyLite Po2 measurements is limited by the high interanimal (Figs. 3D, 4, and 10C) and intra-animal (Fig. 4) variability, which is likely attributed to the small sampling area (0.038 mm2) (3) and decreased accuracy at normoxic Po2 levels. Our observations of significant variations in Po2 measurements in tissues at normoxic Po2 levels with the OxyLite system are aligned with published results (35). Previous papers have also noted variable Po2 values with the OxyLite system in hypoxic regions (35). If the probe tip is placed in a poorly perfused or necrotic environment, it will measure a Po2 value near 0. Because necrosis and perfusion are not uniform across the entire footpad, measurements in the ischemic footpad may show large variations. In addition to site-to-site variability, another potential source of variability is the exact depth of the measurement. To mitigate these potential variables, the probe was introduced with the same gauge needle each time, insertion into the tissue was halted once the probe tip passed completely through the skin, and measurements from two locations in each footpad were averaged. The invasiveness of the Po2 probe required the use of a separate cohort of mice for this endpoint, limiting subsequent correlations to mean Po2 values rather than individual animal values, because the needle-guided insertion invoked perfusion changes in the footpad unrelated to femoral artery obstruction. In addition, hyperspectral imaging data are more consistent between animals than both LDPI data and single-point measurements of Po2 (Fig. 10, A–C). To determine whether the variation in control hemoglobin saturation values across multiple time points is due to physiological (rather than instrument) variability, repeated measurements were taken with the instrument on a whole-blood phantom (n = 5). The resulting measurements varied by 4% of the mean, whereas repeated control footpad measurements across multiple days varied by 16% of the mean. The greater variability observed in the control limbs relative to the blood phantom suggests that the variation is largely due to physiological factors such as body temperature, depth of anesthesia, and recovery from surgery, rather than instrument variability. Although both hemoglobin oxygen saturation and LDPI perfusion are sensitive to changes in body temperature, interanimal variability was lower for the hemoglobin oxygen saturation endpoint at later time points (Figs. 3B, 5D, and 10, A and B), suggesting that hyperspectral imaging may be less sensitive to extraneous variables than LDPI. Taken together, these data indicate that hyperspectral imaging provides an attractive noninvasive and absolute measure of blood oxygenation that can be used as a robust indicator of ischemic recovery over time at a cost competitive with that of an LDPI system.
Speckle variance OCT was successfully used to intravitally image changes over time in the femoral artery region distal to the site of arterial resection (area 1) to assess formation of functional anastamoses that restore flow to the primary conduit arteries that feed the distal limb (Fig. 7A). Measurements at this site showed increased OCT flow signal from blood vessels in the distal femoral artery region (Fig. 7A) over a time frame slightly delayed (14 vs. 7 days) relative to visualization of collateral vessels at the more proximal imaging site in the adductor muscle (area 2) (Fig. 7B). Speckle variance OCT also enabled visualization of tortuous, enlarged collateral vessels in the adductor muscle region (area 2) at 7 and 14 days postsurgery (Fig. 7B). The observed corkscrew vessel morphology is consistent with previous studies using postmortem techniques to study arteriogenesis in the HLI model (9, 18, 19, 41). Enlargement and remodeling of collateral vessels in the adductor muscle occur to compensate for increased hemodynamic demand caused by redirection of blood flow to these vessels following femoral artery ligation (27). The ability to intravitally acquire high-resolution images to longitudinally visualize anatomical enlargement and increased hemodynamics within these collateral vessel networks is especially impactful because it provides a measure of arteriogenesis and development of stable anastamoses that bypass the arterial blockage and restore normoxia in the distal limb (26). The use of OCT to acquire depth-resolved images that relate vessel structure and function through the skin represents a significant improvement over current methodologies used in the mouse HLI model.
The second type of OCT data was a Doppler-based endpoint and was used for transcutaneous measurement of perfusion in the femoral artery and its surrounding musculature just proximal to the popliteal bifurcation (area 1). A vascular index calculated from this region showed slower temporal recovery from ischemia compared with more superficial measures of recovery at the paw such as hyperspectral imaging and LDPI. The Doppler OCT vascular index in the ischemic limb did not improve significantly until day 14 (Fig. 8D), and it did not correlate as strongly with LDPI, as compared with hyperspectral imaging (Fig. 9). This is likely because LDPI and hyperspectral imaging are more superficial, cutaneous measurements that were both acquired on the paw and could be more sensitive to microvascular changes. The endpoint quantified from OCT images represents blood flow signal from deeper vasculature in a cross-sectional ROI located proximally to the paw that was defined to acquire a cross-sectional area 3 mm in length and 1 to 2 mm in depth centered on the distal femoral artery and vein. In this study, the Doppler OCT vascular index was measured for a single sampling volume, but future applications of OCT in the HLI model could provide an index of total blood flow by stitching together multiple volumes. Additionally, the Doppler angle could be measured from a corresponding three-dimensional structural image to study the changes in absolute blood flow velocities that occur in the limb over time (7). This approach would remove the angle-dependency of the vascular index used to quantify the Doppler OCT data and minimize the potential to underestimate flow as noted in the materials and methods. Other angle-independent parameters may also be derived from Doppler OCT data, including the pulsatility index (39) and power Doppler signal (54). Although the imaging sites differed, the Doppler OCT vascular index correlated more strongly with LDPI than with hemoglobin saturation, likely due to the greater physiological similarity between these two measurements of perfusion. Notably, both Doppler OCT and LDPI perfusion values were reduced by about 80% in the ischemic limb in the first 3 days following induction of ischemia, even though data were not gathered at the same location. By day 21, the Doppler OCT vascular index of the ischemic limb exceeded that of the control limb, which is potentially the result of more smaller vessels compensating for the single, larger conduit vessel in the quantified cross-sectional area of the proximal limb. These collective data indicate that, because it is a deeper measurement that resolves flow in individual vessels (i.e., femoral artery), Doppler OCT may provide insight into the later stages of ischemic recovery that was previously inaccessible using intravital, superficial imaging techniques. This concept is supported by previous studies suggesting that tissue recovery is heterogeneous with depth (32), and superficial measurements of resting blood flow can mask underlying flow deficits and falsely indicate full recovery of ischemic limb function that become apparent when the animal is physically challenged (4).
To our knowledge, this is the first study to measure functional and morphological data in the mouse hind limb noninvasively through the skin with OCT and quantify the response longitudinally. Speckle variance OCT provided three-dimensional images of microvessel morphology (Fig. 7), and Doppler OCT provided a quantitative measure of perfusion (Fig. 8) through the skin without contrast agents or invasive procedures. Recently, feasibility of obtaining depth-resolved microvascular images in skeletal muscle with ultrahigh sensitive optical microangiography, an extension of OCT, was demonstrated by Jia et al. (23). In this study, tissue perfusion in the exposed gastrocnemius muscle (via incision in overlying skin) was quantified in the acute stage of ischemia (45 s) and qualitatively assessed over time following femoral artery ligation. Jia et al. (23) observed pronounced reduction in blood supply within 1 h of ligation followed by restoration of perfusion in the gastrocnemius at 1 wk. Their images of blood flow in the gastrocnemius at 1 wk agree with observations at the same time point in the current studies that tortuous collateral vessels had formed in the adductor and that flow could be detected at a distal site on the femoral artery (Fig. 7). However, this study did not present quantitative data to characterize the time course of recovery and required cutting the skin to expose the muscle for imaging at each time point. This uncontrolled wounding in the limb may alter the local vasculature independent of the induction of ischemia.
The combined OCT/hyperspectral imaging approach is attractive because multiple physiological parameters can be noninvasively measured through the skin at every time point within the same animal. The interanimal variability present in the measures of recovery even within inbred strains (Fig. 10) highlights the importance of longitudinally monitoring individual animals, in addition to traditional postmortem data acquisition from separate animal cohorts at distinct time points (49, 52, 56). The ability to longitudinally track the response to regenerative therapies within each individual animal allows for more accurate estimations of treatment effects and better statistically powered studies. It also enables one to study what effects discrete genetic differences in vascular morphology may have on response to specific therapeutic regimes (5, 18, 56). In this study A/J mice were used, but these techniques are not limited to a particular mouse strain. In addition, in vivo imaging allows one to circumvent artifacts associated with postmortem animal evaluation caused by injection of viscous contrast agents at super-physiologic pressures or masking of desired epitopes due to fixation (9, 11, 14).
This study validates that a combination of hyperspectral imaging and OCT allows for noninvasive in vivo imaging of vascular structure and function (microvessel morphology, perfusion, and blood oxygenation) over the time course of ischemic recovery. These new methods not only streamline in vivo evaluations but also provide novel insights into ischemic recovery. For example, there is not an exact correlation between increases in vessel density, restoration of perfusion and oxygen delivery to the superficial tissues in anesthetized mice, and full recovery from induction of HLI (Fig. 9). These data suggest that biomarkers for recovery should be probed in multiple locations and tissue depths due to the heterogeneity in ischemic recovery as a function of these two parameters. Currently, most intravital assessments are superficial in nature, and the data presented herein confirm previous studies (4) suggesting that these superficial measurements in anesthetized animals can mask residual flow deficits. With current methods, a comprehensive assessment of response to HLI requires multiple modalities and cumbersome postmortem evaluations. Together, hyperspectral imaging and OCT provide in vivo images of microvessel structure and function that can be obtained in multiple locations and tissue depths for an unprecedented evaluation of vascular physiology in individual animals. The longitudinal, intravital data are complementary to standard, postmortem micro-CT and histology endpoints that can be acquired at the end of an intravital study. Doppler OCT imaging appears to fill a unique niche relative to other intravital methods because it provides depth-resolved data and serves as an improved biomarker for the final stages of recovery from HLI. These combined techniques will facilitate the use of more complex and more physiologically relevant mouse models of PAD such as diabetic and aged animals through a reduction in both the number of cohorts required and the time required for acquisition of comprehensive data. This advance in preclinical methodologies is anticipated to accelerate the development of improved therapeutic clinical treatments for PAD.
GRANTS
This work was supported by National Heart, Lung, and Blood Institute Grant R21 HL-109748, American Heart Association Grant-in-Aid 12GRNT 12060235, Vanderbilt Discovery Grant, NCI P30 CA068485, Vanderbilt School of Engineering, and National Science Foundation Graduate Research Fellowship DGE-0909667.
DISCLOSURES
No conflicts of interest, financial or otherwise, are declared by the author(s).
AUTHOR CONTRIBUTIONS
Author contributions: K.M.P., C.L.D., and M.C.S. conception and design of research; K.M.P., W.W.S., and A.J.W. performed experiments; K.M.P. and J.M.T.-S. analyzed data; K.M.P., C.L.D., and M.C.S. interpreted results of experiments; K.M.P. prepared figures; K.M.P. drafted manuscript; K.M.P., J.M.T.-S., W.W.S., A.J.W., C.L.D., and M.C.S. edited and revised manuscript; K.M.P., J.M.T.-S., W.W.S., A.J.W., C.L.D., and M.C.S. approved final version of manuscript.
ACKNOWLEDGMENTS
We thank Anita Mahadevan-Jansen and Quyen Nguyen for the use of hyperspectral imaging equipment, Andrew Fontanella and Greg Palmer for hyperspectral algorithm assistance, and Lillian B. Nanney and Jeffrey M. Davidson for use of the LDPI.
REFERENCES
- 1.Peripheral arterial disease in people with diabetes Diabetes Care 26: 3333–3341, 2003 [DOI] [PubMed] [Google Scholar]
- 2.Bower BA, Zhao M, Zawadzki RJ, Izatt JA. Real-time spectral domain Doppler optical coherence tomography and investigation of human retinal vessel autoregulation. J Biomed Opt 12: 041214, 2007 [DOI] [PubMed] [Google Scholar]
- 3.Braun RD, Lanzen JL, Snyder SA, Dewhirst MW. Comparison of tumor and normal tissue oxygen tension measurements using OxyLite or microelectrodes in rodents. Am J Physiol Heart Circ Physiol 280: H2533–H2544, 2001 [DOI] [PubMed] [Google Scholar]
- 4.Brevetti LS, Paek R, Brady SE, Hoffman JI, Sarkar R, Messina LM. Exercise-induced hyperemia unmasks regional blood flow deficit in experimental hindlimb ischemia. J Surg Res 98: 21–26, 2001 [DOI] [PubMed] [Google Scholar]
- 5.Chalothorn D, Faber JE. Strain-dependent variation in collateral circulatory function in mouse hindlimb. Physiol Genomics 42: 469–479, 2010 [DOI] [PMC free article] [PubMed] [Google Scholar]
- 6.Couffinhal T, Silver M, Zheng LP, Kearney M, Witzenbichler B, Isner JM. Mouse model of angiogenesis. Am J Pathol 152: 1667–1679, 1998 [PMC free article] [PubMed] [Google Scholar]
- 7.Davis AM, Rothenberg FG, Shepherd N, Izatt JA. In vivo spectral domain optical coherence tomography volumetric imaging and spectral Doppler velocimetry of early stage embryonic chicken heart development. J Opt Soc Am A Opt Image Sci Vis 25: 3134–3143, 2008 [DOI] [PubMed] [Google Scholar]
- 8.Drexler W, Fujimoto JG. State-of-the-art retinal optical coherence tomography. Prog Retin Eye Res 27: 45–88, 2008 [DOI] [PubMed] [Google Scholar]
- 9.Duvall CL, Taylor WR, Weiss D, Guldberg RE. Quantitative microcomputed tomography analysis of collateral vessel development after ischemic injury. Am J Physiol Heart Circ Physiol 287: H302–H310, 2004 [DOI] [PubMed] [Google Scholar]
- 10.Duvall CL, Taylor WR, Weiss D, Wojtowicz AM, Guldberg RE. Impaired angiogenesis, early callus formation, and late stage remodeling in fracture healing of osteopontin-deficient mice. J Bone Miner Res 22: 286–297, 2007 [DOI] [PubMed] [Google Scholar]
- 11.Duvall CL, Weiss D, Robinson ST, Alameddine FM, Guldberg RE, Taylor WR. The role of osteopontin in recovery from hind limb ischemia. Arterioscler Thromb Vasc Biol 28: 290–295, 2008 [DOI] [PubMed] [Google Scholar]
- 12.Fujimoto JG. Optical coherence tomography for ultrahigh resolution in vivo imaging. Nat Biotechnol 21: 1361–1367, 2003 [DOI] [PubMed] [Google Scholar]
- 13.Gebhart SC, Thompson RC, Mahadevan-Jansen A. Liquid-crystal tunable filter spectral imaging for brain tumor demarcation. Appl Opt 46: 1896–1910, 2007 [DOI] [PubMed] [Google Scholar]
- 14.Golub JS, Kim YT, Duvall CL, Bellamkonda RV, Gupta D, Lin AS, Weiss D, Robert Taylor W, Guldberg RE. Sustained VEGF delivery via PLGA nanoparticles promotes vascular growth. Am J Physiol Heart Circ Physiol 298: H1959–H1965, 2010 [DOI] [PMC free article] [PubMed] [Google Scholar]
- 15.Gounis MJ, Spiga MG, Graham RM, Wilson A, Haliko S, Lieber BB, Wakhloo AK, Webster KA. Angiogenesis is confined to the transient period of VEGF expression that follows adenoviral gene delivery to ischemic muscle. Gene Ther 12: 762–771, 2005 [DOI] [PubMed] [Google Scholar]
- 16.Gu S, Jenkins MW, Peterson LM, Doughman YQ, Rollins AM, Watanabe M. Optical coherence tomography captures rapid hemodynamic responses to acute hypoxia in the cardiovascular system of early embryos. Dev Dyn 241: 534–544, 2012 [DOI] [PMC free article] [PubMed] [Google Scholar]
- 17.Gupta R, Tongers J, Losordo DW. Human studies of angiogenic gene therapy. Circ Res 105: 724–736, 2009 [DOI] [PMC free article] [PubMed] [Google Scholar]
- 18.Helisch A, Wagner S, Khan N, Drinane M, Wolfram S, Heil M, Ziegelhoeffer T, Brandt U, Pearlman JD, Swartz HM, Schaper W. Impact of mouse strain differences in innate hindlimb collateral vasculature. Arterioscler Thromb Vasc Biol 26: 520–526, 2006 [DOI] [PubMed] [Google Scholar]
- 19.Ito WD, Arras M, Winkler B, Scholz D, Schaper J, Schaper W. Monocyte chemotactic protein-1 increases collateral and peripheral conductance after femoral artery occlusion. Circ Res 80: 829–837, 1997 [DOI] [PubMed] [Google Scholar]
- 20.Izatt JA, Kulkarni MD, Yazdanfar S, Barton JK, Welch AJ. In vivo bidirectional color Doppler flow imaging of picoliter blood volumes using optical coherence tomography. Opt Lett 22: 1439–1441, 1997 [DOI] [PubMed] [Google Scholar]
- 21.Jacoby C, Boring YC, Beck A, Zernecke A, Aurich V, Weber C, Schrader J, Flogel U. Dynamic changes in murine vessel geometry assessed by high-resolution magnetic resonance angiography: a 9.4T study. J Magn Reson Imaging 28: 637–645, 2008 [DOI] [PubMed] [Google Scholar]
- 22.Jacques SL. Skin Optics: Oregon Medical Laser Center News, 1998 [Google Scholar]
- 23.Jia Y, Qin J, Zhi Z, Wang RK. Ultrahigh sensitive optical microangiography reveals depth-resolved microcirculation and its longitudinal response to prolonged ischemic event within skeletal muscles in mice. J Biomed Opt 16: 086004, 2011 [DOI] [PMC free article] [PubMed] [Google Scholar]
- 24.Jones WS, Annex BH. Growth factors for therapeutic angiogenesis in peripheral arterial disease. Curr Opin Cardiol 22: 458–463, 2007 [DOI] [PubMed] [Google Scholar]
- 25.Khaodhiar L, Dinh T, Schomacker KT, Panasyuk SV, Freeman JE, Lew R, Vo T, Panasyuk AA, Lima C, Giurini JM, Lyons TE, Veves A. The use of medical hyperspectral technology to evaluate microcirculatory changes in diabetic foot ulcers and to predict clinical outcomes. Diabetes Care 30: 903–910, 2007 [DOI] [PubMed] [Google Scholar]
- 26.Landazuri N, Joseph G, Guldberg RE, Taylor WR. Growth and regression of vasculature in healthy and diabetic mice after hindlimb ischemia. Am J Physiol Regul Integr Comp Physiol 303: R48–R56, 2012 [DOI] [PMC free article] [PubMed] [Google Scholar]
- 27.Limbourg A, Korff T, Napp LC, Schaper W, Drexler H, Limbourg FP. Evaluation of postnatal arteriogenesis and angiogenesis in a mouse model of hind-limb ischemia. Nat Protoc 4: 1737–1746, 2009 [DOI] [PubMed] [Google Scholar]
- 28.Makino H, Aoki M, Hashiya N, Yamasaki K, Azuma J, Sawa Y, Kaneda Y, Ogihara T, Morishita R. Long-term follow-up evaluation of results from clinical trial using hepatocyte growth factor gene to treat severe peripheral arterial disease. Arterioscler Thromb Vasc Biol 32: 2503–2509, 2012 [DOI] [PubMed] [Google Scholar]
- 29.Makita S, Hong Y, Yamanari M, Yatagai T, Yasuno Y. Optical coherence angiography. Opt Express 14: 7821–7840, 2006 [DOI] [PubMed] [Google Scholar]
- 30.Mariampillai A, Standish BA, Moriyama EH, Khurana M, Munce NR, Leung MK, Jiang J, Cable A, Wilson BC, Vitkin IA, Yang VX. Speckle variance detection of microvasculature using swept-source optical coherence tomography. Opt Lett 33: 1530–1532, 2008 [DOI] [PubMed] [Google Scholar]
- 31.Marui A, Tabata Y, Kojima S, Yamamoto M, Tambara K, Nishina T, Saji Y, Inui K, Hashida T, Yokoyama S, Onodera R, Ikeda T, Fukushima M, Komeda M. A novel approach to therapeutic angiogenesis for patients with critical limb ischemia by sustained release of basic fibroblast growth factor using biodegradable gelatin hydrogel: an initial report of the phase I-IIa study. Circ J 71: 1181–1186, 2007 [DOI] [PubMed] [Google Scholar]
- 32.Mesquita RC, Skuli N, Kim MN, Liang J, Schenkel S, Majmundar AJ, Simon MC, Yodh AG. Hemodynamic and metabolic diffuse optical monitoring in a mouse model of hindlimb ischemia. Biomed Opt Express 1: 1173–1187, 2010 [DOI] [PMC free article] [PubMed] [Google Scholar]
- 33.Nikol S, Baumgartner I, Van Belle E, Diehm C, Visona A, Capogrossi MC, Ferreira-Maldent N, Gallino A, Wyatt MG, Wijesinghe LD, Fusari M, Stephan D, Emmerich J, Pompilio G, Vermassen F, Pham E, Grek V, Coleman M, Meyer F. Therapeutic angiogenesis with intramuscular NV1FGF improves amputation-free survival in patients with critical limb ischemia. Mol Ther 16: 972–978, 2008 [DOI] [PubMed] [Google Scholar]
- 34.Palmer GM, Fontanella AN, Shan S, Hanna G, Zhang G, Fraser CL, Dewhirst MW. In vivo optical molecular imaging and analysis in mice using dorsal window chamber models applied to hypoxia, vasculature and fluorescent reporters. Nat Protoc 6: 1355–1366, 2011 [DOI] [PMC free article] [PubMed] [Google Scholar]
- 35.Palmer GM, Viola RJ, Schroeder T, Yarmolenko PS, Dewhirst MW, Ramanujam N. Quantitative diffuse reflectance and fluorescence spectroscopy: tool to monitor tumor physiology in vivo. J Biomed Opt 14: 024010, 2009 [DOI] [PMC free article] [PubMed] [Google Scholar]
- 36.Pearson K. Mathematical contributions to the theory of evolution. III. Regression, heredity, and panmixia. Philos T R Soc A 187: 253–318, 1896 [Google Scholar]
- 37.Pierce MC, Strasswimmer J, Park BH, Cense B, de Boer JF. Advances in optical coherence tomography imaging for dermatology. J Invest Dermatol 123: 458–463, 2004 [DOI] [PubMed] [Google Scholar]
- 38.Powell RJ, Simons M, Mendelsohn FO, Daniel G, Henry TD, Koga M, Morishita R, Annex BH. Results of a double-blind, placebo-controlled study to assess the safety of intramuscular injection of hepatocyte growth factor plasmid to improve limb perfusion in patients with critical limb ischemia. Circulation 118: 58–65, 2008 [DOI] [PubMed] [Google Scholar]
- 39.Rao B, Yu L, Chiang HK, Zacharias LC, Kurtz RM, Kuppermann BD, Chen Z. Imaging pulsatile retinal blood flow in human eye. J Biomed Opt 13: 040505, 2008 [DOI] [PMC free article] [PubMed] [Google Scholar]
- 40.Roger VL, Go AS, Lloyd-Jones DM, Benjamin EJ, Berry JD, Borden WB, Bravata DM, Dai S, Ford ES, Fox CS, Fullerton HJ, Gillespie C, Hailpern SM, Heit JA, Howard VJ, Kissela BM, Kittner SJ, Lackland DT, Lichtman JH, Lisabeth LD, Makuc DM, Marcus GM, Marelli A, Matchar DB, Moy CS, Mozaffarian D, Mussolino ME, Nichol G, Paynter NP, Soliman EZ, Sorlie PD, Sotoodehnia N, Turan TN, Virani SS, Wong ND, Woo D, Turner MB. Heart disease and stroke statistics—2012 update: a report from the American Heart Association. Circulation 125: e2–e220, 2012 [DOI] [PMC free article] [PubMed] [Google Scholar]
- 41.Scholz D, Ziegelhoeffer T, Helisch A, Wagner S, Friedrich C, Podzuweit T, Schaper W. Contribution of arteriogenesis and angiogenesis to postocclusive hindlimb perfusion in mice. J Mol Cell Cardiol 34: 775–787, 2002 [DOI] [PubMed] [Google Scholar]
- 42.Shonat RD, Wachman ES, Niu W, Koretsky AP, Farkas DL. Near-simultaneous hemoglobin saturation and oxygen tension maps in mouse brain using an AOTF microscope. Biophys J 73: 1223–1231, 1997 [DOI] [PMC free article] [PubMed] [Google Scholar]
- 43.Skala MC, Fontanella A, Hendargo H, Dewhirst MW, Izatt JA. Combined hyperspectral and spectral domain optical coherence tomography microscope for noninvasive hemodynamic imaging. Opt Lett 34: 289–291, 2009 [DOI] [PMC free article] [PubMed] [Google Scholar]
- 44.Skala MC, Fontanella A, Lan L, Izatt JA, Dewhirst MW. Longitudinal optical imaging of tumor metabolism and hemodynamics. J Biomed Opt 15: 011112, 2010 [DOI] [PMC free article] [PubMed] [Google Scholar]
- 45.Skala MC, Tao YK, Davis AM, Izatt JA. Functional optical coherence tomography in preclinical models. In: Handbook of Biomedical Optics, edited by Boas DA, Pitris C, Ramanujam N. Boca Raton: CRC Press, 2011, p. 281–302 [Google Scholar]
- 46.Sorg BS, Moeller BJ, Donovan O, Cao Y, Dewhirst MW. Hyperspectral imaging of hemoglobin saturation in tumor microvasculature and tumor hypoxia development. J Biomed Opt 10: 44004, 2005 [DOI] [PubMed] [Google Scholar]
- 47.Srinivasan VJ, Jiang JY, Yaseen MA, Radhakrishnan H, Wu W, Barry S, Cable AE, Boas DA. Rapid volumetric angiography of cortical microvasculature with optical coherence tomography. Opt Lett 35: 43–45, 2010 [DOI] [PMC free article] [PubMed] [Google Scholar]
- 48.Standish BA, Yang VXD, Munce NR, Song LMWK, Gardiner G, Lin A, Mao YI, Vitkin A, Marcon NE, Wilson BC. Doppler optical coherence tomography monitoring of microvascular tissue response during photodynamic therapy in an animal model of Barrett's esophagus. Gastrointest Endosc 66: 326–333, 2007 [DOI] [PubMed] [Google Scholar]
- 49.Stevens JC, Banks GT, Festing MF, Fisher EM. Quiet mutations in inbred strains of mice. Trends Mol Med 13: 512–519, 2007 [DOI] [PubMed] [Google Scholar]
- 50.Tongers J, Roncalli JG, Losordo DW. Therapeutic angiogenesis for critical limb ischemia: microvascular therapies coming of age. Circulation 118: 9–16, 2008 [DOI] [PubMed] [Google Scholar]
- 51.Vakoc BJ, Fukumura D, Jain RK, Bouma BE. Cancer imaging by optical coherence tomography: preclinical progress and clinical potential. Nat Rev Cancer 12: 363–368, 2012 [DOI] [PMC free article] [PubMed] [Google Scholar]
- 52.Watkins-Chow DE, Pavan WJ. Genomic copy number and expression variation within the C57BL/6J inbred mouse strain. Genome Res 18: 60–66, 2008 [DOI] [PMC free article] [PubMed] [Google Scholar]
- 53.Weitz JI, Byrne J, Clagett GP, Farkouh ME, Porter JM, Sackett DL, Strandness DE, Jr, Taylor LM. Diagnosis and treatment of chronic arterial insufficiency of the lower extremities: a critical review. Circulation 94: 3026–3049, 1996 [DOI] [PubMed] [Google Scholar]
- 54.Yang V, Gordon M, Qi B, Pekar J, Lo S, Seng-Yue E, Mok A, Wilson B, Vitkin I. High speed, wide velocity dynamic range Doppler optical coherence tomography (Part I): system design, signal processing, and performance. Opt Express 11: 794–809, 2003 [DOI] [PubMed] [Google Scholar]
- 55.Yazdanfar S, Kulkarni M, Izatt J. High resolution imaging of in vivo cardiac dynamics using color Doppler optical coherence tomography. Opt Express 1: 424–431, 1997 [DOI] [PubMed] [Google Scholar]
- 56.Zbinden S, Clavijo LC, Kantor B, Morsli H, Cortes GA, Andrews JA, Jang GJ, Burnett MS, Epstein SE. Interanimal variability in preexisting collaterals is a major factor determining outcome in experimental angiogenesis trials. Am J Physiol Heart Circ Physiol 292: H1891–H1897, 2007 [DOI] [PubMed] [Google Scholar]