Abstract
Background and aims: Raman spectroscopy is a vibrational technique which provides information about the chemical structure. Nevertheless, since many chemicals are present in a cell at very low concentration, the Raman signal observed from a single cell is extremely weak. In surface enhanced Raman scattering (SERS), Raman signals can be enhanced by many orders of magnitude when nanoparticles are incorporated into the cell.
Materials (subjects) and methods: The tumor biopsies were obtained from 5 patients who were clinically diagnosed with breast cancer. Breast cancer cells isolated from the biopsy were washed, centrifuged and seeded out. Cultivation took place in DMEM at 37°C in a humidified of 5% CO2 in air with addition of colloidal silver nanoparticles of 40 nm into the cell by sonication. Immediately, the washed cells were analyzed in phosphate buffered saline (PBS) at pH 7. Raman analysis was carried out on the Jobin-Yvon LabRAM HR800 microscope system, with a NIR 830 nm laser excitation source.
Results: The strongly enhanced Raman signals allow Raman measurements of a single cell in the 200–1800 cm−1 range in relatively short collection times (5 second) using 17 mW near-infrared excitation. Observed spectral features differed across the cell, but chemical constituents in the cell nucleus and cytoplasm, such as DNA, RNA, and amino acids tyrosine and phenylalanine can be identified.
Conclusions: Particularly strong field enhancement can be observed when nanoparticles form colloidal clusters. The results suggest that SERS could be a new technique for the identification of breast cancer cell.
Keywords: Breast cancer cells, Silver nanoparticles, Surface enhanced Raman spectroscopy
Introduction
Currently, cancer is a global health problem and various techniques are used for detection, however, the final outcome is defined by the pathological study of a biopsy taken. The need to reduce the number of biopsies of benign tissue, patient trauma and high medical costs has motivated researchers to explore spectroscopic techniques to improve diagnosis of breast cancer, especially to be able to distinguish benign and malignant lesions. These techniques include fluorescence, diffuse reflectance and Raman, which provide information on tissue composition at the molecular level 1).
Raman spectroscopy is an inelastic scattering process in which the photons incident on the sample transfer energy to (or from) the molecular vibrational modes. This is a process coherent biphotonic in which a molecule simultaneously absorbs a photon incident and emits a photon Raman accompanied of a transition of an energy level to another, leading to a frequency shift (wavenumber, cm−1) of the emitted photon. Because, the energy levels are unique for each molecule, Raman spectra are chemically specific. Bands (peaks) in the Raman spectrum individual are characteristic of specific molecular vibrations 2).
The general characteristics of malignant cells are expressed in specific changes in the quantity and/or conformation of nucleic acids, proteins, lipids and carbohydrates 3). Raman spectroscopy allows for finding these changes through the structural variations of the peaks of the spectrum, corresponding to specific molecular vibrations of the components mentioned. Thus, this technique provides detailed information of the chemical composition of a tissue on a molecular level by making it a very promising clinical tool for diagnosis of a wide variety of pathologies 4,5). Although the Raman spectra provide a high information content of tissue, the Raman signal is several orders of magnitude smaller than the fluorescence signal. This drawback is overcome by using laser excitation sources in the near infrared (NIR), which inhibits the electronic transitions that give rise to fluorescence.
Currently, there are studies in which blood serum samples are analyzed by Raman spectroscopy technique for the diagnosis of breast cancer 6), cervical 7, 8), gastric 9), leukemia 10) as well as known results using breast cancer biopsies 5). Raman is an excellent technique for the detection of cancer and it is emerging as a novel technique that would replace the costly and traumatic surgical procedures by a simple, fast and reliable cell test.
The Raman scattering is an inefficient process with low scattering cross sections which are approximately fourteen orders of magnitude smaller than the cross sections of absorption of fluorescent molecules. To achieve high sensitivity of a biological sample, the scattered intensity must be strongly enhanced. The SERS technique that uses sensors of nanoparticles of noble metals (Ag, Au and Cu) has proven a very effective technique to overcome the sensitivity problems inherent to conventional Raman spectroscopy. Using the technique SERS, the detection sensitivity is improved to 6–10 orders of magnitude over conventional Raman spectroscopy 11,12).
Nanoparticles of Ag, Au and Cu show an intense absorption band in the UV-VIS which is not present in the spectrum of the bulk metal. This absorption band appears when the frequency of incident photon is in resonance with the collective oscillation of conduction electrons. This phenomenon is manifested in the strong enhancement of the electromagnetic field on the surface of the metal nanoparticle causing amplification of Raman signal of the molecules adsorbed on that surface 13). SERS technique has applications in the study of biochemical compounds to very small concentrations for the high ability to enhance the Raman signal which can be up to a single molecule 14,15).
Due to the chemical inactivity of gold and silver, nanoparticles of these metals are most suitable for introduction into living cells as SERS sensors, so the Raman signal of intracellular components could be strongly enhanced. It has been shown that the colloidal clusters of gold nanoparticles have a SERS amplification factor comparable to colloidal clusters of silver nanoparticle when an excitation in the near-infrared (NIR) is applied. The excitation in the NIR region is suitable for Raman measurements of cell because photons of low energy reduce background fluorescence in biological samples and risk of cell degeneration 16).
In this paper, the SERS technique is applied for analysis of breast cancer cells using silver colloidal nanoparticles. Thus, the SERS technique is a powerful tool of high sensitivity for screening of chemicals in a sample, being of great importance for the purposes of biomedical research that will structure a method of early diagnosis of any cancer. In addition, the SERS technique can detect changes in DNA structure, allowing us in the near future make a promising and unprecedented study of the possible causes of the molecular changes that give rise to cancer.
Materials and methods
In this project were included 6 biopsies of 5 women from Instituto Mexicano del Seguro Social (IMSS) between 20 and 60 years old who were diagnosed with ductal breast carcinoma and underwent radical mastectomy, lumpectomy or harpoon biopsy. A biopsy was taken from peripheral tissue from which control cells were obtained. Written consent was obtained from the subjects and the study was conducted according to the Declaration of Helsinki.
The tissue is washed with fresh PBS at pH 7.0, a dissection was performed by obtaining sections of 2 to 3 mm and subsequently added DMEM culture medium preheated to 37°C. The digestion mixture was centrifuged at 10000 rpm at a temperature of 8°C for 10 minutes to obtain a cell suspension. Subsequently the supernatant was removed, the cell suspension was resuspended at 1 ml of DMEM and cultivated in a Roux culture flask with 15 ml of culture medium, supplemented with 10% fetal bovine serum and penicillin and incubated at 37 °C, 5% CO2 and 40% relative humidity. Once the cells adhered to the substrate, the DMEM was changed twice a week, eliminating cells that have not adhered to achieve a cell confluence of 80%. Reaching cell confluence, culture medium was discarded, added 3 ml of trypsin to detach cells from the substrate, sample was centrifuged at 10000 rpm (at 8°C) for 10 minutes and trypsin was discarded, added 10.0 ml of culture medium and finally incubated at 37°C, 5% of CO2 and 40% relative humidity. For SERS techniques, cells were incubated 24 hrs together with colloidal silver nanoparticles of 40 nm. Immediately after removing the cells from the incubator (at 37°C), were subjected to 0°C (thermal shock) to open the pores of the cell membrane and allow the incorporation of silver nanoparticles into the cell. In addition, sonication was applied to help incorporate the nanoparticles. After the experiments, free silver was removed by rinsing the monolayers. Cells with the nanoparticles remained in the same buffer throughout the measurements.
Ultrasound has been shown to rupture the cell plasma membrane and permit entry of the colloidal silver particles, followed be self-annealing of the ruptured membrane edges within a few seconds.
Evidence that cells are alive after treatment with the colloidal silver comes from phase contrast inspection of the cultures showing that cells incubated with colloidal silver are visibly growing and that there is no evidence of cell rounding, apoptotic activity, or cell detachment from the growth surface when compared with control monolayers.
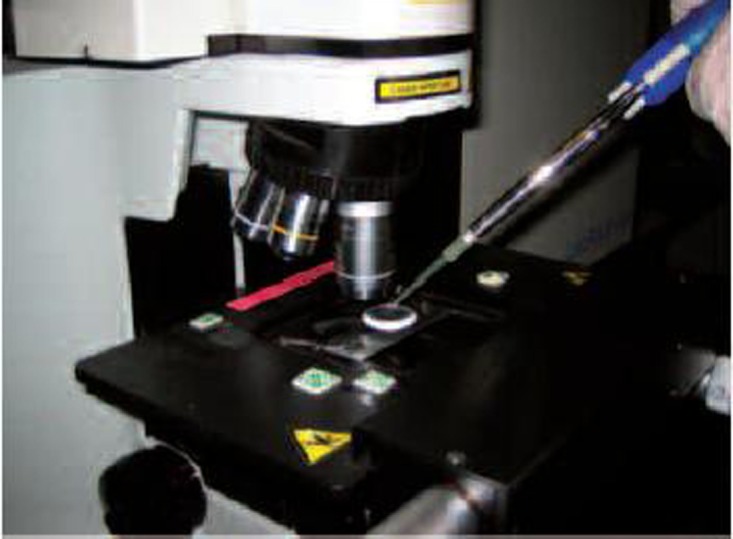
For analysis, a cell sample of 40 μl was placed on a lens of MgF2 and it on the microscope XY stage integrated Raman system (see Fig. 1), which was examined by an Olympus microscope and several points were chosen for Raman measurement. All spectra were collected at a Jobin-Yvon LabRAM HR800 Raman Spectrometer with a NIR 830 nm laser and power of 17 mW to not affect the cell sample and not produce any cell degeneration. This XY stage has a resolution of 0.1 μm, which allows obtaining spectra of each sample in a quick and efficient form. The Raman system was calibrated with a silicon semiconductor using the Raman peak at 520 cm−1. The laser beam was focused on the surface of the sample with a 50× objective.
Figure 1.

A small drop of cell sample was placed on MgF2 lens and it on the microscope XY stage integrated Raman system.
The exposure time of the cell samples to the excitation laser was in very short times on the order of 1–10 seconds. Typical collection times for a conventional Raman spectrum inside a living cell using 17 mW laser excitation in a confocal Raman system can be hundreds of seconds, summing up to very long data acquisition times for a “Raman imaging” of a cell, thus making it difficult to study viable cell lines.
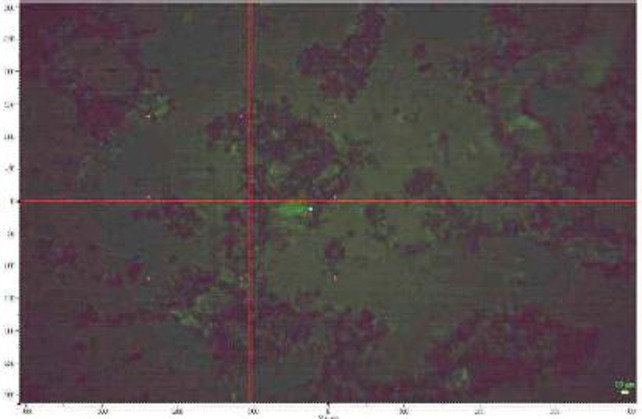
In Fig. 2 is shown a cell image with the cluster—cluster aggregation of silver nanoparticles inside the cell. To ensure statistically sound sampling, 8 spectra are taken pointing the beam at different points of cell image obtaining a total of 40 spectra. Region analyzed was from 200 to 1 800 cm−1, with a resolution of 0.6 cm−1.
Figure 2.
Cell image with the cluster—cluster aggregation of silver nanoparticles inside the cell.
Results
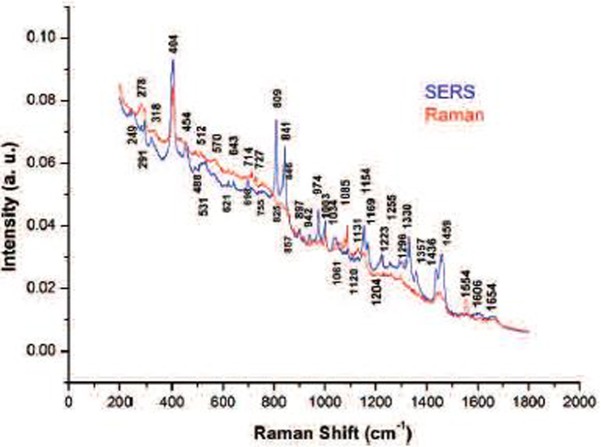
Fig. 3 shows the comparison of the Raman and SERS spectra of breast cancer cell. Here we see very obvious changes, certain peaks or bands are enhanced, new peaks are observed and some remain unchanged. The fact that some peaks were not strongly enhanced is basically due to cluster—cluster aggregation of silver nanoparticles are closer to certain other molecules. It is important to remember that the SERS spectra needed only 5 seconds of exposure to the laser while the Raman spectra required 40 to 60 seconds.
Figure 3.
Raman and SERS spectra with bands corresponding to the main molecules of breast cancer cell.
Clearly, the SERS technique allows for defining some regions with respect to the conventional Raman spectrum, for example, the regions of 800–900, 950–1100 and 1150–1400 cm−1. In a few spectra of living cells, a very weak SERS band appears at about 1450 cm−1. In the region of 1150–1400 cm−1 of the conventional Raman spectrum is observed a pair of shoulders corresponding to the protein amide III, which it is closely associated with breast cancer. As can be observed in this same region of the SERS spectrum, the two shoulders unfolded in a series of SERS band allowing for studying this protein in more detail.
In both spectra, the line 404 cm−1 corresponds to the lens MgF2. In the Raman spectrum, the band at 1120 cm−1 can be assigned to an O-P-O DNA backbone vibration and which seems not enhance with the silver nanoparticles. Nevertheless, other studies [15], this band seems to undergo a slight shift compared to Raman band. The lines at about 1300 cm−1 recorded enhancement with use of the colloids and they are related to adenine and guanine vibrations. The phenylalanine band at 1002 cm−1 seems to exhibit almost no enhancement. At about 1450 cm−1 (band assigned to the protein CH deformations vibration) a strong enhancement and a splitting is observed. The SERS peaks in 1654 cm−1 (amide I), 755 cm−1 (tryptophan) and 643 cm−1 (is very likely due to a superposition of a strong tyrosine vibration 17) and the guanine line) are less intense than the conventional Raman peaks.
The peaks that show strong enhancement due to silver nanoparticles are: 1154 cm−1 (tyrosine), 1034 cm−1, 974 cm−1 (C-O DNA backbone vibration), 950 cm−1, 900 cm−1, 830 cm−1, 531 cm−1, 450 cm−1, 325 cm−1 and 250 cm−1. The set of peaks corresponding to the region of 1150–1400 cm−1 (amide III) were strongly enhanced with the SERS technique and provides raw materials to examine differences between the peaks of control and breast cancer cell samples.
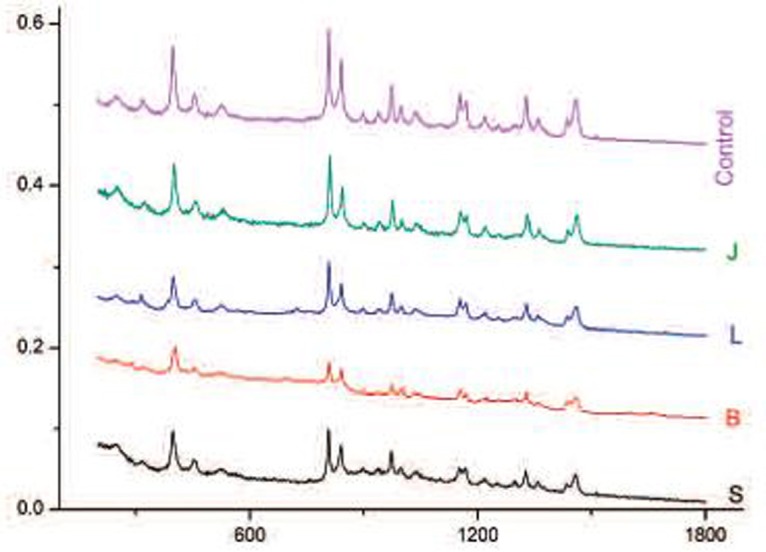
In this work, tumor biopsies were obtained from 5 patients who were clinically diagnosed with breast cancer. The control cells were obtained from peripheral tissue. Breast cancer and control cells isolated from the biopsy were washed, centrifuged and seeded out. The mean spectra of breast cancer and control cells of the 5 patients are shown in Fig. 4. A total of 40 spectra were taken.
Figure 4.

The mean SERS spectra of breast cancer and control cells of the five patients.
The SERS technique strongly enhanced some peaks and new characteristic bands appeared. It will allow us to get a better classification of cells using method of Principal Component Analysis (PCA) and obtain an early breast cancer diagnosis the most reliable possible.
Discussion
Particularly strong field enhancement can be observed when nanoparticles form colloidal clusters. These preliminary results suggest that SERS could be a new technique for the identification of breast cancer cell. It was possible to enhance strongly the intensities of several peaks allowing us to identify the chemical constituents of the cells as phenylalanine, tyrosine, tryptophan and protein, and detecting changes in the structure of DNA (adenine and guanine).
The SERS technique reduces exposure times to obtain a spectrum with well-defined peaks or bands in a few seconds, even when the samples are as small as a single cell, whereas with conventional Raman techniques require several hundreds of seconds for analysis.
Peaks strongly enhanced and short exposure times will facilitate the implementation of other techniques, such as confocal image, for a more complete biochemical analysis of the cells.
Conclusions
In this work, we characterize the cells of patients with breast cancer using the SERS technique by observing several regions strongly enhanced with silver nanoparticles 40 nm in diameter. Furthermore, it was possible to identify the chemical constituents of the samples as phenylalanine, tyrosine, tryptophan and protein, and detecting changes in the structure of DNA. The SERS technique reduces exposure times to obtain a spectrum with well-defined peaks or bands in a few seconds, even when the samples are as small as a single cell, whereas with conventional Raman techniques require several hundreds of seconds for analysis. It work shows that the SERS technique opens up great possibilities to measure hundreds of spectra of a single cell allowing what is known as a confocal Raman imaging, which allow us to know the spatial distribution chemistry inside of cell. In addition, combining the SERS technique with atomic force microscopy, a technique known as TERS (Tip Enhanced Raman Spectroscopy), a single spectrum may be obtained in milliseconds thereby achieving a confocal Raman imaging of high resolution within a few minutes.
Clearly, the results presented here suggest that the application of TERS technique to study cancer is possible offering better diagnostic technique with a single cell. In addition, the TERS technique will be able to detect changes in DNA structure, allowing us in the near future make a promising and unprecedented study of the possible causes of the molecular changes that give rise to cancer.
Acknowledgements
The authors wish to thank CONACYT (grant number 45488) and National Research Network, Soft Condensed Matter, for financial support.
Footnotes
The contents of this article were originally presented as an oral paper at Laser Florence 2012 on November 10th 2012 in Florence, Italy.
References
- 1.Hanlon EB, Manoharan R, Koo TW, Shafer KE, Motz JT, Fitzmaurice M, Kramer JR, Itzkan I, Dasari RR, Feld MS. (2000): Topical Review: Prospects for in vivo Raman spectroscopy. Phys. Med. Biol., 45: R1-R59 [DOI] [PubMed] [Google Scholar]
- 2.Raman CV, Krishnan KS. (1928): Nature, 121: 501-502 [Google Scholar]
- 3.Mahadeva-Jansen A, Richards-Kortum R. (1997): Raman spectroscopy for detection: a review. Proceedings-19th International Conference-IEEE/EMBS, Oct. 30-Nov. 2, Chicago: 2722-2728 [Google Scholar]
- 4.Shafer-Peltier KE, Haka AS, Fitzmaurice M, Crowe J, Myles J, Dasari RR., Feld MS. (2002): Raman microespectroscopic model of human Breast tissue: implications for breast cancer diagnosis in vivo. J. Raman Spectrosc, 33: 552-563 [Google Scholar]
- 5.González-Solís JL, Aguiñaga-Serrano BI, Martínez-Espinosa JC, Oceguera-Villanueva A. (2011): Stage determination of breast cancer biopsy using Raman spectroscopy and multivariate analysis. AIP Conference Proceedings, 1364: 33-40 [Google Scholar]
- 6.Pichardo-Molina JL, Frausto-Reyes C, Barbosa-García O, Huerta-Franco R, González-Trujillo JL, Ramírez-Alvarado CA, Gutiérrez-Juárez G, Medina-Gutiérrez C. (2006): Raman spectroscopy and multivariate analysis of serum simples from breast cancer patients. Laser Med Sci, 10103: 432-438 [DOI] [PubMed] [Google Scholar]
- 7.González-Solís JL, Rodriguez-López J, Martínez-Espinosa JC, Frausto-Reyes C, Jave-Suárez LF, Aguilar-Lemarroy AC, Vargas-Rodríguez H, Martínez-Cano E. (2009): Detection of Cervical Cancer Analyzing Blood Samples with Raman Spectroscopy and Multivariate Analysis. AIP Conference Proceedings, 1126: 91-95 [Google Scholar]
- 8.Rodriguez-López J. (2009): Caracterización de Muestras de Sangre de Pacientes con Cáncer Cérvicouterino Usando Espectroscopia Raman y el Análisis Multivariado en la Plataforma MATLAB. Tesis de Licenciatura en Ing. Mecatrónica, Centro Universitario de los Lagos, Universidad de Guadalajara. [Google Scholar]
- 9.Shangyuan F, Rong Ch, Jianji P, Yanan W, Yongzeng L, Jiesi Ch, Haishan Z. (2011): Gastric cancer detection based on blood plasm surfaceenhanced Raman spectroscopy excited by polarized laser light. Biosensors and Bioelectronics, 26: 3167-3174 [DOI] [PubMed] [Google Scholar]
- 10.González-Solís JL, Martínez-Espinosa JC, Frausto-Reyes C, Miranda-Beltrán ML, Soria-Fregoso C, Medina-Valtierra J. (2010): Detection of Leukemia with Blood Samples Using Raman Spectroscopy and Multivariate Analysis. AIP Conference Proceedings, 1142: 99-103 [Google Scholar]
- 11.Chan S, Kwon S, Koo TW, Lee LP, Berlin AA. (2003): Surface-Enhanced Raman Scattering of Small Molecules from Silver Coated Silicon Nanopores, Adv. Mater., 15(19): 1595-1598 [Google Scholar]
- 12.Garrell RL. (1989): Surface-enhanced Raman spectroscopy, Anal. Chem, 61(6): 401A-402A [DOI] [PubMed] [Google Scholar]
- 13.Haes AJ, Zou S, Schatz GC, Van Duyne RP. (2004): A Nanoscale Optical Biosensor: The Long Range Distance Dependence of the Localized Surface Plasmon Resonance of Noble Metal Nanoparticles, J. Phys. Chem. B, 108(1): 109-116 [Google Scholar]
- 14.Vo-Dinh T. (1995): In Photonic Probes of Surfaces, edited by P. Halevi, Elsevier, New York. [Google Scholar]
- 15.Nie S, Emory SR. (1997): Probing Single Molecules and Single Nanoparticles by Surface-Enhanced Raman Scattering. Science, 275: 1102-1106 [DOI] [PubMed] [Google Scholar]
- 16.Kneipp K, Haka AS, Kneipp H, Badizadegan K, Yoshizawa N, Boone Ch, Shafer-Peltier KE, Motz JT, Dasari RR, Feld MS. (2002): Surface-Enhanced Raman Spectroscopy in Single Living Cells Using Gold Nanoparticles. Applied Spectroscopy, 56(2): 150-154 [Google Scholar]
- 17.Peticolas WL, Patapoff TW, Thomas GA, Postlewait J, Powell JW. (1996): Laser Raman Microscopy of Chromosomes in Living Eukaryotic Cells: DNA Polymorphism In Vivo. J. Raman Spectrosc., 27: 571-578 [Google Scholar]


