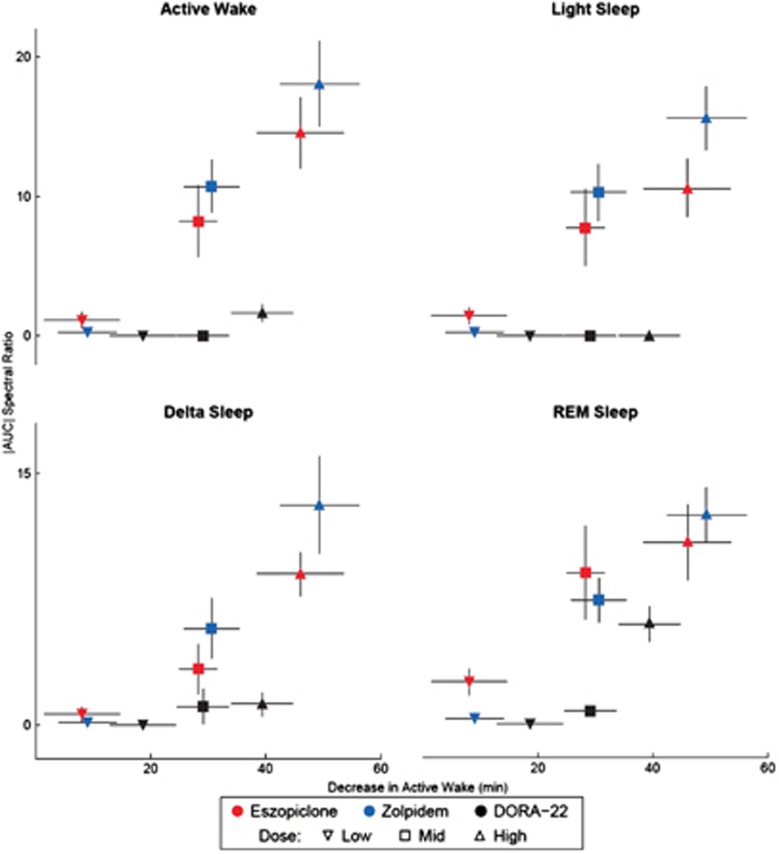
Figure 5.
Dual orexin receptor antagonist (DORA-22) minimally alters EEG frequency as a function of sleep. Area under/over the electroencephalogram (EEG) spectral frequency (Figure 3) as a function of decreases in active wake (Figure 1) for each sleep/wake state (different panes). Inverted triangle (▾) indicates low dose, square (▪) indicates mid dose, and triangle (▴) indicates high dose. Symbols represent average decrease in active wake (x axis)±standard error of mean (SEM), and average area under/over the EEG frequency curve outside of the±5% dosing effect area (y axis)±SEM.

