Abstract
The process of moving from the locally defined flowsheet ontology containing redundancy and jargon to one understandable by researchers is described. Over 250 million nursing flowsheet observations were imported into a data repository that uses the i2b2 framework. Focus groups were used to derive a new ontology model--18 templates were identified. One hundred measures, 50% of all patient observations over 36 months, were encoded in SNOMED CT©. 78% of the concepts were mapped.
Introduction
Florence Nightingale is well known for her directives to nurses to collect and analyze data1. From these humble, but well informed, beginnings, nurses began to keep notes on their observations about patients. At first these notes were descriptions, but as nurses’ work evolved into sophisticated monitoring of patient status using a wide variety of technologies, the nursing flowsheet emerged. The flowsheet evolved from text in nursing notes to graphical representations of data shown over time, usually as 24 hour period. Unfortunately, each nursing unit devised their own flowsheet with graphical structure and notations. Semantic interoperability was not a goal. In today’s world of electronic health records (EHRs), flowsheets are a key functionality to display patient data over time and may be used to evaluate the progress of the patient to document safety and therapy measures. With the advent of NIH’s Clinical Translational Science Awards, a new era has become possible—using EHR data for research purposes 2. This transformation requires informaticians who can transform the raw clinical data from an EHR into a research data repository with query, visualization, and analysis features. This transformation fulfills the vision of Florence Nightingale when she said: “In attempting to arrive at the truth, I have applied everywhere for information, but in scarcely an instance have I been able to obtain hospital records fit for any purposes of comparison. If they could be obtained they would enable us to decide many other questions besides the ones alluded to. They would show the subscribers how their money was being spent, what amount of good was really being done with it, or whether the money was not doing mischief rather than good (p, 76).”1
A data repository stores information designed for retrieval while the EHR is designed for efficient and reliable transaction processing and data storage. The i2b2 tool was selected to use as the query tool that facilitates clinical data reuse and integration 2, 3. The University of Kansas Medical Center (KUMC) established an i2b2 based Healthcare Enterprise Repository for Ontological Narration (HERON) incorporating patient demographics, diagnoses, laboratory results, and medication data from a clinical partner. The focus of this study is to add the clinical data observed by nurses. This was done since (1) parameters such as height, weight, and vital signs are common inclusion criteria for research protocols and (2) our clinical partners informed us of the challenges with maintaining the flowsheet ontology and validating proper utilization of terminology.
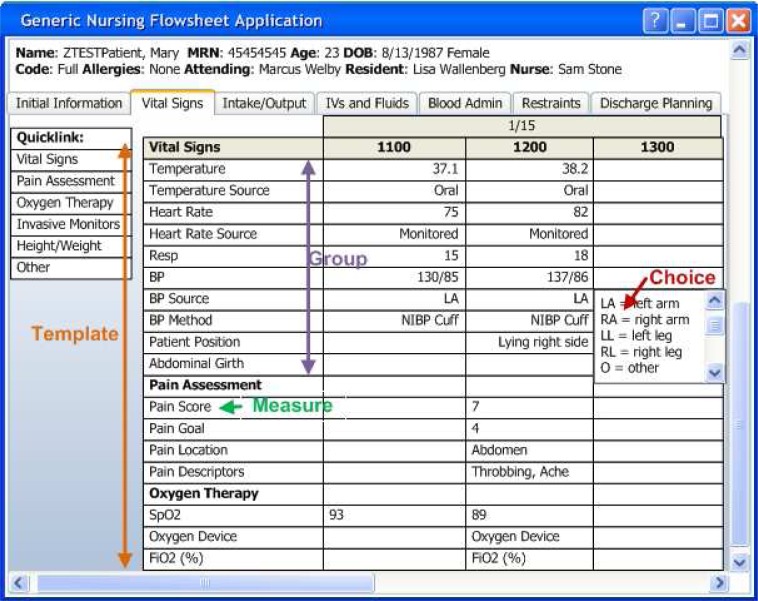
In the EHR, data entry is organized into a set of templates for documenting “Vital Signs”, “Intake/Output”, and “Restraints”. Within the “Vital Signs” template, there are groups for documenting related observations: “Vital Signs”, “Pain Assessment” and “Oxygen Therapy.” Each group contains individual measures that are observed and documented such as “BP” and “Heart Rate”. The measures are used to give contextual meaning to the choices such as 120, throbbing, left arm, etc. While many measures have numeric values (e.g. heart rate), the user interface allows documentation of discrete observations (choices) via structured lists (temp source, heart rate source) and free text (see Figure 1). .
Figure 1:
Vital Signs Template of a Flowsheet within the EHR
“Man’s achievements rest upon the use of symbols”4—the flowsheet is one of our best symbols in nursing. Our essential task was to create an ontology that would assist researchers in finding relevant clinical data in a de-identified data repository—HERON. The challenge was to create a structure within an interface to access information—we wanted to create findability or the quality of being locatable or navigable.5 Findability requires definition, distinction, and difference. We used SNOMED CT(c) to provide “definition” and the harmonizing of two world views, clinicians and researchers, to provide the “distinction and difference.” Even more important is when the information is in electronic format, it is “in the air,” available to all and, therefore, considered ambient. Morville urges us to consider that what we find, changes who we become and what we think. He calls this ambient findability.5 Our informatics goal is to create an ontology for our researchers that embraces ambient findability.
Research questions
What is the best structure/ontology—“distinction and difference”—of the clinical data to create ambient findability for researchers and quality improvement professionals who will be using the i2b2 tool?
Does SNOMED CT© provide a strategy for the “definition” the clinical concepts of interest for researchers? Can SNOMED CT© meet the needs for coded concepts in the navigation ontology?
Methods and Results
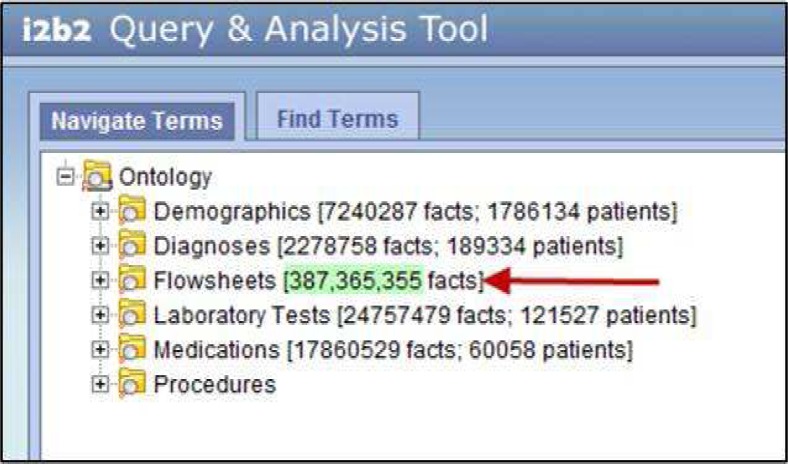
Two methods were used to study and create this new ontology that would foster ambient findability—focus groups and mapping to a standardized terminology. Two focus groups were conducted.6 The first group consisted of four nurse researchers from the school of nursing with expertise in instrument development, clinical trials, data mining, and effectiveness research. The group was selected based on these skill sets as breath of point of view concerning data was the phenomena of interest. We wanted the view of a nurse researcher who was familiar with the type of data but not the documentation system. Interestingly, they focused on how data would be formatted for them once it was extracted into a data set. Helping them to focus on the organization of the data from which to construct a data set to foster its visualization and retrieval was difficult. They finally decided they would like to see the navigation window to be organized by body systems and the nursing process. When asked if they would participate in phase two of the project to actually interact with the data in the ‘new’ ontology, all agreed and were excited about gaining access to the clinical data. The second focus group consisted of four nurses from the hospital that contributed the data. The expertise selected for membership in this group was quality improvement, clinical research, and nursing informatics (the chair of the Nursing Informatics Council). This group was to uncover the view of the practicing nurse who uses the data everyday but not in the care of patient—its secondary use. This group focused first on how the EHR was built and was used. Then they began to focus on the data and how they would like to access it and then to how it should be organized. They also recommended a body systems approach, but also wanted vital signs, pain assessment, and other safety measures to be made visible at the same level of body systems. Figure 2 depicts the highest ontology level in i2b2. It was the consensus of both groups to leave this level as it is as everyone understood the notion of flowsheets and what types of data would reside there. Both groups also agreed that a future enhancement would be to add care plan information, which comes from another module of the EHR, to the i2b2 ontology at this high level.
Figure 2.
High level ontology viewed in i2b2 of the data in HERON. The future request for care plan data is proposed to be at this level.
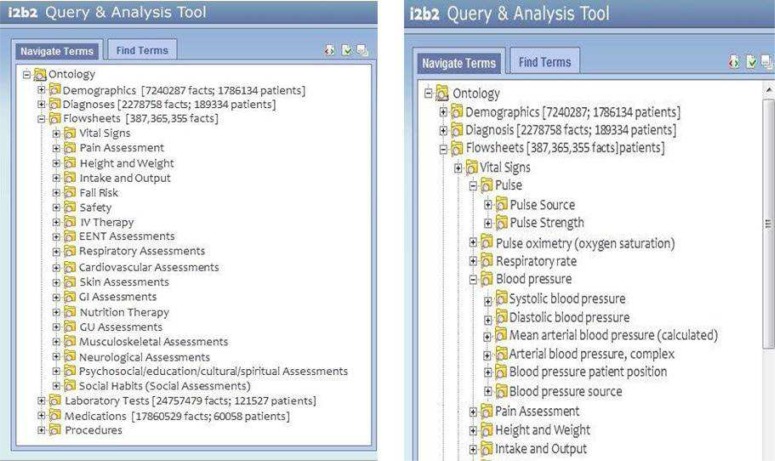
The final proposed ontology for i2b2 Flowsheet is comprise of 18 templates based on a harmonization of the results of the two focus groups. Both focus groups have validated the concepts, see Figure 3. The order is by importance of use for quality and meaningful use reports; the remaining concepts are alphabetized for ease of findability.
Figure 3.
On the left is the proposed flowsheets high level ontology to support multiple user view of the data that correspond to the groups on the EHR flowsheet. On the right is the expanded view of the proposed flowsheets ontology at the Measure level. (IV—intravenous; EENT—Ear Eye Nose Throat; GI—Gastrointestinal; GU—Genitourinary)
The next step was to map the Measures to the Groups. In the original ontology, redundancy of measures occurred and some measures, while different, measured the same thing. Measures were assigned to one and only one Group, thus insuring accurate finding of the data. Two informatics nurse researchers validated the placement based on evidence based, authoritative resources, and the SNOMED CT © observable hierarchy. Figure 3 demonstrated the nesting of the Measures within two of the groups.
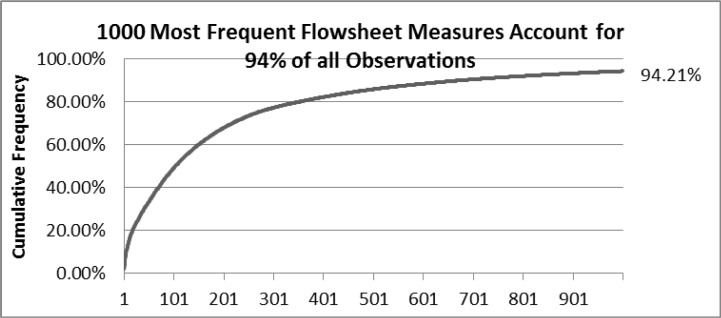
The second method of creating ambient findability was to map the Measures to SNOMED CT©. Since all the measures represent ‘things that can be measured,’ all concepts were mapped to concepts in the Observable hierarchy per guidelines from the International Health Terminology Standards Development Organization (IHTSDO).7 Furthermore, the mapping guidelines of understandable, reproducible, and useful were followed. Only the measures were mapped, not the choices (which would come from the Findings hierarchy and are part of the next stage of this project). Since there were over 6000 concepts to be mapped, the team decided to map the concepts that accounted for approximately 50% of the observations. One hundred measures met this criterion, see Figure 4.
Figure 4.
Cumulative percentage of flowsheet observations. Note that 100 concepts account for 130,382,588 observations or 49.13% of the observations for 36 months.
The measure concepts were then examined for relevance to the researcher. Flowsheets may contain not only clinical data but also regulatory information that needs to be documented. Regulatory data was identified in seven (7) measures: location of an allergy band, location of patient identity band, and whether safety plans had been instituted. These were determined to be irrelevant for researchers. Though if this repository is used for quality improvement studies, then these may be reconsidered for inclusion, though the concepts would be United States centric and not in SNOMED CT©. What was of interest to the researchers was the practice of bundling concepts up into one item for documentation. This was done when documenting body system assessments with “WDL—within defined limits” and whether the nurse “agreed with the last assessment.” These eleven (11) concepts were not mapped as SNOMED CT© was not designed to handle this approach; it maps one code to one concept. This practice of bundling needs to be studied separately from this project. Eighty-two concepts were then mapped.
Two informatics nurse researchers with skill in using SNOMED CT© independently mapped the 82 relevant concepts using the CliniClue browser 8 with the January 2011 release data. A comparison was then made between the two maps. Twenty concepts were not mapped the same. One researcher used post-coordination strategies and three codes from the staging and scales hierarchy. The second researcher agreed to the post-coordination strategy and her independent mappings matched. Finally it was determined that three scale names were used on the flowsheet. Since there was no IHTSDO guidance and use of the scale names captured the intent of the documented concept, these codes were used. Sixty-eight of the 82 concepts were mapped to SNOMED CT© for a coverage of 78%. Next the mappings were rated on a goodness of mapping scale.9 The scale used a rating of 2 for an exact match, 1 for a match to a parent, and 0 for no match. An overall goodness score of 1.56 was achieved, see Table 1.
Table 1.
| Types of Flowsheet concepts | Number of Concepts | Mapping Goodness Score | % SNOMED CT© coverage | |||
|---|---|---|---|---|---|---|
| Perfect match | Mapped to parent concept | No match | Weighted Score | |||
| Observables | 64 | 41 | 9 | 14 | 1.42 | 72% |
| Staging and Scales | 03 | 3 | 0 | 0 | 2.00 | 100% |
| Post-coordinated concepts | 16 | 15 | 1 | 0 | 1.94 | 97% |
| Total | 82 | 59 | 10 | 14 | 1.56 | 78% |
Implications
This methodology worked very well to create ambient findability in the i2b2 tool used with HERON—a view that most users, regardless of perspective, would know how to navigate. The next steps are to test the model with nurses of different specialties and other disciplines to see if the ontology supports their search and visualization needs. As seen from the cumulative percentage graft, the measures need to be reviewed as many are seldom used and some appear to represent like. Using this approach of viewing the measures in i2b2, a quality improvement tool might be developed and tested for the clinical agency to validate the modeling and representation of the measures within the flowsheet. Once the measures have been validated, they will be mapped to SNOMED CT©. The next project will be to examine the ‘choices’ attached to the measures and map them to the findings hierarchy of SNOMED CT©.
References
- 1.Nightingale F. Notes on Hospitals. London: Longman, Green, Longman, Roberts and Green; 1863. [Google Scholar]
- 2.Murphy SN, Weber G, Mendis M, Gainer V, Chueh HC, Churchill S, Kohane I. Serving the enterprise and beyond with informatics for integrating biology and the bedside (i2b2) J Am Med Inform Assoc. 2010 Mar-Apr;17(2):124–30. doi: 10.1136/jamia.2009.000893. [DOI] [PMC free article] [PubMed] [Google Scholar]
- 3. Informatics for Integrating Biology and the Bedside (i2b2). https://www.i2b2.org. [DOI] [PMC free article] [PubMed]
- 4.Korzybski A. Science and Sanity. Englewood, NJ: The International non-Aristotelian Library Publishing, Company; 1933. ( http://esgs.free.fr/uk/art/sands.htm) [Google Scholar]
- 5.Morville P. Ambient Finability. Sebastapol, CA: O’Reilly Media; 2003. [Google Scholar]
- 6.Krueger RA, Casey MA. Focus Groups: A Practical Guide for Applied Research. Thousand oaks, CA: Sage; 2008. [Google Scholar]
- 7.International Health Terminology Standards Development Organization www.ihtsdo.org.
- 8. CliniClue Browser, http://www.cliniclue.com.
- 9.Campbell JR, Carpenter P, Sneiderman C, Cohn S, Chute CG, Warren JJ, members of Work Group III of the Computer-based Patient Record Institute Phase II Evaluation of Clinical Coding Schemes: Completeness, Taxonomy, Mapping and Clarity. JAMIA. 1997;4:238–251. doi: 10.1136/jamia.1997.0040238. [DOI] [PMC free article] [PubMed] [Google Scholar]


