

Abstract
Circulating tumor cells (CTCs) provide a readily accessible source of tumor material from patients with cancer. Molecular profiling of these rare cells can lead to insight on disease progression and therapeutic strategies. A critical need exists to isolate CTCs with sufficient quantity and sample integrity to adapt to conventional analytical techniques. We present a microfluidic platform (IsoFlux) that uses flow control and immunomagnetic capture to enhance CTC isolation. A novel cell retrieval mechanism ensures complete transfer of CTCs into the molecular assay. Improved sensitivity to the capture antigen was demonstrated by spike-in experiments for three cell lines of varying levels of antigen expression. We obtained spike-in recovery rates of 74%, 75%, and 85% for MDA-MB-231 (low), PC3 (middle), and SKBR3 (high) cell lines. Recovery using matched enumeration protocols and matched samples (PC3) yielded 90% and 40% recovery for the IsoFlux and CellSearch systems, respectively. In matched prostate cancer samples (N = 22), patients presenting more than four CTCs per blood draw were 95% and 36% using IsoFlux and CellSearch, respectively. An assay for detecting KRAS mutations was described along with data from patients with colorectal cancer, of which 87% presented CTCs above the assay's limit of detection (four CTCs). The CTC KRAS mutant rate was 50%, with 46% of patients displaying a CTC KRAS mutational status that differed from the previously acquired tissue biopsy data. The microfluidic system and mutation assay presented here provide a complete workflow to track oncogene mutational changes longitudinally with high success rates.
Introduction
Circulating tumor cells (CTCs) disseminate into the blood from both primary and metastatic cancers and are believed to play a role in the spread of the disease throughout the body [1]. There has been considerable interest in analyzing these cells as a potential source of clinically actionable information relating to molecular profile of the patient's disease. CTCs can be accessed repeatedly and noninvasively and, thus, provide a clinically feasible methodology for tracking longitudinal changes in disease profile that is not readily accomplished with conventional biopsy approaches.
Numerous approaches have been employed to isolate and use CTCs for diagnostic and discovery applications. The CellSearch System (Veridex, Raritan, NJ) was cleared by the US Food and Drug Administration in 2004 as a prognostic test for breast cancer based on the enumeration of CTCs [2]. This platform uses immunomagnetic isolation of cells and immunofluorescence detection to count individual CTCs. Other platforms have been described in the literature or commercially released using alternative isolation modalities such as size-based separation, affinity capture, and imaging cytometry [3–5]. A key limitation of these technologies is the ability to release and recover viable intact CTCs for downstream molecular analysis. Cells that have been isolated onto antibody-coated microfluidic channels, porous filters, and glass slides often adhere tightly to their substrate and, thus, make it difficult to remove these cells for further analysis. Other limitations such as low cell recovery, low purity, and diminished viability have contributed to preventing widespread use of CTCs in the laboratory and clinical environments.
The IsoFlux System (Fluxion Biosciences Inc, South San Francisco, CA) was designed to address these limitations by providing high-sensitivity rare cell isolation coupled with a novel cell retrieval mechanism. The system uses immunomagnetic beads that facilitate use of single or multiple capture antibodies to target cells of a specific pathology. The sample passes through a microfluidic device that contains an isolation zone to capture CTCs on the upper surface of the cartridge in an externally applied magnetic field. The roof of the microfluidic channel decouples from the rest of the cartridge and transfers off-chip with the CTCs still retained on its surface, providing near perfect transfer efficiency. The resulting CTC sample remains suspended in a droplet of approximately 3 µl that can then be directly recovered into cell lysis buffer for molecular analysis or onto a microscopy slide for pathologic analysis. The low volume transfer is particularly well suited for molecular biology reactions that often have limited volumetric inputs on the order of 10 to 20 µl [6]. This overcomes previous limitations of other rare cell isolation techniques that often result in significantly larger volumes on the order of 350 µl to 1 ml to recover cells [7]. The IsoFlux System enables molecular characterization of intact viable CTCs or isolated DNA, RNA, or protein. The cells can be processed using techniques well known to the clinical and molecular biology field, including quantitative polymerase chain reaction (qPCR), fluorescence in situ hybridization, and next-generation sequencing.
Here, we present validation of the IsoFlux System and a qPCR mutational analysis assay for the KRAS gene. KRAS mutations have a 30% to 40% prevalence in colorectal cancer (CRC) and also appear in other tumor types such as pancreatic and non-small cell lung cancers. Presence of a mutation on this gene has been correlated with poor response to anti-epidermal growth factor receptor (EGFR) inhibitors such as panitumumab and cetuximab therapy [8]. Analytical validation was performed using three cancer cell lines spiked into healthy donor blood. Tumor cell lines that span a range of capture antigen surface expression to more closely approximate clinical samples were chosen. Experiments were performed to assess CTC recovery, sensitivity, linearity, variability, and purity. Cell transferability off-chip was also assessed to characterize the amount of cellular material that ends up in the downstream analysis. The mutation detection assay was characterized analytically using both genomic DNA (gDNA) and spiked blood samples to assess limits of detection (LODs), specificity, and sensitivity.
Clinical validation of the CTC to qPCR workflow was performed using blood samples from patients with CRC, who have had prior KRAS mutational analysis performed from a tissue biopsy. Interestingly, 46% of the patients had a mutational status on the CTCs that differed from the previously acquired tissue samples. This highlights the feasibility of using CTCs to track mutational status changes longitudinally for a large majority of patients with CRC.
Materials and Methods
Microfluidic Design and Control Instrumentation
The IsoFlux microfluidic cartridge contains three fluidic reservoirs that are connected by a microfluidic flow path on the bottom of the device (Figure 1A). The sample is loaded in the inlet and then flows through an isolation zone where the target cells are collected. The remaining background cells are collected in a waste well. After the sample has been passed through the channel, a wash buffer is introduced from the wash well.
Figure 1.

Microfluidic design and control instrumentation. (A) The microfluidic device for CTC isolation contains a sample inlet reservoir that feeds into a microfluidic channel. (B) A schematic depiction of the flow path consisting of two inputs (a sample and a wash buffer well), isolation region, and waste well. (C) The sample passes through an isolation zone where magnetically labeled cells are captured on the top of the channel in the presence of a magnet. After processing, the cells are retrieved inside the instrument by lifting the cap off the channel and securing it to either microfuge tube or holder to remove the target cells through pipetting (not shown). (D) Up to four microfluidic cartridges can be processed in parallel inside the instrument, which uses pneumatic-driven flow to process the samples.
The isolation zone is an expanded cavity that extends above the main flow channel (Figure 1B). The sample flows into this region at reduced velocities and sees an externally applied magnetic field from above the collection substrate. Targeted cells with magnetic beads are attracted to the roof of the isolation zone, whereas other unbound cells are biased from flow and gravitational forces to continue down the channel and into the waste well. The roof of the isolation zone is a polymeric disk that is separate from the construction of the main flow channel. At the conclusion of the sample processing, the disk decouples from the flow channel along with the magnet, keeping targeted cells apposed to it. Once the magnet is removed, the targeted cells can be recovered in a microfuge tube for downstream processing.
The microfluidic device is controlled with an attending benchtop instrument and embedded touch screen (Figure 1C). Fluid flow was controlled pneumatically from an externally supplied pressure inside the instrument. Up to four devices can be loaded into the instrument for parallel sample processing. Once inside the instrument, a pneumatic interface seals around the fluidic reservoirs contained within the cartridge. A diaphragm pump and electropneumatic regulator create a controlled operating pressure of 2 psi. This pressure gets distributed to the sample reservoirs to initiate flow through the microfluidic channel. Pressures are turned off and on using a bank of solenoid valves under microprocessor and embedded software control.
Analytical Blood Samples
Analytical samples were prepared to simulate cancer samples in experiments that rely on knowing the starting concentration of target cells. Healthy donor peripheral blood was obtained from a commercial supplier (AllCells, Emeryville, CA) under Institutional Review Board (IRB) consent. Blood was drawn into EDTA tubes (Vacutainer; BD, Franklin Lakes, NJ) and subsequently spiked with one of three cancer cell lines. MDA-MB-231 (breast cancer cell line), PC3 (prostate cancer), and SKBR3 (breast cancer) cells (ATCC, Manassas, VA) were used for analytical instrument performance validation experiments. MDA-MB-231 cells were also used for KRAS assay validation because this line harbors a known heterozygous KRAS G13D mutation. The cell lines used have been reported to span the range from low to high epithelial cell adhesion molecule (EpCAM) expression [9–11] and were selected to represent the variability seen in clinical samples. Cells suspended in a stock solution were first counted on a hemocytometer and then spiked into 7 ml of whole blood in varying concentrations.
Clinical Blood Samples
For comparative recovery studies, clinical samples were obtained from 22 patients with prostate cancer (Memorial Sloan-Kettering Cancer Center, New York, NY) under IRB consent. For qPCR studies, samples were obtained from 15 patients with metastatic CRC (Horizon Oncology Research Inc, Lafayette, IN) under IRB consent. Two tubes of 7 ml of whole peripheral blood were collected in EDTA tubes from each patient. Samples processed on the IsoFlux instrument were shipped overnight at room temperature in an insulated shipping cooler. All clinical samples were processed the next day within 36 hours of the initial blood draw. Previous studies found white blood cell (WBC) counts to be unaltered under these conditions for at least 3 days [12]. It is therefore our assumption that significant lysis does not occur within 36 hours. In our own experience, no significant difference in either CTC recovery or WBC backgrounds has been observed between different storage times ranging from day of draw (<6 hours) to overnight shipping (24–36 hours). In the future, careful studies using matched samples are needed to fully address the effect of EDTA storage time.
All patients with CRC had previously undergone tissue biopsy followed by KRAS mutational analysis performed before the blood draw for CTC isolation.
Sample Preparation
Blood tubes were processed to recover the peripheral blood mononuclear cell fraction. LeucoSep tubes (Greiner Bio-One, Monroe, NC) were prepared by adding 15 ml of Ficoll-Paque Plus (GE Healthcare, Pittsburgh, PA). The peripheral blood mononuclear cell fraction was recovered and resuspended in 1 ml of binding buffer (CTC Enrichment Kit; Fluxion Biosciences Inc). Immunomagnetic beads preconjugated with anti-EpCAM antibodies (CTC Enrichment Kit; Fluxion Biosciences Inc) were added directly to the sample and incubated for 2 hours at 4°C with passive mixing on a rotator.
CTC Isolation
Following the magnetic bead coupling step, samples were loaded into the inlet well of the microfluidic cartridge. Samples were flowed through the channel at a flow rate of 20 µl per minute by applying a head pressure of 2 psi to the inlet well. Each sample passed through the channel in less than 45 minutes. After processing, the disk containing the cells in a hanging drop is inserted into a holder (Figure 1). The isolated target cells were recovered off the isolation zone disk through pipetting and dispensed into a microfuge tube for further processing.
Enumeration Analysis
For analytical samples, the spiked cells were prelabeled with Cell-Tracker Green (Invitrogen, Carlsbad, CA) to provide a more accurate count of recovered cells. For IsoFlux enumeration, isolated target cells were recovered from the disk through pipetting and dispensed onto a standard slide for imaging. For matched CellSearch PC3 cell line spike-in experiments, cells were recovered using the CellSearch Profile Kit after magnetic separation. Instead of using the CellTracks analysis module, these cells were dispensed onto a standard slide and imaged using the same protocol as IsoFlux spike-in recovery experiments.
For clinical samples, immunofluorescence staining was performed using anti-cytokeratin (CK), anti-CD45, and Hoechst 33342 (nucleus) (CTC Enumeration Kit; Fluxion Biosciences Inc). Recovered CTCs were fixed with phosphate-buffered saline (PBS) buffer containing 1.8% formaldehyde, washed, and blocked with 1% goat sera in PBS. Cells were stained with rabbit polyclonal anti-human CD45 antibody followed by goat anti-rabbit antibody conjugated with Cy3. After permeabilization with 0.1% Triton X-100, cells were then stained with anti-CK (fluorescein isothiocyanate). For CK staining, we used antibody clone CK3-6H5, a pancytokeratin-specific antibody likely to recognize all simple epithelium CKs; it has been shown to bind CKs [7,8,13]. Stained CTCs were mounted in SlowFade Gold mounting media with Hoechst 33342 (Life Technologies Inc, Foster City, CA) to Sensoplate Glass-Bottom Multiwell Plates (Greiner Bio-One) for imaging.
Cells were scored as CTCs if they were CK+, CD45-, nucleated, and morphologically intact. The total cell count was determined by counting all nuclei and reported as a measure of sample purity. Imaging was performed using an inverted epifluorescence motorized microscope (AxioObserver Z1; Carl Zeiss, Oberkochen, Germany) and imaging software (BioFlux Montage; Fluxion Biosciences Inc). For matched CellSearch clinical samples, cells were analyzed using the same three markers [CK+, CD45-, and 4′, 6-diamidino-2-phenylindole+ (DAPI+)] using the CellTracks System from Veridex.
KRAS Mutational Analysis—CTC Samples
CTCs were pipetted off the recovery disk and dispensed into a microfuge tube in less than 20 µl of PBS. Cell pellets after PBS removal were stored at -80°C until processed for mutational analysis. Samples remained frozen from 2 to 4 months before processing. Whole-genome amplification was performed directly on recovered cells after cell lysis (REPLI-g UltraFast Mini Kit; Qiagen, Valencia, CA). Amplified gDNA was purified and eluted in 50 µl of AE buffer (QIAamp DNA Micro Kit; Qiagen) and used for qPCR. gDNA was tested for mutations using a panel of KRAS mutation assays (nucleotide changes of c.34G>T, c.34G>A, c.34G>C, c.35G>T, c.35G>A, c.35G>C, and c.38G>A, corresponding to amino acid changes of G12C, G12S, G12R, G12V, G12D, G12A, and G13D) using Competitive Allele-Specific TaqMan PCR (castPCR) reagents on a qPCR instrument (StepOne Plus; Life Technologies Inc) according to the manufacturer's recommended protocol [14]. For each point mutation, a different primer was used (Catalog Nos: KRAS_517, G12S; KRAS_518, G12R; KRAS_520, G12V; KRAS_521, G12D; KRAS_522, G12A; KRAS_527, G13C; KRAS_532, G13D). Each assay well on a 96-well PCR plate received 1 to 2 µl of amplified gDNA in 20-µl total volume.
KRAS Mutational Analysis—Biopsy Samples
Two methods were used, as described for each patient in the patient table: Sanger sequencing and PCR.
Sanger sequencing. DNA sequencing is considered the gold standard for detection of mutations. This method allows determination of the order of nucleotides in a target DNA sequence. The Sanger chain-termination method is commonly used in molecular diagnostic laboratories. In this method, the incorporation of a chemically modified nucleotide (dideoxynucleotide) terminates extension of the DNA strand at the point of incorporation. This results in a mixture of DNA fragments of various lengths. Each dideoxynucleotide (A, T, C, or G) is labeled with a different fluorescent dye, allowing their individual detection. The newly synthesized and labeled DNA fragments are separated by size through capillary gel electrophoresis. The fluorescence is detected by an automated sequence analyzer (i.e., ABI 3730; Applied Biosystems Inc, Carlsbad, CA), and the order of nucleotides in the target DNA is depicted as a sequence electropherogram. A KRAS mutation will appear as the presence of both mutant and wild-type KRAS alleles (two overlapping peaks) at the particular nucleotide that is mutated. The analytic sensitivity of this method is reported to be 10% to 30% of mutant KRAS in a background of wild-type sequence [15].
Polymerase chain reaction. DNA is isolated from the sample, quantified, and amplified by PCR using primers to exon 2 of the KRAS gene. PCR products are subjected to single nucleotide primer extension to detect mutations at codons 12 and 13; primer extension products are analyzed using gel electrophoresis and fluorescence detection. False positive or negative results may occur for reasons that include genetic variants or somatic heterogeneity of the tissue sample.
Statistical Analysis
Data are reported as means ± SEM except where noted.
Results
Analytical CTC Recovery and EpCAM Sensitivity
CTCs appear in very low concentrations in the peripheral blood of patients with cancer and, as such, must be captured with high efficiency to enable diagnostic testing. Recovery efficiency was tested on the IsoFlux System using model CTC samples that allow for control of the starting tumor cell number and EpCAM expression level. Three model tumor cell lines (MDA-MB-231, PC3, and SKBR3) were spiked into 7 ml of healthy donor blood. The cell lines were selected to span a range of EpCAM expression levels from low (MDA-MB-231 at 2.3x background fluorescence and PC3 at 6x background fluorescence) to high (SKBR3 at 25x background fluorescence) to approximate clinical conditions while challenging the binding ability of the capturing antibody [9–11]. Recovery linearity was measured using the PC3 cell line spiked in at levels from 20 to 300 target cells per 7 ml of blood, in triplicate. For PC3 and MDA-MB-231 cells, the average recovery percentage across all spike-in levels was 73% and 81%, respectively, with an SD of 16% and 27% (Figure 2, A and B). Linear fits to PC3 and MDA-MB-231 results yielded R2 values of 0.93 and 0.54 with slopes of 0.75 and 0.74, respectively (75% and 74% of cells captured; Figure 2, C and D). The fits offer a better approximation of the percent recovery as opposed to average recovery numbers.
Figure 2.

CTC capture efficiency and linearity using tumor cell lines. Model CTC samples were prepared by spiking PC3 (A) and MDA-MB-231 (B) cells into tubes of healthy donor blood in concentrations ranging from 20 to 300 total target cells per tube. Average CTC capture efficiency was 73% and 81% with an overall SD of 16% and 27%, respectively. Standard errors are shown for each spiked concentration. (B) CTC capture levels varied linearly with spike-in concentration (C and D). R2 values were 0.9 and 0.5 with slopes of 0.75 (75% of cells captured) and 0.74.
Tumor cell line recovery as a function of EpCAM expression is summarized in Figure 3. The recovery percentages using the IsoFlux (Figure 3, filled square markers) are 74%, 75%, and 85% for MDAMB-231 (n = 7), PC3 (n = 38), and SKBR3 (n = 8), respectively. For PC3 cells, solid triangles represent matched sample results that were run on either CellSearch (blue) or IsoFlux (red) using exactly the same cell counting protocols. Matched CellSearch PC3 data showed a recovery rate of 40%, compared to 80% using the IsoFlux System (n = 4 samples each). Open circles represent literature data for Cell-Search spike-in recovery from MDA-MB-231 cells at 12% [10] and SKBR3 cells at 90% [9].
Figure 3.

Recovery dependence on EpCAM expression. A comparison of recovery rates for three different tumor cell lines is shown. Mean results using the IsoFlux System are plotted with standard error bars (solid squares) for three cell lines: MDA-MB-231 (n = 7), PC3 (n = 38), and SKBR3 (n = 8). Solid triangles represent matched sample results (n = 4 samples each) that were run on either CellSearch (blue) or IsoFlux (red) using exactly the same cell counting protocols. Open circles represent literature data for Cell-Search spike-in recovery from two of the cell lines studied: MDA-MB-231 [10] and SKBR3 [9].
Sample Transfer Efficiency
Another area of concern for CTC capture technologies is the loss of sample during the retrieval process. While many platforms can count the number of CTCs directly on the capture substrate (e.g., filter, microfluidic channel, and so on), it remains challenging to retrieve the CTCs off-chip with high fidelity. The IsoFlux System uses a low-adherence polymer disk to capture cells and transfer them with high efficiency to a secondary collection vessel (e.g., microfuge tube, microscopy slide) for further processing. To characterize this, a series of spiked samples (PC3 cells) that fell in the range of 40 to 60 cells (N = 12) or 90 to 120 cells (N = 8) per 7 ml of blood were prepared. After processing each sample on the IsoFlux instrument, half of the samples were enumerated directly on the recovery disk and the remaining half were transferred off the disk using the standard recovery protocol onto microscopy slides. Average recovery measured directly from the retrieval disk was 75% and 68% for the 40 to 60 cel lgroup and 90 to 120 cell group, respectively. Average recovery measured from the microscopy slides was 72% for the 40 to 60 cell group and 64% for the 90 to 120 cell group. The total cell loss in the recovery process was statistically insignificant, but percent recovery was 3% to 4% lower on average when undergoing an additional transfer step (Figure W1).
Clinical CTC Recovery Data (Prostate Cancer Samples)
Matched patient samples were processed using the CellSearch and IsoFlux platforms to measure the effects of increased sensitivity on clinical samples. Two blood tubes were processed from each patient to assess the level of CTCs recovered (Figure 4). For both systems, CTCs were defined as CK+, CD45-, nucleated, and intact (Figure 7). In this test group, IsoFlux yielded 21 of 22 patients (95%) with CTC counts above the mutation assay LOD of four cells; CellSearch yielded 8 of 22 patients (36%) with CTC counts above the four-cell LOD.
Figure 4.

CTC recovery from matched clinical samples. Matched samples from 22 patients with prostate cancer were used to compare CTC recovery using the IsoFlux System compared to the CellSearch platform that is also based on immunomagnetic separation. For concomitantly drawn 7.5 ml of blood samples, counts are presented using the two platforms; in both cases, immunostaining was used to identify CTCs as cells that are CK+, CD45-, and DAPI+ (nucleated).
Figure 7.
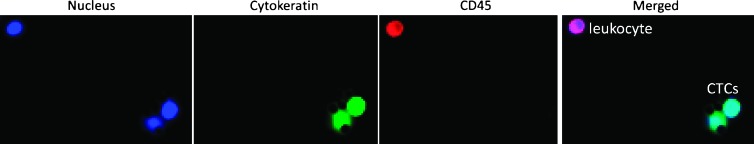
Representative images of CTCs and background WBCs from patients with CRC. CTCs were enumerated using immunofluorescence staining for CK (fluorescein isothiocyanate, green), CD45 (Cy3, red), and nucleus (Hoescht 33342, blue). A CTC is defined as CK+, CD45-, DAPI+, and morphologically intact.
Analytical Validation of Mutational Analysis Assay
A qPCR assay was developed to detect a panel of seven clinically relevant KRAS point mutations. The test uses castPCR mutation detection assays (Life Technologies Inc). castPCR is a highly specific and sensitive method for detecting and quantitating rare mutations in a sample that contains large amounts of wild-type gDNA. The technology combines allele-specific TaqMan qPCR with allele-specific minor groove binder (MGB) blockers to suppress nonspecific amplification from wild-type alleles, resulting in better specificity than traditional allele-specific PCR [14]. Each castPCR assay consists of a mutant assay and a reference assay. The principle readout of the assay is the difference in threshold cycles (Ct) between the mutant and reference assays, known as dCt. A mutation detection cutoff is established by running wild-type control samples and subtracting a safety margin of 2 Ct to differentiate between wild-type sample and sample containing mutant gDNA.
The KRAS mutation detection assay was first characterized using titrated amounts of mutant gDNA from an MDA-MB-231 cell line that harbors a heterozygous KRAS G13D mutation. Varying amounts of MDA-MB-231 gDNA ranging from 0 to 128 cell equivalents (6 pg gDNA/cell) were added to 60 ng of Jurkat cell gDNA or the equivalent of 10,000 wild-type cells. A high level of background gDNA was selected to challenge the assay because this level is 5- to 10-fold higher than samples typically recovered from the device. Experiments were performed in triplicate below four copies to resolve the lower LOD and in duplicate above four copies. The pure wild-type samples had average dCt values of 23.3 (Figure 4). The mutation detection cutoff value was set at 21. Samples are determined to contain mutant if the dCt falls below this cutoff value. The assay was found to reliably detect mutant down to four copies. Below this level, some samples fell above the mutation detection cutoff and some fell below, suggesting that four copies is a good approximation of the assay LOD.
Next, we prepared a set of model CTC samples to assess the LODs using more realistic conditions and the complete assay workflow. The same tumor cell line (MDA-MB-231) was spiked at concentrations of 0 to 200 cells into vials of 7 ml of healthy donor blood. Each spiking concentration was prepared in triplicate and processed on the IsoFlux System. One sample from each concentration was enumerated and used to assess cancer cell recovery and background. The remaining two samples from each concentration were used in the qPCR mutation assay. Samples containing as few as nine recovered tumor cells were detected on the qPCR mutation assay with a dCt value around 15, well below the detection cutoff of 21 (Figure 5). Healthy control samples with no mutant cell spike in had dCt values around 23, which is above the detection cutoff. The results of this experiment were consistent with the gDNA titration experiments and confirmed that the complete assay workflow is sensitive down to single-digit copy levels of mutant DNA.
Figure 5.

KRAS mutation assay LODs using purified gDNA. Varying levels of G13D mutant gDNA were mixed with high wild-type background (10,000 wild-type cells) and analyzed with a KRAS G13D mutant assay and KRAS reference assay. The Ct difference between KRAS mutant and wild-type assays (dCt) was calculated. KRAS mutation is detected when the dCt is below the cutoff dCt value generated with pure wild-type gDNA (green line). Samples containing four cell equivalents of mutant gDNA in a background equivalent of 10,000 wild-type cells were consistently detected.
Clinical Mutational Study of CRC Patient Samples
Clinical evaluation of the KRAS mutation detection assay was performed on 15 patients with CRC. Patients ranged from local (stage I) disease to metastatic (stage IV) disease (Table 1). Patients had previously undergone tissue biopsy followed by KRAS mutational analysis. The elapsed time between the primary tissue biopsy and the blood collection for CTC analysis was 1 to 2120 days (Table 1). Each patient had two tubes of blood drawn. One was used for enumeration, and the other was tested for KRAS mutational status.
Table 1.
Patient Information, CTC Counts, Tumor Staging, CTC and Biopsy Mutational Status, and Treatment Status of Colorectal Cancer Patients in the Study.
| Patient | Age/Sex | CTC Count | Tumor Stage | CTC KRAS Status | Biopsy KRAS Status/Method | Treatment | Disease State | Total Cell Count | Time from Biopsy to CTC Collection (Days) |
| 1 | 61/F | 16 | I | G12D | Not tested/N/A | N/A | N/A | 2050 | N/A |
| 2 | 64/M | 17 | IV | Wild type | Wild type/PCR | Avas & Fol/Ava, 5-FU, Leu/Cli | Stable | 1659 | 2120 |
| 3 | 49/F | 93 | II | Wild type | Wild type/Sanger | None | N/A | 12,911 | 1 |
| 4 | 54/M | 600 | IV | Wild type | Wild type/PCR | Lav, 5-FU/FOL/Fol, Erb/Cli/FOL | Progressive | 7314 | 699 |
| 5 | 58/F | 7 | IV | G13D | Wild type/Sanger | FOL | N/A | 1129 | 148 |
| 6 | 71/M | 71 | IV | G12D, G12A | G12C/PCR | 5-FU | N/A | 3462 | 1098 |
| 7 | 73/M | 23 | IIIB | G13D | Wild type/Sanger | FOL/5-FU, Leu/Fol/FOL/5-FU, Eu/Cli/5-FU | Progressive (expired) | 1389 | 69 |
| 8 | 59/M | 0 | IV | Wild type | Wild type/Sanger | FOL, Ava/Fol, Erb/Cli | Stable | 1148 | 994 |
| 9 | 67/M | 18 | IV | Wild type | Wild type/Sanger | Oxa/Cli | N/A | 5040 | 337 |
| 10 | 62/M | 83 | II | G13D | Wild type/Sanger | 5-FU | N/A | 2484 | 74 |
| 11 | 69/M | 27 | II | Wild type | Wild type/Sanger | 5-FU | N/A | 2213 | 1076 |
| 12 | 26/F | 56 | IV | Wild type | G13D/Sanger | FOL, bev/Fol, bev | Progressive | 1729 | 223 |
| 13 | 63/M | 82 | III | G13D | Wild type/Sanger | FOL/Fol/5-FU, Leu/Fol, Ava/FOL, Ava | Progressive | 887 | 414 |
| 14 | 64/M | 0 | IV | Wild type | Wild type/Sanger | 5-FU, radiation/FOL/FOL, Ava | Partial response | 924 | 670 |
| 15 | 75/M | 18 | IIB | G13D | Wild type/PCR | None | N/A | 1098 | 1 |
Treatments administered: Folfiri (Fol), FOLFOX (FOL), 5-FU, Avastin (Ava), Leucovorin (Leu), bevacizumab (bev), Erbitux (Erb), cetixumab (cet), or clinical trial participation (Cli).
One tube of blood was processed from each patient to assess the level of CTCs and background cells using immunofluorescence methods previously described. Cells were defined as CTCs if they were CK+, CD45-, nucleated, and met size and morphologic criteria (Figure 7). In this test group, 13 of 15 (87%) patients had CTC counts above the KRAS mutation assay LOD of four cells. The median CTC count was 25 CTCs. Total nucleated cells were also measured to assess the level of sample purity. Median total cell count was 1890 cells, resulting in a median CTC purity of 1.4%.
KRAS mutations were detected in 7 of 15 CTC samples (47%) from patients with CRC. This level is slightly higher than the reported frequency of KRAS mutations in primary colorectal tissue samples [8]. In the cohort that initially tested wild type on the primary biopsy test, 5 of 11 (45%) of these patients were found to have an acquired mutation in their CTC samples. These five patients had between 1 and 414 days elapsed between their primary biopsy collection and CTC blood draw. For the two patients that initially had a mutation in the primary tissue biopsy, one of them exhibited a different point mutation in their CTC sample (patient 6) and the other showed wild type in their CTC sample (patient 12). A summary of results is shown in Figure 8.
Figure 8.

Summary of colorectal cancer test group.
Discussion
CTCs provide a potential source of tumor cells that can be analyzed at the molecular level to help inform patient treatment decisions. A first generation of devices has been made available to isolate CTCs for enumeration and other forms of image-based analysis, such as immunohistochemistry and fluorescence in situ hybridization. There still remains a significant challenge in recovering sufficient levels of tumor cell material to exceed the LODs of the available analytical platforms such as qPCR, digital PCR, and next-generation sequencing. Obtaining the requisite level of tumor cell material depends on both the isolation efficiency of the platform and the transfer efficiency of the cells from the device to the downstream analysis. Here, we present a device for isolation of CTCs that overcomes both of these limitations.
The IsoFlux System uses immunomagnetic beads to positively isolate CTCs based on surface-expressed markers. This approach was chosen over other methodologies to allow for selection of specific subgroups of target cells for analysis based on the disease classification. While this study employed the use of anti-EpCAM antibodies for isolation of CTCs still retaining this epithelial marker, other antibody combinations can readily be used to isolate other types of CTCs, such as ones undergoing epithelial-to-mesenchymal transition or for cells displaying stem cell markers. This capability has a distinct advantage over physical isolation approaches such as size filtration. It has been shown that CTCs have a broad distribution of size, including cells that are as small or smaller than WBCs and thus are not efficiently isolated with a filter of a singular size threshold [11,16].
To characterize CTC recovery efficiency analytically, a number of groups have performed experiments recovering cancer cell lines of varying EpCAM expression levels from whole blood [9,10]. While cell lines do not reproduce in vivo heterogeneity, spike-in experiments have the advantage of yielding a percent recovery metric for the systems employed. When characterized using fluorescent EpCAM antibody binding (either by microscopy or by flow cytometry), tumor cell lines present a wide range of EpCAM expression, from about 2x to 50x the signal from non-EpCAM-expressing controls [10,11]. For ex vivo tumor cells dissociated from primary tumors, the expression levels are heterogeneous and also span a large range of over an order of magnitude in terms of EpCAM expression [9].
Much of the analytical data characterizing EpCAM-based CTC isolation has been obtained on the CellSearch System; thus, we have compared the IsoFlux System to CellSearch performance as a benchmark. An advantage of analytical recovery experiments is the ability to obtain unambiguous counting results if cells are fluorescently labeled before the spike-in step, a method we employed in all of our analytical experiments. CellSearch performs very well for cell lines that are high EpCAM expressers like SKBR3 and MCF7 (recovery >80%), but the literature consistently reports lower recovery for lower EpCAM expressers [9,10]. For example, Punnoose et al. report recovery of >75% for SKBR3 cells, but lower recovery of only 42% for the lower EpCAM CAL-120 cell line, with a trend to even lower recovery (25%) when samples were stored for 48 hours [9]. Sieuwerts et al. report recovery of only 12% for the low expression cell line MDA-MB-231 and recovery from 30% to 60% for other middle expression breast cancer cell lines [10]. In this study, we have used three cell lines that span the range from low to high EpCAM expression: MDA-MB-231 at 2.3x control, PC3 at 6x control, and SKBR3 at 25x control. Significantly higher recovery of MDA-MB-231 and PC3 cells (74% and 75%, respectively) for the IsoFlux System indicates a higher sensitivity to EpCAM of this microfluidic immunomagnetic approach compared to the bulk immunomagnetic approach used by the CellSearch System (Figure 3). For PC3 cells that are middle EpCAM expressers [11], we directly compared the two platforms by using the IsoFlux System and the CellSearch Profile Kit for extracting cells and analyzing the samples using the same cell staining protocols, the same imaging platform, and the same counting methodology. We believe that identical counting protocols are important in that they remove any bias due to cell staining, microscopy, or image analysis that might otherwise occur. That experiment yielded roughly twice the number of PC3 cells recovered by IsoFlux compared to CellSearch (90% and 40% recovery, respectively; Figure 3).
The hypothesis that higher system sensitivity to EpCAM leads to improved CTC recovery is also supported by matched patient sample data in a prostate cancer cohort (Figure 4). A large number of patients that presented no CTCs using CellSearch displayed CTCs above the qPCR assay LOD (four cells) using the IsoFlux micro-fluidic platform. Ninety-five percent of patients tested with the IsoFlux Sytem had CTCs above the qPCR LOD compared to 36% using CellSearch. This greatly improves the successful read rate for the qPCR assay presented, as at least five CTCs are required for the mutation detection protocol to yield reliable results. For the samples enumerated here, CTC identification followed the same definition employed by the CellSearch System: Tumor cells are defined as being CK+, CD45-, and DAPI+ (nucleated) by microscopic evaluation. While these prostate patient sample counts are significantly higher with respect to previous publications using CellSearch and immunomagnetic separation, they are consistent with a recent publication by Ozkumur et al. using a sensitive microfluidic technology in the research setting [11]. Our colorectal patient cohort showed a similar CTC count distribution for patients with prostate cancer, with 87% of patients above the assay LOD of four cells, compared to literature values of 23% using the CellSearch System [17].
The IsoFlux System has been optimized to maximize recovery of low EpCAM-expressing cells by varying the microfluidic capture zone dimensions, the velocity of cells in the capture zones (flow rate), and magnetic bead coupling reaction. It is difficult to compare this approach to other bulk immunomagnetic approaches, such as Cell-Search, because the cartridge dimensions, magnetic forces, bead reagent magnetic moments, and hydrodynamic forces are not known for other platforms. However, there are a few important differences of this microfluidic flow-based approach with respect to bulk immunomagnetic separation used in previous CTC recovery reports.
First, flow is used to direct cells across a high magnetic field isolation zone (below 1 mm2) at a known velocity (v = 0.37 mm/s). This controls both the magnetic force applied to each bead and the cell's residence time in the isolation zone and results in improved capture efficiency (Figure 1). Unlabeled background WBCs only experience gravitational forces directed toward the bottom of the channel and hydrodynamic forces due to flow that cause cells to continue past the isolation zone and into the waste reservoir. This is different from a bulk (no flow) approach, whereby the entire holding volume needs to be exposed to the magnetic field gradient. The microfluidic approach leads to reduced background contamination and results in a median target cell purity of 1.4% (CTC count/total cell count x 100%), which is appropriate for the qPCR assay described. Immunomagnetic CTC recovery in a microscale flow channel was demonstrated in a recent publication [11], whereby cells were deflected while passing through a high magnetic field region. Similar to our results, Ozkumur et al. found improved CTC numbers from prostate samples compared to CellSearch (62% of patients above four CTCs) and higher recovery from low EpCAM-expressing cell lines like PC3 (>85% recovery).
Second, the off-chip recovery is improved by retaining cells on a collection surface that is decoupled from the flow path and becomes part of the collection chamber. We have characterized the loss due to off-chip transfer to be below 5% (Figure W1). In contrast, other methods rely on removal of the magnetic field and extensive flushing of the capture cartridge.
Third, the beads used in the IsoFlux System have larger diameter (4.5 µm) and therefore have a larger magnetic moment compared to nanoscale particles employed by the CellSearch System. This effectively means that target cells can be isolated with far fewer beads attached, as the magnetic moment scales with bead volume. This is likely to contribute to the higher sensitivity, where low antigen levels are present on the cell surface.
A key development of this platform is the ability to efficiently transfer CTCs to the downstream analysis. Several CTC isolation systems that are primarily limited to image-based analysis directly on the capture device have been reported [9–11,16–21]. It remains a challenge to isolate CTCs and transfer them in a format that is optimal for molecular analysis. The key requirements include high CTC recovery, high viability of the captured cells, minimal background contamination, and low elution volume. The removable isolation zone disk transfers the CTCs off the cartridge in a hanging droplet of approximately 3 µl. This low-volume droplet can then be transferred to a recovery tube through pipetting into a 10 to 20 µl of collection buffer volume that can vary according to the requirements of the downstream assay. Many state-of-the-art molecular analysis systems have limited volumetric inputs of sample around 10 to 20 µl that can be loaded into a single channel or well [19]. Thus, it is important to deliver a concentrated sample that fits into the volumetric limits or there will be some sacrifice to the sensitivity of the platform.
Once the CTC sample is transferred away from the system, there are many types of biomarker analysis platforms that can offer clinically useful information. Here, we present a qPCR mutation detection assay that can be applied to identify a large number of known oncogene mutations. As an example, we interrogated a panel of seven clinically relevant point mutations on the KRAS gene. KRAS mutations are frequently found in carcinomas such as colorectal, lung, and pancreatic cancers [20]. Patients identified as having a KRAS mutation have been shown to not respond to EGFR-targeted therapies such as bevacizumab, cetuximab, and panitumumab [21]. The assay developed here uses the castPCR mutation detection technology. castPCR technology combines allele-specific TaqMan qPCR with allele-specific MGB blockers to suppress nonspecific amplification from wild-type alleles, resulting in better specificity than traditional allele-specific PCR, improving the overall sensitivity and specificity of the assay. The assay was evaluated analytically using titrated gDNA and shown to detect down to four copies of target DNA in a background of 10,000 wild-type cells (Figure 5), a background far exceeding the median background of below 2000 cells observed in clinical samples. It was also confirmed using spiked cell samples on the IsoFlux System that mutations could be detected in samples containing as few as nine target cells (Figure 6). Two separate blood tubes were used to obtain both enumeration and matched qPCR data; the development of protocols that can transfer the same sample from imaging to downstream molecular work is a planned future development.
Figure 6.

Assay LODs using model CTC samples. Varying levels of KRAS G13D mutation-positive tumor cells (MDA-MB-231) were spiked into healthy donor blood and processed on the IsoFlux System. gDNA was amplified, purified, and tested for KRAS mutations. The Ct difference between KRAS mutant and wild-type assays (dCt) was calculated. Samples having as few as nine recovered tumor cells were detectable using the qPCR assay. Healthy control samples remained above the mutation detection cutoff.
Recovering measurable CTCs in a high percentage of patients is an important factor in establishing the clinical utility of the system. A recently published study also aimed at determining KRAS status for patients with CRC using the CellSearch System concluded that improvements would be needed to extract mutational data from a majority of patients [17], as only 36% of patients were over a 3 CTC threshold. This is in agreement with other CRC CellSearch studies reporting CTC positive (>2) patient fractions of 52.5% and 49%, respectively [18,22]. In contrast, the IsoFlux System isolated more than seven CTCs from 87% of patients with CRC in our 15-patient cohort, which is well above the mutation assay LODs. We measured a 40% discordance between primary biopsy and CTC status that is comparable to literature value of 50% reported by Fabri et al. [18]. Mostert et al. [17] reported 25% discordance between primary tumor and metastatic sites but had insufficient data to correlate tissue-based KRAS status with CTCs. Gasch et al. performed single-cell CTC analysis and found significant heterogeneity within CTCs coming from a single patient (5 of 15 CTCs were KRASmt). However, they did not report overall agreement with primary tumor KRAS status.
One of the likely explanations for this is that the patients acquired the KRAS mutation in the elapsed time between the tissue biopsy and blood collection for CTC analysis. We did find one patient with KRASmt primary tissue but KRASwt CTC results; while this is unusual, it does agree with the results of Mostert et al. [17], wherein two patients presented CTC counts above their LOD but were CTC KRASwt despite being KRASmt in tissue samples. This may be due to tumor heterogeneity, which has been well documented [18]. The patient disease status (stable vs progressive) and treatment history are presented in Table 1. There is a statistically significant difference between the CTC counts of patients with progressive disease, median of 56 ± 15 (standard error, n = 4), and patients that were either not categorized, 18 ± 12 (standard error, n = 9), or stable,8.5 ± 12 (standard error, n = 2). Average numbers of CTCs detected per patient also increased with stage: stage I with 16 CTCs (n = 1), stage II with 55 ± 38 (n = 4), stage III with 53 ± 30 (n = 2), and stage IV with 96 ± 73 (n = 8). Patients 2 and 4 had received cetuximab (Erbitux), a KRAS-dependent EGFR inhibitor, during the course of treatment. Both were KRASwt by both CTC and primary biopsy tests. Patient 2 is stable, whereas patient 4 has progressive disease. The patients that acquired CTC KRAS mutations but were KRASwt as per the original biopsy were all undergoing chemotherapy treatment [Folfiri, FOLFOX, 5-fluorouracil (5-FU)]. Larger studies will be required to determine the correlation between CTC mutational status and response to anti-EGFR therapy in a statistically significant way. Further studies are warranted to track individual patients across multiple time points and to more closely compare the CTC mutational status to that of the primary and metastatic tumors (i.e., by obtaining tissue and blood at the same time point).
The ability to track clinically relevant biomarkers longitudinally is one of the primary advantages of CTCs as a biomarker. This study highlights a workflow that allows profiling of CTC mutational status in the patient population over time for a majority of patients.
Supplementary Material
Acknowledgments
We express our gratitude to all the patients who participated in this study and healthy volunteers who contributed blood samples.
Footnotes
A.F., T.T., M.S., and C.I.-Z. are employees of Fluxion Biosciences Inc and own shares.
This article refers to supplementary material, which is designated by Figure W1 and is available online at www.transonc.com.
References
- 1.Parkinson DR, Dracopoli N, Petty BG, Compton C, Cristofanilli M, Deisseroth A, Hayes DF, Kapke G, Kumar P, Lee JSH, et al. Considerations in the development of circulating tumor cell technology for clinical use. J Transl Med. 2012;10:138. doi: 10.1186/1479-5876-10-138. [DOI] [PMC free article] [PubMed] [Google Scholar]
- 2.Allard WJ, Matera J, Miller MC, Repollet M, Connelly MC, Rao C, Tibbe AG, Uhr JW, Terstappen LW. Tumor cells circulate in the peripheral blood of all major carcinomas but not in healthy subjects or patients with nonmalignant diseases. Clin Cancer Res. 2004;10(20):6897–6904. doi: 10.1158/1078-0432.CCR-04-0378. [DOI] [PubMed] [Google Scholar]
- 3.Desitter I, Guerrouahen BS, Benali-Furet N, Wechsler J, Jänne PA, Kuang Y, Yanagita M, Wang L, Berkowitz JA, Distel RJ, et al. A new device for rapid isolation by size and characterization of rare circulating tumor cells. Anticancer Res. 2011;31(2):427–441. [PubMed] [Google Scholar]
- 4.Sequist LV, Nagrath S, Toner M, Haber DA, Lynch TJ. The CTC-chip: an exciting new tool to detect circulating tumor cells in lung cancer patients. J Thorac Oncol. 2009;4(3):281–283. doi: 10.1097/JTO.0b013e3181989565. [DOI] [PMC free article] [PubMed] [Google Scholar]
- 5.Hsieh HB, Marrinucci D, Bethel K, Curry DN, Humphrey M, Krivacic RT, Kroener J, Kroener L, Ladanyi A, Lazarus N, et al. High speed detection of circulating tumor cells. Biosens Bioelectron. 2006;21(10):1893–1899. doi: 10.1016/j.bios.2005.12.024. [DOI] [PubMed] [Google Scholar]
- 6.Kristensen LS, Kjeldsen TE, Hager H, Hansen LL. Competitive amplification of differentially melting amplicons (CADMA) improves KRAS hotspot mutation testing in colorectal cancer. BMC Cancer. 2012;12:548. doi: 10.1186/1471-2407-12-548. [DOI] [PMC free article] [PubMed] [Google Scholar]
- 7.Jiang Y, Palma JF, Agus DB, Wang Y, Gross ME. Detection of androgen receptor mutations in circulating tumor cells in castration-resistant prostate cancer. Clin Chem. 2010;56(9):1492–1495. doi: 10.1373/clinchem.2010.143297. [DOI] [PubMed] [Google Scholar]
- 8.Arrington AK, Heinrich EL, Lee W, Duldulao M, Patel S, Sanchez J, Garcia-Aguilar J, Kim J. Prognostic and predictive roles of KRAS mutation in colorectal cancer. Int J Mol Sci. 2012;13(10):12153–12168. doi: 10.3390/ijms131012153. [DOI] [PMC free article] [PubMed] [Google Scholar]
- 9.Punnoose EA, Atwal SK, Spoerke JM, Savage H, Pandita A, Yeh R, Pirzkall A, Fine BM, Amler LC, Chen DS, et al. Molecular biomarker analyses using circulating tumor cells. PLoS One. 2010;5(9):e12517. doi: 10.1371/journal.pone.0012517. [DOI] [PMC free article] [PubMed] [Google Scholar]
- 10.Sieuwerts AM, Kraan J, Bolt J, Van der Spoel P, Elstrodt F, Schutte M, Martens JWM, Gratama JW, Sleijfer S, Foekens JA. Anti-epithelial cell adhesion molecule antibodies and the detection of circulating normal-like breast tumor cells. J Natl Cancer Inst. 2009;101:61–66. doi: 10.1093/jnci/djn419. [DOI] [PMC free article] [PubMed] [Google Scholar]
- 11.Ozkumur E, Shah AM, Ciciliano JC, Emmink BL, Miyamoto DT, Brachtel E, Yu M, Chen PI, Morgan B, Trautwein J, et al. Inertial focusing for tumor antigen-dependent and -independent sorting of rare circulating tumor cells. Sci Transl Med. 2013;5(179):179ra47. doi: 10.1126/scitranslmed.3005616. [DOI] [PMC free article] [PubMed] [Google Scholar]
- 12.Gulati GL, Hyland LJ, Kocher W, Schwarting R. Changes in automated complete blood cell count and differential leukocyte count results induced by storage of blood at room temperature. Arch Pathol Lab Med. 2002;126:336–342. doi: 10.5858/2002-126-0336-CIACBC. [DOI] [PubMed] [Google Scholar]
- 13.Campbell PJ, Yachida S, Mudie LJ, Stephens PJ, Pleasance ED, Stebbings LA, Morsberger LA, Latimer C, McLaren S, Lin ML, et al. The patterns and dynamics of genomic instability in metastatic pancreatic cancer. Nature. 2010;467:1109–1113. doi: 10.1038/nature09460. [DOI] [PMC free article] [PubMed] [Google Scholar]
- 14.Bao Y, Ching B, Mouanoutoua M, Wang Y, Keys D, Hartshorne T, Desai S, Stevens J. Cancer Biomarker Research Using castPCR™ Technology. Foster City, CA: Life Technologies; 2012. AACR 2012 Poster 2100 ( http://tools.invitrogen.com/content/sfs/posters/cms_102601.pdf) [Google Scholar]
- 15.Monzon FA, Ogino S, Hammond ME, Halling KC, Bloom KJ, Nikiforova MN. The role of KRAS mutation testing in the management of patients with metastatic colorectal cancer. Arch Pathol Lab Med. 2009;133(10):1600–1606. doi: 10.5858/133.10.1600. [DOI] [PubMed] [Google Scholar]
- 16.Lazar DC, Cho EH, Luttgen MS, Metzner TJ, Uson ML, Torrey M, Gross ME, Kuhn P. Cytometric comparisons between circulating tumor cells from prostate cancer patients and the prostate-tumor-derived LNCaP cell line. Phys Biol. 2012;9(1):016002. doi: 10.1088/1478-3975/9/1/016002. [DOI] [PMC free article] [PubMed] [Google Scholar]
- 17.Mostert B, Jiang Y, Sieuwerts AM, Wang H, Bolt-de Vries J, Biermann K, Kraan J, Lalmahomed Z, van Galen A, de Weerd V, et al. KRAS and BRAF mutation status in circulating colorectal tumor cells and their correlation with primary and metastatic tumor tissue. Int J Cancer. 2013;133(1):130–141. doi: 10.1002/ijc.27987. [DOI] [PubMed] [Google Scholar]
- 18.Fabbri F, Carloni S, Zoli W, Ulivi P, Gallerani G, Fici P, Chiadini E, Passardi A, Frassineti GL, Ragazzini A, et al. Detection and recovery of circulating colon cancer cells using a dielectrophoresis-based device: KRAS mutation status in pure CTCs. Cancer Lett. 2013;335(1):225–231. doi: 10.1016/j.canlet.2013.02.015. [DOI] [PubMed] [Google Scholar]
- 19.Strati A, Markou A, Parisi C, Politaki E, Mavroudis D, Georgoulias V, Lianidou E. Gene expression profile of circulating tumor cells in breast cancer by RT-qPCR. BMC Cancer. 2011;11:422. doi: 10.1186/1471-2407-11-422. [DOI] [PMC free article] [PubMed] [Google Scholar]
- 20.Lea IA, Jackson MA, Li X, Bailey S, Peddada SD, Dunnick JK. Genetic pathways and mutation profiles of human cancers: site- and exposure-specific patterns. Carcinogenesis. 2007;28(9):1851–1858. doi: 10.1093/carcin/bgm176. [DOI] [PMC free article] [PubMed] [Google Scholar]
- 21.Berg M, Soreide K. EGFR and downstream genetic alterations in KRAS/BRAF and PI3K/AKT pathways in colorectal cancer: implications for targeted therapy. Discov Med. 2012;14(76):207–214. [PubMed] [Google Scholar]
- 22.Gasch C, Bauernhofer T, Pichler M, Langer-Freitag S, Reeh M, Seifert AM, Mauermann O, Izbicki JR, Pantel K, Riethdorf S. Heterogeneity of epidermal growth factor receptor status and mutations of KRAS/PIK3CA in circulating tumor cells of patients with colorectal cancer. Clin Chem. 2013;59(1):252–260. doi: 10.1373/clinchem.2012.188557. [DOI] [PubMed] [Google Scholar]
Associated Data
This section collects any data citations, data availability statements, or supplementary materials included in this article.