

Significance
This paper shows how hydrogen exchange–mass spectrometry data can be deconvolved to obtain direct protein structural information at amino acid resolution. The solution to this problem has eluded prior efforts and is considered to be of fundamental importance for the rapidly expanding hydrogen exchange–MS field.
Keywords: HDX-MS, isotope pattern, protein biophysics
Abstract
Hydrogen exchange technology provides a uniquely powerful instrument for measuring protein structural and biophysical properties, quantitatively and in a nonperturbing way, and determining how these properties are implemented to produce protein function. A developing hydrogen exchange–mass spectrometry method (HX MS) is able to analyze large biologically important protein systems while requiring only minuscule amounts of experimental material. The major remaining deficiency of the HX MS method is the inability to deconvolve HX results to individual amino acid residue resolution. To pursue this goal we used an iterative optimization program (HDsite) that integrates recent progress in multiple peptide acquisition together with previously unexamined isotopic envelope-shape information and a site-resolved back-exchange correction. To test this approach, residue-resolved HX rates computed from HX MS data were compared with extensive HX NMR measurements, and analogous comparisons were made in simulation trials. These tests found excellent agreement and revealed the important computational determinants.
Unlike any other method, hydrogen exchange (HX) behavior encodes detailed quantitative information at amino acid resolution on the biophysical factors that produce protein function—structure, structure change, interactions, dynamics, and energetics. HX behavior is very sensitive to these properties, and the chemistry (1, 2) and structural physics (3, 4) of HX processes in these terms are now well understood. The ability of HX to measure protein biophysical properties and their implementation in protein function has been demonstrated over the last 30 y by many NMR studies. However, routine NMR analysis is limited to small highly soluble proteins that can be obtained in quantity (multi mgs), isotopically labeled (15N, 13C), and studied at millimolar concentration. A developing technology, HX measured and analyzed by mass spectrometry (HX MS) (5–16) can extend this proven capability to the much larger and more complex protein systems that make biology work. The method requires only picomoles of protein at submicromolar concentrations; it can be used to study the properties and functioning of proteins at any condition one chooses, and the experimental protein need not even be very pure.
For HX MS analysis, a protein sample taken from any H–D exchange experiment is quenched into slow HX conditions, proteolytically fragmented, and the peptide fragments are separated and analyzed by HPLC and mass spectrometry. The number of D atoms carried on each peptide fragment is given by its measurable increase in mass, usually calculated as the increment in the peptide mass centroid. These results provide structural information resolved to the level of individual fragments and are broadly able to indicate where in the protein important behavior occurs (5–16). More penetrating conclusions could be drawn if it were possible to extend structural resolution to the individual amino acid level. Recently reported efforts have moved in this direction (15, 17–24).
We find that the effort to achieve residue resolution is not limited by a difficult calculational barrier (17, 18, 20) but by experimental difficulties. To reach this goal, it is necessary to obtain many sequentially overlapping peptide fragments that cover the experimental protein several times over. It is also necessary to solve the back-exchange problem, the loss of D label, and the information it carries, which unavoidably occurs during the sample preparation process before sample injection into the mass spectrometer. We have described experimental and computational methods that can produce and rigorously identify and characterize hundreds of peptide fragments (25, 26) and that minimize back exchange (27). This paper demonstrates a straightforward approach that uses these capabilities together with previously unexamined envelope-shape information (isotopic peak amplitude ratios) and a site-resolved back-exchange correction to analyze HX MS results to amino acid resolution.
Results
Fig. 1 diagrams two sets of peptides with different overlap distributions. The hypothetical peptide distribution in Fig. 1, Inset, with a common terminus, might be obtained from an electron capture/transfer dissociation (ECD/ETD) analysis of samples taken from an HX MS experiment (15, 21, 23, 24, 28–37). The intact protein is injected into the gas phase of the mass spectrometer and an electron is delivered that leads to the rapid nonergodic cleavage of a random main-chain NH to alpha carbon bond. The resulting peptide fragments extend to either the N terminus or the C terminus of the protein. An analogous method relies on MALDI sample injection (22, 38). The Fig. 1 Inset shows an unusually complete peptide dataset with a common N terminus. Given this ideal dataset, simple subtraction of the D-dependent mass centroid increment of neighboring overhanging peptides would allow carried D label to be computed at amino acid resolution. These approaches avoid the H–D scrambling problem encountered in gas-phase cleavage by collision-induced dissociation (5, 39, 40) but they present some difficult technical challenges (7, 21), especially for sequence regions in larger proteins that are distant from the chain termini. A promising alternative is to proceed initially with the proteolytic fragmentation approach (below) and then select particular peptides for further ECD/ETD fragmentation analysis (21, 30) but at the expense of completeness and other disadvantages. Direct analysis of the peptide fragments as shown here overcomes these problems.
Fig. 1.

Overlapping peptides and site resolution. Peptides are indicated as horizontal bars. Inset represents an idealized ECD/ETD peptide dataset. The main diagram is a real peptide distribution for SNase obtained by proteolytic fragmentation. The naturally grouped subregions (within vertical dotted lines) are separately globally fit in the HDsite calculation. Site resolution implicit in the SNase peptide set is indicated by red dots for resolvable sites and blue rectangles for neighboring unresolved “switchable” sites, which could be resolved by obtaining more peptides, for example by using additional proteases.
Fig. 1 also diagrams a distribution of ∼300 peptides obtained for staphylococcal nuclease (SNase) by a different fragmentation method, namely online acid proteolysis. The colored bar indicates the site resolution implicit in this peptide set. Any given amide position is site resolved, in principle, when two peptides differ by only that one overhanging residue. However, in the absence of a common terminus, the D occupancy of the overhanging residues cannot be obtained by simple subtraction of the D-dependent mass centroids of neighboring peptides, as for the ECD/ETD dataset. Site-resolution analysis must consider simultaneously the multiple distributed segments and overhangs in the entire peptide collection (15, 17–20). We find that this kind of analysis can be greatly improved by the use of an aspect of the MS data that has been ignored before, namely the multiple peaks in the isotopic envelope of each peptide fragment rather than just the single parameter mass centroid.
The point is illustrated by reference to the isotopic peptide envelopes (relative peak amplitudes) in Fig. 2. The envelopes are simulated for a 10-residue peptide with an average total of four carried deuterons in an H–D exchange experiment. In the HX MS experiment, these 10-residue peptides would provide eight measurable peptide amides because deuterons on the first two residues are almost always fully lost to particularly fast back exchange during sample preparation (27). Fig. 2A is drawn for a case in which each amide site has a population average of 50% D labeling. In the original protein population, each amide site carries a deuteron on half of the proteins and the other half have none. In Fig. 2B, four of the amide sites carry a deuteron in all of the protein molecules and the other four have none. This might occur, for example, if the peptide represents a sequence that crosses between a well-protected helical segment and an unprotected loop. In Fig. 2C, half of the amide sites are taken to be 10% deuterated and the other half are 90% deuterated. In all of these cases the D occupancies averaged over the peptide and therefore the mass centroids are identical (∆m = 4), but the envelope shapes are clearly different. The relative isotopic-peak amplitudes that shape each peptide envelope contain surprisingly useful D-occupancy information.
Fig. 2.

Peptide mass spectra. Mass spectra are simulated for a 10-residue peptide with an average total of four bound deuterons, therefore the same centroid mass (Δm = 4) but with different unresolved D-occupancy distributions. Insets specify the averaged population D occupancies. (A) All residues are 50% D population average. (B) Four residues are H, four residues are D. (C) Four residues are 10% D, four residues are 90% D.
The envelope represents a convolution of the residue-level distribution of carried deuterons with the distributions of other atom isotopes, 13C, 15N, etc. The latter is a given and depends only on the unchanging natural isotope abundancies. This defined envelope shape is modulated by the D distribution—how many members of the given peptide population contain zero D, one D, two Ds, etc., as suggested in Fig. 2, Insets. This is the same kind of information that one obtains in single molecule experimentation. When taken together with similar envelope-shape information for the same amino acid residues contained in overlapping peptides, this information can lead to the desired residue-resolved D occupancies. All previous attempts to compute residue occupancies from measured peptide deuteration levels have used the peptide mass centroids that provide only a single-parameter population average and therefore lose the more detailed D-distribution information contained in the multiparameter envelope shape.
We wrote a program (HDsite) that takes advantage of the additional information contained in the envelope shape. Its ability to compute site resolution was tested by comparing results computed from HX MS data with site-resolved results measured directly by 2D NMR.
Test Against Site-Resolved HX NMR Data.
We measured H–D exchange over the 10,000,000-fold range of SNase HX rates by HX MS for the peptide set in Fig. 1 and used the HDsite approach to compute individual residue D occupancies at each HX MS time point. The time-dependent D occupancy for each amide was then fit to a single exponential decay to obtain site-resolved HX rates, as illustrated in Fig. 3A. The calculation also used the site-resolved back-exchange correction described in Materials and Methods. Fig. 3 B and C compare the entire computed HX MS dataset with analogous site-resolved HX NMR data measured for 99 SNase amides. Results for 81 amino acids are within threefold of the measured NMR rate, 16 are within 10-fold, and 2 are outliers. The MS and NMR data were measured in different years under different solution conditions by different operators (41, 42) and corrected to the common scale of HX protection (1). These factors appear to dominate the variance observed (e.g., compare the calculational accuracy seen in Fig. 4).
Fig. 3.
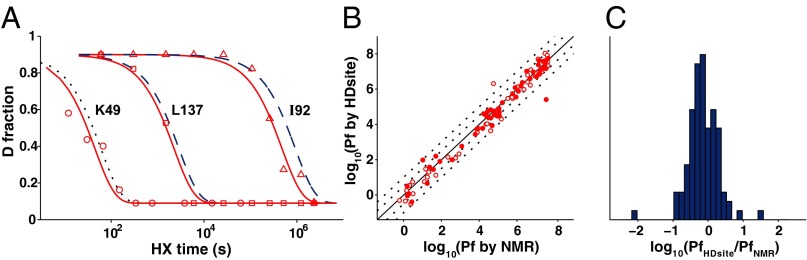
Toward amino acid resolution. (A) Some residue-resolved HX MS results for SNase compared with HX NMR results (dashed curves) or with the calculated rate for an unprotected amide not measured by NMR (dotted curve). (B) Comparison of HX NMR and HX MS data for SNase plotted in terms of HX protection factor (Pf = measured HX rate/expected unprotected rate). Filled symbols indicate directly determined HX MS D occupancy. Open symbols, switchable sites due to incomplete MS peptide overlap, are paired with their apparent NMR identities (this does not alter the fit quality in B and C). Dotted lines show deviations of threefold and 10-fold from the identity line. (C) Population distribution of site-resolved protection factors computed from HX MS data versus measured by NMR.
Fig. 4.

HDsite D-occupancy fitting results. (A–D) (Upper) The simulated peptide fragment datasets used. (A–D) (Lower) Results from five independent fitting runs for each peptide set with D occupancies and noise randomly assigned. The HDsite calculation was based on either centroid data (blue) or envelope shape data (red).
Simulations to Evaluate Envelope vs. Centroid Methods.
To explore the effect of possibly important variables, and also remove the variance due to insecure NMR determinations in Fig. 3, we performed similar comparisons with various simulated peptide datasets and D occupancies (Fig. 4). The simulated peptide sets cover a 30-residue protein sequence, like that usually globally fit as a group by HDsite (Fig. 1). Each simulated peptide set is sufficiently complete to intrinsically specify the D occupancy at every site. The D occupancy at each amide position and signal/noise were set by a random generator. Back exchange was taken to be zero.
Fig. 4, Lower, compares the D-occupancy results computed using either envelope or centroid data. When the peptide dataset is ideal, as in Fig. 4A, envelope and centroid fitting calculations both provide excellent D-occupancy results. For the peptide set in Fig. 4B, the centroid-based calculation yields a broad distribution of D occupancies, variable from one fitting run to another, because there is a tradeoff of sites added and subtracted between neighboring peptides. In contrast, the envelope-based calculation leads repeatedly to the same sharply defined and correct results. With lower signal/noise (S/N) (variability in isotopic peak amplitudes; Fig. 4C) the envelope method suffers more because it depends on the ratio of isotopic peaks whereas centroids are less sensitive to this parameter.
Calculations in Fig. 4D use a more realistic (proteolytic-like) although unusually complete peptide set. The centroid calculation leads to considerable scatter whereas the envelope-based calculation remains robust. The underlying reason for this behavior is informative. The peptide dataset, although extensive, has fewer peptides than the number of residue sites covered, as is the case for almost all published HX MS studies. The centroid method provides only a single fitting parameter for each peptide, and this number is less than the number of residue sites to be fit. (In this case the default trust–region–reflective optimization algorithm cannot be used; Materials and Methods.) In contrast, the envelope method is able to use many more data points (knowns) than the residue sites (unknowns). Apparently, good results using the centroid fitting parameter alone will require that the number of measured peptides exceeds the number of residue sites fitted. This goal is unlikely to be achieved. Use of the many-parameter envelope information reduces this requirement by a large factor, although intrinsic site resolution dependent on peptide overlap is still required.
In regards to other factors involved, certainly a major effector is the size of the peptide dataset and the site-resolution that it defines (see the site resolution map in Fig. 1). Any calculation can only extract information that is intrinsically contained in the dataset. When neighboring residues are switchable, i.e., not resolved by the pattern of overlapping peptides, a centroid calculation treats them as a single site and incorrectly assigns the averaged D occupancy to all. The envelope method can obtain the correct occupancy values but their assignment to the correct residues still requires a sufficiently complete dataset (Fig. 2, Insets). Accuracy improves for both centroid and envelope methods as peptide lengths decrease (results not shown). Decreased mass resolution has no effect on HDsite performance so long as the position and amplitude of isotopic peaks can be specified, although low resolution reduces the number of peptides able to be found. High levels of back exchange (>20%) can be a problem, and other workers have controlled for sizeable back exchange and for run-to-run variance by monitoring internal reference peptides (20). We have described methods for minimizing back exchange, and find run-to-run variance in back exchange to be small (<4%), as for experimentally measured D labeling in general. (We use manual sample handling and injection.) In any case, the HDsite program is able to correct for back exchange at site resolution (Materials and Methods).
Data-Fitting Landscape.
In the HDsite iterative fitting method and presumably with any other adequate calculation, either the centroid or envelope approach will work well when the peptide dataset is perfect and complete. In a more realistic case the envelope method does better. The reason is that centroid information provides only one fitting constraint per peptide whereas envelope information provides ∼10-fold more constraints, derived from the multiple peak amplitudes of each peptide. The additional constraints more sharply define the global minimum in parameter fitting space. This effect is illustrated in Fig. 5.
Fig. 5.

The course of iterative trial D-occupancy calculations. Twenty independent optimizations with random start points were run for the simulated peptide set in A. The peptide set is complete, implicitly discriminates every residue, and the number of peptides is not limiting relative to the number of sites to be fit, unlike the case in Fig. 4D. The RMSD for computed D occupancies (trial – true; y axis) is plotted against the RMSD for fitting to the input data (trial – experimental; x axis), where the experimental input is either the peptide centroids (B) or the isotopic peak amplitudes (C), as suggested in the Insets. The exploded view (D) more clearly illustrates the convergence of the envelope method results to the same D occupancies. Colors are used to distinguish the different runs.
Twenty independent optimizations were run for the simulated peptide dataset in Fig. 5A. The course of successive iterations is shown as the HDsite optimization proceeds. RMSD for the computed D occupancies (from the “known” values) is plotted against the mean squared error for fitting the input “measured” data, using either peptide centroids (Fig. 5B) or isotopic peak amplitudes (Fig. 5C), as suggested in Fig. 5, Insets. The excellent peptide dataset discriminates every amide, and both centroid and envelope shape methods yield good accuracy. However, the centroid-based runs yield a spread of estimated D occupancies and the envelope-based calculations repeatedly converge to closely correct values, with RMSD <0.02 in D occupancy. The exploded view (Fig. 5D) more clearly illustrates the convergence of the envelope method to the same D occupancies. With less complete datasets, accuracy declines much more rapidly for the centroid method.
Discussion
This paper shows how residue-resolved HX rate information can be extracted from data obtained by the HX MS experiment. This work took advantage of previously unexamined isotopic envelope shape information and previously described progress with experimental and computational methods that can produce and rigorously identify and characterize hundreds of peptide fragments (25, 26) and that minimize back exchange (27). The success of this integrated approach was demonstrated by comparing site-resolved HX rates obtained from extensive HX MS data with site-resolved HX results measured by 2D NMR. This test used only one protein but, given the large size of the peptide dataset, it seems unlikely that peptides derived from other proteins would behave differently. Excellent agreement was obtained for simulated datasets that remove extraneous variance and other uncertainties from the comparative data. The simulations also allowed the factors that might come into play to be varied and identified.
A critical factor in any effort to obtain residue resolution from HX MS data are the requirement for a large dataset of overlapping peptide fragments. For complete site resolution, the dataset must be sufficiently large that each residue is present as an overhanging residue in some peptide relative to some other peptide. Also the peptide dataset must provide a number of data-fitting constraints that is at least as large as the number of amino acid sites to be fit. Fortuitously, the proteolytic fragmentation sample analysis requires low pH where HX is slow to minimize back exchange. This necessitates the use of acid proteases, which are notoriously nonspecific and therefore tend to produce the desired kind of overlapping peptides. The production of useful overlaps is not under the control of the experimenter. However, with more peptides, the overlaps and single-residue overhangs will increase and, when sufficiently extensive, will move toward individual resolution for many amide sites, even though there is no simple linear relationship between the number of peptides and the relative completeness of the resolved sites.
Given a sufficiently large peptide dataset, the iterative fitting approach tested here exploits peptide isotopic envelope information, or less effectively, mass centroid information. The envelope method is able to use the multiple isotopic peaks for each peptide (roughly 10) as constraints in the iterative fitting process rather than just the single centroid. This lessens the number of peptides required for a good result and sharpens the minimum-error position in the fitting landscape, leading to more definitive fitting results. The isotopic envelope information comes for free, so to speak, in the MS data collection. A final factor in the success of the approach is the ability to correct for back exchange at residue resolution. This capability depends on accurate knowledge of the HX rates of unprotected amides (1, 2) and is validated by the demonstration that close to 100% of naturally occurring peptide fragments do experience back exchange quantitatively as expected during HX MS sample processing (27).
Materials and Methods
HX MS Experiment.
The SNase experimental results shown in the main text were obtained for a stabilized double mutant (P117G/H124L) prepared as described before (41). D-to-H exchange was done at 20 °C in 0.1 M KCl. To cover the wide range of HX rates for native SNase, four different HX MS time sets (pH 8.6, 8.3, 5.6, 4.2, from 10 s to 4 wk) were collected. Sample handling, mass spectrometry (LTQ Orbitrap XL), and data collection were as described before (25, 27). Raw MS data were processed by the ExMS program (26) and the many peptides that passed autocheck (no operator intervention) were used. The resulting output files (ExMS_wholeResults_afterCheck.mat) containing the identified peptides and their HX information (centroid mass increase, deuterated mass spectra, liquid chromatography (LC) retention time, etc.), are compatible for importing into HDsite.
HDsite Calculation.
The overall flow of the HDsite calculation is diagrammed in Fig. 6. HDsite uses an iterative fitting approach in which the adjustable parameters are the D-occupancy values of each amino acid in the sequence region of the protein selected for analysis. Trial D-occupancy values are used to calculate the isotopic envelope for each observed peptide. These profiles are compared with the experimental envelope of each peptide and a global goodness-of-fit (error) is calculated. The D-occupancy values are adjusted and the process is repeated until either the error function stops improving or a maximum number of iterations is reached. Because of the size of the MS datasets for large proteins, we usually split the amino acid sequence into smaller sections that contain mutually overlapping peptides with few peptides crossing into adjacent sequences. When a single protease is used, the pattern of proteolytic cleavage naturally produces such groupings as in Fig. 1. Currently, we have implemented HDsite in MATLAB (The MathWorks Inc.) using the trust–region–reflective optimization method and other functions provided in that environment. Other optimization algorithms yield better results for single envelope analysis but they can take considerably longer and offer little advantage for overlapping peptide data.
Fig. 6.

Flow of the HDsite method. (Upper) Overall flow; (Lower) back-exchange treatment.
HDsite corrects for back exchange on a per amino acid basis. This makes it possible to compare on an equal basis the D level of a given residue that appears in different peptides with different back-exchange times due to different LC retention times. The total loss of D by each peptide due to back exchange during sample preparation is measured (centroid) using fully deuterated samples handled exactly as for experimental samples. An effective back-exchange time for each peptide is calculated by using previously calibrated free peptide exchange rates under quench conditions (1, 2). The effective back-exchange time for each peptide is used to calculate the loss of D for each residue in the peptide, from the time of quench, common to all peptides, to the time of electrospray ionization injection, variable for each peptide. Previous work has shown that peptide back exchange during sample preparation is accurately predicted by the known free peptide rates (27).
Per residue D-occupancy values, with or without back-exchange correction, are used to construct the trial isotopic envelope to be compared with the experimental data for each peptide. Isotopic envelopes are calculated with a standard binomial ([Psub = Π(ProbHi + ProbDi)]; product over all residues in the peptide) further convolved with the natural abundance distributions of 13C, 15N, etc. The error, the difference between trial fit and experimental, is taken as the weighted sum of squares of deviations between experimental and calculated peak intensities. In evaluating the deviations from experimental results, the integrated intensity of each peptide is normalized to match the integrated intensity of the calculated profile for that peptide. The major source of noise appears to be due to ion-counting statistics. Therefore, within a peptide envelope we weight the deviations according to the square root of 1/(peak amplitude + λ). Here λ serves to substitute for zero in the absence of a measured peak. It is set to the noise level of the instrument. In summing the errors over observed peptides, each peptide is weighted according to the square root of its integrated experimental intensity. In practice, various weighting schemes made little difference to the outcome. Alternatively, the centroid of the mass distribution for each peptide can be evaluated and compared with experimental centroids. In this case switchable residues are treated together as a single value. These calculations provide D occupancy at a given HX time point. The HX time course of D-occupancy values is then fit to a single exponential rate equation as in Fig. 3A to obtain rate constants and protection factors.
The HDsite MATLAB source code is freely available on our laboratory Web site (http://hx2.med.upenn.edu/download.html), along with the previously posted ExMS program (26) and instructional material.
Acknowledgments
This work was supported by National Institutes of Health (NIH) Grant GM031847 and the National Science Foundation Grant MCB1020649 (to S.W.E.) and NIH Predoctoral Training Grant GM0827 (to B.T.W.).
Footnotes
The authors declare no conflict of interest.
Data deposition: The HDsite MATLAB source code is freely available at the authors’ laboratory Web site, http://hx2.med.upenn.edu/download.html.
References
- 1.Bai Y, Milne JS, Mayne L, Englander SW. Primary structure effects on peptide group hydrogen exchange. Proteins. 1993;17(1):75–86. doi: 10.1002/prot.340170110. [DOI] [PMC free article] [PubMed] [Google Scholar]
- 2.Connelly GP, Bai Y, Jeng MF, Englander SW. Isotope effects in peptide group hydrogen exchange. Proteins. 1993;17(1):87–92. doi: 10.1002/prot.340170111. [DOI] [PubMed] [Google Scholar]
- 3.Englander SW, Sosnick TR, Englander JJ, Mayne L. Mechanisms and uses of hydrogen exchange. Curr Opin Struct Biol. 1996;6(1):18–23. doi: 10.1016/s0959-440x(96)80090-x. [DOI] [PMC free article] [PubMed] [Google Scholar]
- 4.Skinner JJ, Lim WK, Bédard S, Black BE, Englander SW. Protein dynamics viewed by hydrogen exchange. Protein Sci. 2012;21(7):996–1005. doi: 10.1002/pro.2081. [DOI] [PMC free article] [PubMed] [Google Scholar]
- 5.Kaltashov IA, Bobst CE, Abzalimov RR. Mass spectrometry-based methods to study protein architecture and dynamics. Protein Sci. 2013;22(5):530–544. doi: 10.1002/pro.2238. [DOI] [PMC free article] [PubMed] [Google Scholar]
- 6.Ling JM, Silva L, Schriemer DC, Schryvers AB. Hydrogen-deuterium exchange coupled to mass spectrometry to investigate ligand-receptor interactions. Methods Mol Biol. 2012;799:237–252. doi: 10.1007/978-1-61779-346-2_15. [DOI] [PubMed] [Google Scholar]
- 7.Iacob RE, Engen JR. Hydrogen exchange mass spectrometry: Are we out of the quicksand? J Am Soc Mass Spectrom. 2012;23(6):1003–1010. doi: 10.1007/s13361-012-0377-z. [DOI] [PMC free article] [PubMed] [Google Scholar]
- 8.Zhang Z, Smith DL. Determination of amide hydrogen exchange by mass spectrometry: A new tool for protein structure elucidation. Protein Sci. 1993;2(4):522–531. doi: 10.1002/pro.5560020404. [DOI] [PMC free article] [PubMed] [Google Scholar]
- 9.Ramisetty SR, Washburn MP. Unraveling the dynamics of protein interactions with quantitative mass spectrometry. Crit Rev Biochem Mol Biol. 2011;46(3):216–228. doi: 10.3109/10409238.2011.567244. [DOI] [PubMed] [Google Scholar]
- 10.Chalmers MJ, Busby SA, Pascal BD, West GM, Griffin PR. Differential hydrogen/deuterium exchange mass spectrometry analysis of protein-ligand interactions. Expert Rev Proteomics. 2011;8(1):43–59. doi: 10.1586/epr.10.109. [DOI] [PMC free article] [PubMed] [Google Scholar]
- 11.Brock A. Fragmentation hydrogen exchange mass spectrometry: A review of methodology and applications. Protein Expr Purif. 2012;84(1):19–37. doi: 10.1016/j.pep.2012.04.009. [DOI] [PubMed] [Google Scholar]
- 12.Tsutsui Y, Wintrode PL. Hydrogen/deuterium exchange-mass spectrometry: A powerful tool for probing protein structure, dynamics and interactions. Curr Med Chem. 2007;14(22):2344–2358. doi: 10.2174/092986707781745596. [DOI] [PubMed] [Google Scholar]
- 13.Landreh M, Astorga-Wells J, Johansson J, Bergman T, Jörnvall H. New developments in protein structure-function analysis by MS and use of hydrogen-deuterium exchange microfluidics. FEBS J. 2011;278(20):3815–3821. doi: 10.1111/j.1742-4658.2011.08215.x. [DOI] [PubMed] [Google Scholar]
- 14.Hoofnagle AN, Resing KA, Ahn NG. Protein analysis by hydrogen exchange mass spectrometry. Annu Rev Biophys Biomol Struct. 2003;32:1–25. doi: 10.1146/annurev.biophys.32.110601.142417. [DOI] [PubMed] [Google Scholar]
- 15.Konermann L, Pan J, Liu YH. Hydrogen exchange mass spectrometry for studying protein structure and dynamics. Chem Soc Rev. 2011;40(3):1224–1234. doi: 10.1039/c0cs00113a. [DOI] [PubMed] [Google Scholar]
- 16.Englander SW. Hydrogen exchange and mass spectrometry: A historical perspective. J Am Soc Mass Spectrom. 2006;17(11):1481–1489. doi: 10.1016/j.jasms.2006.06.006. [DOI] [PMC free article] [PubMed] [Google Scholar]
- 17.Althaus E, et al. Computing H/D-exchange rates of single residues from data of proteolytic fragments. BMC Bioinf. 2010;11:424. doi: 10.1186/1471-2105-11-424. [DOI] [PMC free article] [PubMed] [Google Scholar]
- 18.Fajer PG, Bou-Assaf GM, Marshall AG. Improved sequence resolution by global analysis of overlapped peptides in hydrogen/deuterium exchange mass spectrometry. J Am Soc Mass Spectrom. 2012;23(7):1202–1208. doi: 10.1007/s13361-012-0373-3. [DOI] [PubMed] [Google Scholar]
- 19.Pascal BD, Chalmers MJ, Busby SA, Griffin PR. HD desktop: An integrated platform for the analysis and visualization of H/D exchange data. J Am Soc Mass Spectrom. 2009;20(4):601–610. doi: 10.1016/j.jasms.2008.11.019. [DOI] [PMC free article] [PubMed] [Google Scholar]
- 20.Zhang Z, Zhang A, Xiao G. Improved protein hydrogen/deuterium exchange mass spectrometry platform with fully automated data processing. Anal Chem. 2012;84(11):4942–4949. doi: 10.1021/ac300535r. [DOI] [PubMed] [Google Scholar]
- 21.Rand KD. Pinpointing changes in higher-order protein structure by hydrogen/deuterium exchange coupled to electron transfer dissociation mass spectrometry. Int J Mass Spectrom. 2013;338:2–10. [Google Scholar]
- 22.Rand KD, Bache N, Nedertoft MM, Jørgensen TJ. Spatially resolved protein hydrogen exchange measured by matrix-assisted laser desorption ionization in-source decay. Anal Chem. 2011;83(23):8859–8862. doi: 10.1021/ac202468v. [DOI] [PubMed] [Google Scholar]
- 23.Rand KD, Pringle SD, Morris M, Brown JM. Site-specific analysis of gas-phase hydrogen/deuterium exchange of peptides and proteins by electron transfer dissociation. Anal Chem. 2012;84(4):1931–1940. doi: 10.1021/ac202918j. [DOI] [PubMed] [Google Scholar]
- 24.Rand KD, Zehl M, Jensen ON, Jørgensen TJ. Protein hydrogen exchange measured at single-residue resolution by electron transfer dissociation mass spectrometry. Anal Chem. 2009;81(14):5577–5584. doi: 10.1021/ac9008447. [DOI] [PubMed] [Google Scholar]
- 25.Mayne L, et al. Many overlapping peptides for protein hydrogen exchange experiments by the fragment separation-mass spectrometry method. J Am Soc Mass Spectrom. 2011;22(11):1898–1905. doi: 10.1007/s13361-011-0235-4. [DOI] [PMC free article] [PubMed] [Google Scholar]
- 26.Kan ZY, Mayne L, Chetty PS, Englander SW. ExMS: Data analysis for HX-MS experiments. J Am Soc Mass Spectrom. 2011;22(11):1906–1915. doi: 10.1007/s13361-011-0236-3. [DOI] [PMC free article] [PubMed] [Google Scholar]
- 27.Walters BT, Ricciuti A, Mayne L, Englander SW. Minimizing back exchange in the hydrogen exchange-mass spectrometry experiment. J Am Soc Mass Spectrom. 2012;23(12):2132–2139. doi: 10.1007/s13361-012-0476-x. [DOI] [PMC free article] [PubMed] [Google Scholar]
- 28.Zehl M, Rand KD, Jensen ON, Jørgensen TJ. Electron transfer dissociation facilitates the measurement of deuterium incorporation into selectively labeled peptides with single residue resolution. J Am Chem Soc. 2008;130(51):17453–17459. doi: 10.1021/ja805573h. [DOI] [PubMed] [Google Scholar]
- 29.Abzalimov RR, Kaplan DA, Easterling ML, Kaltashov IA. Protein conformations can be probed in top-down HDX MS experiments utilizing electron transfer dissociation of protein ions without hydrogen scrambling. J Am Soc Mass Spectrom. 2009;20(8):1514–1517. doi: 10.1016/j.jasms.2009.04.006. [DOI] [PMC free article] [PubMed] [Google Scholar]
- 30.Huang RY, Garai K, Frieden C, Gross ML. Hydrogen/deuterium exchange and electron-transfer dissociation mass spectrometry determine the interface and dynamics of apolipoprotein E oligomerization. Biochemistry. 2011;50(43):9273–9282. doi: 10.1021/bi2010027. [DOI] [PMC free article] [PubMed] [Google Scholar]
- 31.Pan J, Han J, Borchers CH, Konermann L. Electron capture dissociation of electrosprayed protein ions for spatially resolved hydrogen exchange measurements. J Am Chem Soc. 2008;130(35):11574–11575. doi: 10.1021/ja802871c. [DOI] [PubMed] [Google Scholar]
- 32.Pan J, Han J, Borchers CH, Konermann L. Hydrogen/deuterium exchange mass spectrometry with top-down electron capture dissociation for characterizing structural transitions of a 17 kDa protein. J Am Chem Soc. 2009;131(35):12801–12808. doi: 10.1021/ja904379w. [DOI] [PubMed] [Google Scholar]
- 33.Pan J, Han J, Borchers CH, Konermann L. Characterizing short-lived protein folding intermediates by top-down hydrogen exchange mass spectrometry. Anal Chem. 2010;82(20):8591–8597. doi: 10.1021/ac101679j. [DOI] [PubMed] [Google Scholar]
- 34.Pan J, Han J, Borchers CH, Konermann L. Conformer-specific hydrogen exchange analysis of Aβ (1-42) oligomers by top-down electron capture dissociation mass spectrometry. Anal Chem. 2011;83(13):5386–5393. doi: 10.1021/ac200906v. [DOI] [PubMed] [Google Scholar]
- 35.Pan J, Han J, Borchers CH, Konermann L. Structure and dynamics of small soluble Aβ (1-40) oligomers studied by top-down hydrogen exchange mass spectrometry. Biochemistry. 2012;51(17):3694–3703. doi: 10.1021/bi3002049. [DOI] [PubMed] [Google Scholar]
- 36.Pan J, Heath BL, Jockusch RA, Konermann L. Structural interrogation of electrosprayed peptide ions by gas-phase H/D exchange and electron capture dissociation mass spectrometry. Anal Chem. 2012;84(1):373–378. doi: 10.1021/ac202730d. [DOI] [PubMed] [Google Scholar]
- 37.Landgraf RR, Chalmers MJ, Griffin PR. Automated hydrogen/deuterium exchange electron transfer dissociation high resolution mass spectrometry measured at single-amide resolution. J Am Soc Mass Spectrom. 2012;23(2):301–309. doi: 10.1007/s13361-011-0298-2. [DOI] [PMC free article] [PubMed] [Google Scholar]
- 38.Bache N, Rand KD, Roepstorff P, Ploug M, Jørgensen TJ. Hydrogen atom scrambling in selectively labeled anionic peptides upon collisional activation by MALDI tandem time-of-flight mass spectrometry. J Am Soc Mass Spectrom. 2008;19(12):1719–1725. doi: 10.1016/j.jasms.2008.05.021. [DOI] [PubMed] [Google Scholar]
- 39.Hamuro Y, Tomasso JC, Coales SJ. A simple test to detect hydrogen/deuterium scrambling during gas-phase peptide fragmentation. Anal Chem. 2008;80(17):6785–6790. doi: 10.1021/ac800645f. [DOI] [PubMed] [Google Scholar]
- 40.Jørgensen TJ, Gårdsvoll H, Ploug M, Roepstorff P. Intramolecular migration of amide hydrogens in protonated peptides upon collisional activation. J Am Chem Soc. 2005;127(8):2785–2793. doi: 10.1021/ja043789c. [DOI] [PubMed] [Google Scholar]
- 41.Bédard S, Mayne LC, Peterson RW, Wand AJ, Englander SW. The foldon substructure of staphylococcal nuclease. J Mol Biol. 2008;376(4):1142–1154. doi: 10.1016/j.jmb.2007.12.020. [DOI] [PMC free article] [PubMed] [Google Scholar]
- 42.Skinner JJ, Lim WK, Bédard S, Black BE, Englander SW. Protein hydrogen exchange: Testing current models. Protein Sci. 2012;21(7):987–995. doi: 10.1002/pro.2082. [DOI] [PMC free article] [PubMed] [Google Scholar]