Abstract
Motivation: Data quality is a critical issue in the analyses of DNA copy number alterations obtained from microarrays. It is commonly assumed that copy number alteration data can be modeled as piecewise constant and the measurement errors of different probes are independent. However, these assumptions do not always hold in practice. In some published datasets, we find that measurement errors are highly correlated between probes that interrogate nearby genomic loci, and the piecewise-constant model does not fit the data well. The correlated errors cause problems in downstream analysis, leading to a large number of DNA segments falsely identified as having copy number gains and losses.
Method: We developed a simple tool, called autocorrelation scanning profile, to assess the dependence of measurement error between neighboring probes.
Results: Autocorrelation scanning profile can be used to check data quality and refine the analysis of DNA copy number data, which we demonstrate in some typical datasets.
Contact: lzhangli@mdanderson.org
Supplementary information: Supplementary data are available at Bioinformatics online.
1 INTRODUCTION
DNA copy number alteration (CNA) is one of the hallmarks of cancer (Hanahan and Weinberg, 2011) and has been linked to various complex genetic diseases (Girirajan et al., 2011; McCarroll and Altshuler, 2007). Technological advances in microarrays (Maresso and Broeckel, 2008; Snijders et al., 2001; Wang et al., 2009; Yau and Holmes, 2008) and next-generation sequencing (Campbell et al., 2008) have made it possible to generate large amounts of CNA data (Ahmad and Iqbal, 2012; Li et al., 2012; Lisovich et al., 2011; Teo et al., 2012). Various methods developed for CNA data analysis have been compared in published reviews (Baross et al., 2007; Eckel-Passow et al., 2011; Grayson and Aune, 2011; Yau and Holmes, 2008). These methods differ in their focus, including preprocessing and normalization (Lisovich et al., 2011; Stamoulis and Betensky, 2011; Wang et al., 2012), segmentation (Broet and Richardson, 2006; Huang et al., 2005; Hupe et al., 2004; Olshen et al., 2004), joint analysis of multiple samples (Diskin et al., 2006; McCarroll et al., 2008; Walter et al., 2011; Wu et al., 2009), copy number based on mapped sequence reads (Chiang et al., 2009; Ivakhno et al., 2010; Li et al., 2012; Magi et al., 2011, 2012; Sathirapongsasuti et al., 2011; Xi et al., 2011), integrated analysis with genotyping, allele-specific copy number (Li et al., 2008) and others (Abyzov et al., 2011; Li et al., 2011; Pique-Regi et al., 2010; van de Wiel et al., 2007; Wang et al., 2007). However, there are still some challenging issues regarding quality assessment and biological interpretation of CNA data (Hanemaaijer et al., 2012; Wineinger and Tiwari, 2012; Zhang et al., 2011).
A common step of CNA analysis is segmentation, which transforms noisy measurements into genomic segments of equal copy number. This step aims to reduce noise and data dimension. Significant gains/losses of the segments can be subsequently recognized. The ends of the segments may correspond to DNA breakage points. The underlying assumptions in segmentation are (i) the data can be modeled as piecewise constant, and (ii) the measurement errors of different probes are independent. Although in most cases, methods such as circular binary segmentation (CBS; Olshen et al., 2004) yield reasonable results, we find that occasionally the piecewise-constant model appears to fit the data poorly and the independence assumption is grossly violated. The independence assumption is critical because it forms the basis for separating true signals from noise. Correlated errors are expected to lead to incorrect identification of aberrant segments.
To address the issue, we have developed a method called the autocorrelation scanning profile (ASP). Autocorrelation is the cross-correlation of a signal with itself, which is a mathematical tool for finding repeating patterns in time series data. If the time series data can be modeled as piecewise constant and the noises in the data are independent at different time points, ASP has the following appealing properties: (i) the autocorrelation within each segment of a constant mean is expected to be 0; (ii) at the junction of an abrupt change-point, however, the autocorrelation rises significantly above 0. We observe different patterns when the ASP method is applied to published datasets. Our results show that ASP can be used to check for CNA data quality and refine the analysis.
2 METHODS
2.1 Autocorrelation scanning profile
ASP assesses the autocorrelation pattern from the copy number profile (CNP) of a sample. A CNP is a vector, denoted as  where n is the number of probed positions in the genome. The components of the vector are ordered by the chromosome number and the chromosomal coordinates of the probed positions. The values of the components of the vector are log-transformed DNA copy numbers. Probes that do not correspond to unique chromosomal positions are excluded. We define the ASP as a vector that is computed as follows:
where  and cor stands for Pearson correlation. The vector
  represents a scanning window enclosing w probe signals. In this study, we choose w = 100.
The following procedure is used to evaluate the statistical significance of the ASP. (i) To remove the effects of gains/losses, we apply Tukey's running median smoothing algorithm (window size = 101) to a CNP, which results in a smoothed CNP. (ii) We then take the difference between the raw probe signals and the smoothed CNP to be the residuals, which we then randomly permute along the genome to compute the ASP. Because the randomly permuted residuals are supposed to have no significant autocorrelation, the ASP values resulting from the permuted residuals are assumed to form a null distribution. (iii) We use the top 99 percentile of the ASP values as the threshold value of significance, with P = 0.01.
2.2 Computer simulation
To generate simulated CNP data, we set the dimension of a CNP to be n = 10 000. Let x be a vector of 10 000 random numbers following a standard normal distribution. Here, x is the initial CNP that corresponds to a sample with no copy number change and ASP is ∼0. To generate a CNP that has ASP > 0, we use the following coupling function:
where  and β is an adjustable parameter. We then normalize the CNP so that its mean is 0 and standard deviation (sd) is 1. We then introduce a gain region and a loss region on V(x), each with 2000 probe sites. The amplitudes of the gain and the loss are equal to 1. By tuning beta, we obtain V(x) with different levels of the median ASP. We then apply the CBS algorithm to identify the segments. A segment is called a significant gain/loss if the following:
where m is the segmental mean and  is the square root of the number of probes in the segment. False positives (FPs) are defined as sites that are called significant gains/losses, but for which the nominal value is 0. False negatives (FNs) are defined as sites that are not called as significant gains/losses, but for which the nominal is not 0. True positives (TPs) are defined as gains/losses that are correctly identified. True negatives (TNs) are defined as sites that are not called as significant gains/losses, and for which the nominal is 0.
The computer program we use in this study can be found in the Supplementary Materials.
3 RESULTS
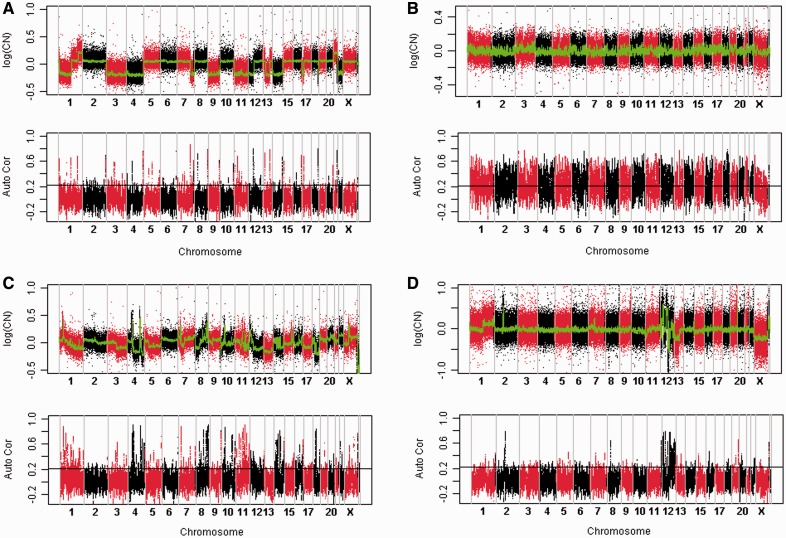
To evaluate the use of the ASP method, we compute the ASPs using previously published DNA copy number data. Figure 1 shows the typical patterns we observe. The most common pattern is shown in Figure 1A. After denoising, the CNP (the green curve) has the shape of step functions with well-defined abrupt change-points. The ASP profile (Fig. 1A, bottom) peaks around the abrupt change-points of CNP but mostly fluctuates near 0 in other loci, and rarely exceeds the significance line (the horizontal black line). It appears that the piecewise-constant model fits the CNP data well and there is little correlation between the measurements of different probes, i.e. the probes can be regarded as independent in this case.
Fig. 1.
Typical ASP patterns. (A) Piecewise-constant CNP; (B) High ASP throughout genome; (C) Gradual changes in CNP; (D) CNP fluctuates rapidly. Data source: Case A is from sample GSM315239 in GEO dataset GSE12532 (Hallor et al., 2009); Case B from sample GSM487724 in GSE19574 (Uchida et al., 2010); Case C from sample GSM315235, GEO accession number is GSE12532 (Hallor et al., 2009); and Case D is from GSM535545, GEO accession number is GSE21420 (Barrow et al., 2011). In each case, the top shows the log-transformed CNP. The red points and the black points in the CNP profile show the copy number data of individual SNP sites. The green curve shows denoised CNP using Tukey's running median smoothing. The bottom shows the ASP. The horizontal black line, around 0.2, marks the threshold value obtained from random permuted data. Points above the line have P < 0.01. All data presented in this figure are from the same microarray platform CGH 244A manufactured by Agilent technologies
However, the pattern shown in Figure 1A is not universal, as other patterns have also been observed. For example, in Figure 1B, the ASP appears to be much higher, exceeding the significance line (the horizontal black line around 0.2) throughout the genome. We also find samples lacking clearly defined change-points (Fig. 1C). The CNP appears to have gradual changes in some areas, such as in chromosome 1 (Fig. 1C, top). Another distinct pattern is shown in Figure 1D, in which the ASP reaches high levels in a localized region in the genome (chromosome 12). The CNP also fluctuates a lot in the same region.
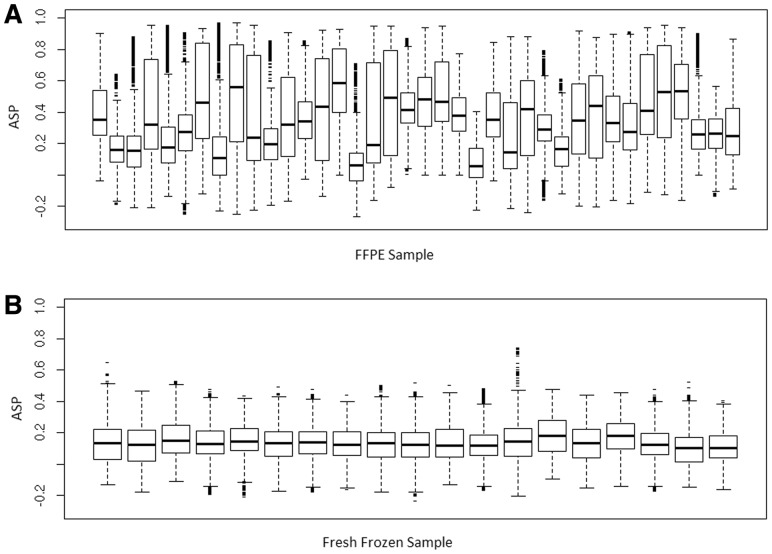
We suspect the pattern seen in Figure 1B may indicate a quality problem with the DNA sample. We obtained supporting evidence of this view from comparing formalin-fixed paraffin-embedded (FFPE) samples with fresh-frozen samples obtained from the same type of cancer and using the same microarray platform. Formalin fixation is known to cause damages in DNA, and extraction of DNA from FFPE samples is more prone to biases (Brosens et al., 2010). As expected, we find that the FFPE samples appear to have elevated ASPs (Fig. 2) more often than the fresh-frozen samples. The average of the median ASP of each FFPE sample is 0.32, whereas the median ASP of the fresh-frozen samples is only 0.13. The difference between the two groups of samples is statistically significant (P = 7.56e-10, Student t-test).
Fig. 2.
Boxplots of ASPs. (A) FFPE samples; (B) Fresh-frozen samples. Data source: GEO accession number GSE17047 (stage II colorectal cancer, tissue samples) for the A and B set. The data are generated using Agilent HD CGH Microarray 2 × 10⁵ k array. The boxplots show the inter-quartile ranges
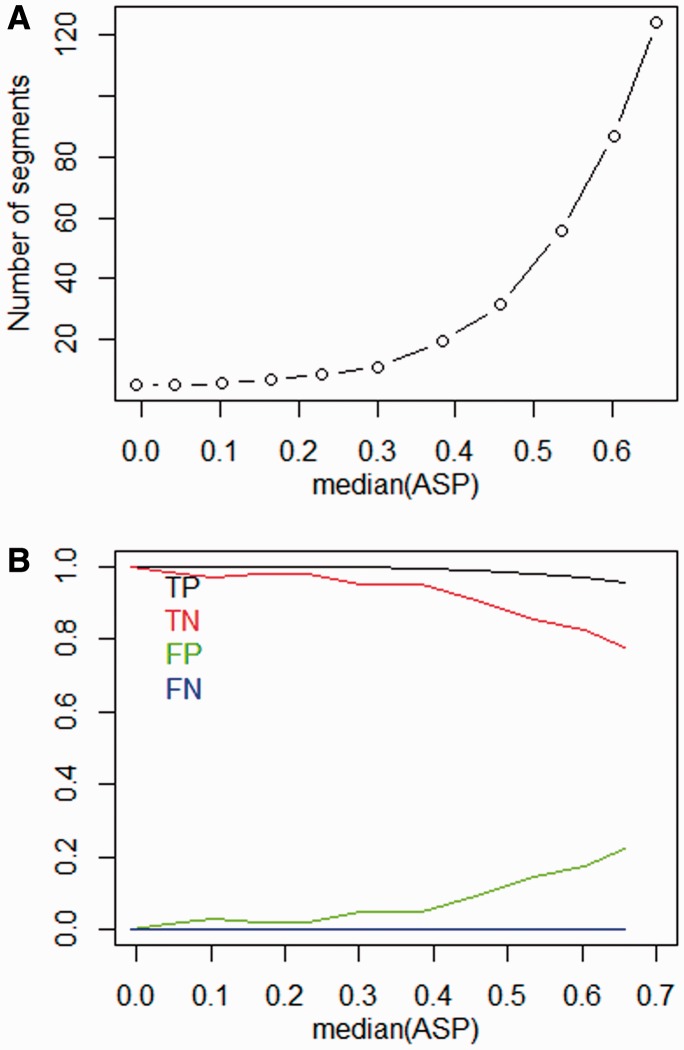
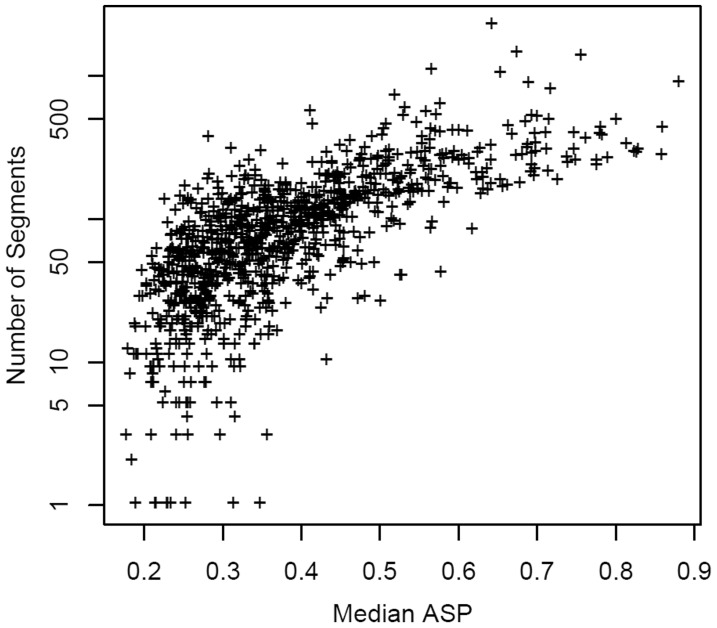
To better understand the consequences of elevated ASPs, we performed computer simulations to create artificial CNPs with different levels of autocorrelation. We first generated CNPs following a standard normal distribution, which corresponds to a sample with no copy number change and ASP approximately equal to 0. We then introduced correlation between neighboring probes by coupling the signals between neighboring probes with a tunable parameter (see details in Methods). Figure 3 shows how the CBS segmentation results depend on median ASPs that are computed from the simulated CNPs. The results show that when the median ASP is <0.1, the number of segments remains at 1 and the FP rate is close to 0. The number of segments and the FP rate rise rapidly when the median ASP is >0.4. This result suggests that there is a clear association between the elevated ASP and the number of segments. A similar relationship has been found in real data. Figure 4 shows correlation between the median ASP and number of segments in a dataset of 971 breast cancer samples (Spearman's rank correlation coefficient = 0.74).
Fig. 3.
Simulation results. (A) Relationship between median of ASP and number of segments according to CBS algorithm. (B) Relationship between median of ASP and FP rate, FN rate, TP rate and TN rate. CNP data are generated using random values with no significant copy number changes. The size of each CNP is 100 000. Autocorrelation is incorporated through coupling the signals of neighboring probes (see Methods)
Fig. 4.
High ASP corresponds to hypersegmentation. The relationship between median ASP and number of segments identified by the CBS algorithm is shown. Data source: the data are from Thompson et al. (2011)
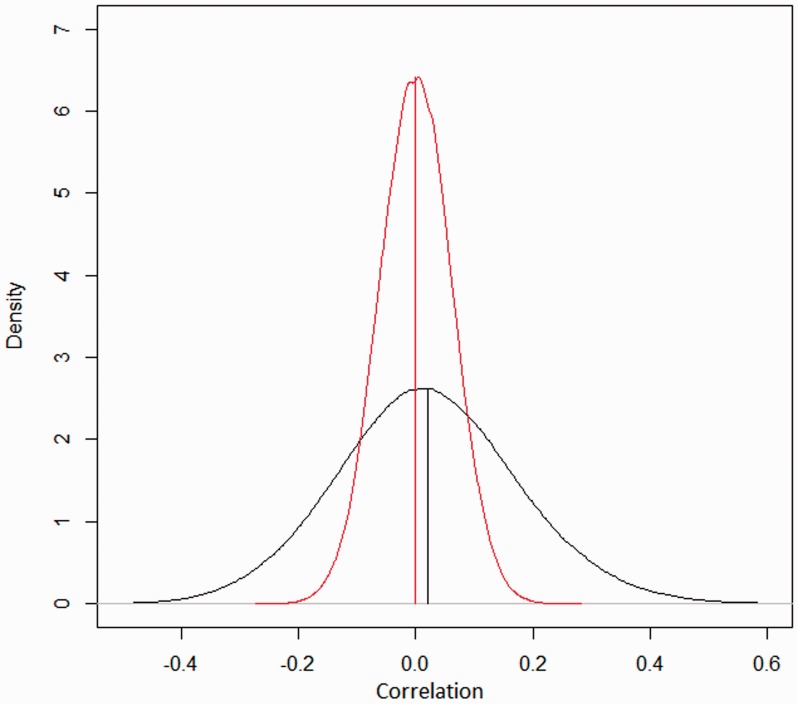
Besides correlated measurement errors between adjacent probes, segmental copy number changes can affect ASP. To assess the effects of the former factor alone, we used a dataset of 270 samples from a population without cancer and with few copy number changes. We used that dataset as a standard reference set for calibrating the data on the platform. To further reduce the effects of the copy number changes, we removed the segments that had significant gains and losses. Because the nominal copy number is 2 nearly throughout the genome, the correlations observed between neighboring probes thus should measure the extent to which the probes depend on each other. We calculated the copy number correlation between neighboring probes. Figure 5 shows the distribution of the correlations (red line). The distribution is centered ∼0 (mean = −0.0001), but the range is much wider than that expected from randomly permuted data. The sd of the red line is 0.16, whereas the sd of the black line 0.06. This means that we cannot assume that the probes are independent from each other, even though the correlation between neighboring probes is near 0 on average.
Fig. 5.
Distribution of correlation of measurement errors between neighboring probes. The raw data are from GEO Web site with accession number GSE5173. The dataset is from a healthy population and is used as normal controls for normalization. Array platform: Affymetrix Mapping 250 k Nsp SNP array. Black line denotes the distribution of correlation of errors in the copy number estimates between neighboring SNP sites. The red line shows the distribution of correlation using randomly permuted residuals
4 DISCUSSION
In this study, we have demonstrated the use of ASP in DNA copy number analysis. The issue of interdependence of probes has been largely ignored in the existing methods. We argue this is an important issue and show that there are elevated ASPs that can be frequently observed in published datasets. Elevated ASPs mean that one cannot assume that the microarray probes measure the copy number data independently. The elevated ASPs inflate the FPs in the identification of aberrant segments because they increase the probability of multiple probes having common biases. From the results of our computer simulations, we found that FPs in segmentation rise rapidly when the median ASP > 0.4. Thus, one may regard the samples with median ASP > 0.4 as bad samples that are to be discarded.
Spurious results of copy number changes have been found experimentally. Mc Sherry et al. (2007) reported a dramatic increase in the absolute number of genetic alterations in all FFPE tissues relative to their matched fresh-frozen counterparts, suggesting that FFPE samples are more prone to produce spurious results of copy number changes. These results are similar to our current study, which showed that FFPE samples tend to have higher median ASPs than fresh-frozen samples (Fig. 2).
Our ASP method provides a much needed tool for quality control. Existing tools such as the NanoDrop spectrophotometer aim to ensure that DNA samples to be hybridized onto the arrays are in sufficient quantity and have the appropriate length. There are also metrics commonly used to assess data quality, such as the derivative log-ratio spread (DLRS; Largo et al., 2007) and genotyping call rate on SNP arrays. The DLRS estimates the log-ratio noise by calculating the spread of log-ratio differences between consecutive probes along all chromosomes. The genotyping call rate of a sample is the fraction of probes that have passed the detection filter. The DLRS and genotype call rate are correlated, both reflecting measurement noises on individual probes. ASP is conceptually different, as it measures the correlation of noises between neighboring probes. Hence, we recommend the use of ASP in addition to existing quality measures.
It is interesting to note that the ASPs show several distinct patterns (Fig. 1). When only a localized region has a high ASP (Fig. 1D), the phenomenon is similar to that reported as chromothripsis (Maher and Wilson, 2012) or firestorm (Hicks et al., 2006). The CNP pattern seen in Figure 1C contains gradual changes, which poorly fit the piecewise-constant model. The piecewise-constant model is expected to hold under the condition that there is only one tumor clone in the tissue and the number of aberrant segments is less than the number of probe sites. The latter condition usually holds except in the case of chromothripsis. When there is only one tumor clone, the denoised copy number should take integer values after adjusting the scale. The gradual changes that fall between the level of single copy gain or loss (such as in Fig. 1C) cannot result from a single tumor clone, and therefore must come from the contribution of multiple clones. Tumor tissues containing multiple clones are commonly observed, which is recognized as another hallmark of cancer (Hanahan and Weinberg, 2011). Taken together, our results show that ASP provides a useful tool in DNA copy number analysis.
Supplementary Material
ACKNOWLEDGEMENTS
We thank Lee Ann Chastain for editing the article.
Funding: U.S. National Institutes of Health through a TCGA Genome Data Analysis Center (GDAC) grant (in part); Cancer Center Support Grant at the University of Texas MD Anderson Cancer Center (U24 CA143883 02 S1 and P30 CA016672).
Conflict of Interest: none declared.
REFERENCES
- Abyzov A, et al. CNVnator: an approach to discover, genotype, and characterize typical and atypical CNVs from family and population genome sequencing. Genome Res. 2011;21:974–984. doi: 10.1101/gr.114876.110. [DOI] [PMC free article] [PubMed] [Google Scholar]
- Ahmad A, Iqbal MA. Significance of genome-wide analysis of copy number alterations and UPD in myelodysplastic syndromes using combined CGH-SNP arrays. Curr. Med. Chem. 2012;19:3739–3747. doi: 10.2174/092986712801661121. [DOI] [PubMed] [Google Scholar]
- Baross A, et al. Assessment of algorithms for high throughput detection of genomic copy number variation in oligonucleotide microarray data. BMC Bioinformatics. 2007;8:368. doi: 10.1186/1471-2105-8-368. [DOI] [PMC free article] [PubMed] [Google Scholar]
- Barrow J, et al. Homozygous loss of ADAM3A revealed by genome-wide analysis of pediatric high-grade glioma and diffuse intrinsic pontine gliomas. Neuro. Oncol. 2011;13:212–222. doi: 10.1093/neuonc/noq158. [DOI] [PMC free article] [PubMed] [Google Scholar]
- Broet P, Richardson S. Detection of gene copy number changes in CGH microarrays using a spatially correlated mixture model. Bioinformatics. 2006;22:911–918. doi: 10.1093/bioinformatics/btl035. [DOI] [PubMed] [Google Scholar]
- Brosens RP, et al. Candidate driver genes in focal chromosomal aberrations of stage II colon cancer. J. Pathol. 2010;221:411–424. doi: 10.1002/path.2724. [DOI] [PubMed] [Google Scholar]
- Campbell PJ, et al. Identification of somatically acquired rearrangements in cancer using genome-wide massively parallel paired-end sequencing. Nat. Genet. 2008;40:722–729. doi: 10.1038/ng.128. [DOI] [PMC free article] [PubMed] [Google Scholar]
- Chiang DY, et al. High-resolution mapping of copy-number alterations with massively parallel sequencing. Nat. Methods. 2009;6:99–103. doi: 10.1038/nmeth.1276. [DOI] [PMC free article] [PubMed] [Google Scholar]
- Diskin SJ, et al. STAC: a method for testing the significance of DNA copy number aberrations across multiple array-CGH experiments. Genome Res. 2006;16:1149–1158. doi: 10.1101/gr.5076506. [DOI] [PMC free article] [PubMed] [Google Scholar]
- Eckel-Passow JE, et al. Software comparison for evaluating genomic copy number variation for Affymetrix 6.0 SNP array platform. BMC Bioinformatics. 2011;12:220. doi: 10.1186/1471-2105-12-220. [DOI] [PMC free article] [PubMed] [Google Scholar]
- Girirajan S, et al. Human copy number variation and complex genetic disease. Annu. Rev. Genet. 2011;45:203–226. doi: 10.1146/annurev-genet-102209-163544. [DOI] [PMC free article] [PubMed] [Google Scholar]
- Grayson BL, Aune TM. A comparison of genomic copy number calls by Partek Genomics Suite, Genotyping Console and Birdsuite algorithms to quantitative PCR. BioData Min. 2011;4:8. doi: 10.1186/1756-0381-4-8. [DOI] [PMC free article] [PubMed] [Google Scholar]
- Hallor KH, et al. Genomic profiling of chondrosarcoma: chromosomal patterns in central and peripheral tumors. Clin. Cancer Res. 2009;15:2685–2694. doi: 10.1158/1078-0432.CCR-08-2330. [DOI] [PubMed] [Google Scholar]
- Hanahan D, Weinberg RA. Hallmarks of cancer: the next generation. Cell. 2011;144:646–674. doi: 10.1016/j.cell.2011.02.013. [DOI] [PubMed] [Google Scholar]
- Hanemaaijer NM, et al. Practical guidelines for interpreting copy number gains detected by high-resolution array in routine diagnostics. Eur. J. Hum. Genet. 2012;20:161–165. doi: 10.1038/ejhg.2011.174. [DOI] [PMC free article] [PubMed] [Google Scholar]
- Hicks J, et al. Novel patterns of genome rearrangement and their association with survival in breast cancer. Genome Res. 2006;16:1465–1479. doi: 10.1101/gr.5460106. [DOI] [PMC free article] [PubMed] [Google Scholar]
- Huang T, et al. Detection of DNA copy number alterations using penalized least squares regression. Bioinformatics. 2005;21:3811–3817. doi: 10.1093/bioinformatics/bti646. [DOI] [PubMed] [Google Scholar]
- Hupe P, et al. Analysis of array CGH data: from signal ratio to gain and loss of DNA regions. Bioinformatics. 2004;20:3413–3422. doi: 10.1093/bioinformatics/bth418. [DOI] [PubMed] [Google Scholar]
- Ivakhno S, et al. CNAseg-a novel framework for identification of copy number changes in cancer from second-generation sequencing data. Bioinformatics. 2010;26:3051–3058. doi: 10.1093/bioinformatics/btq587. [DOI] [PubMed] [Google Scholar]
- Largo C, et al. Multiple myeloma primary cells show a highly rearranged unbalanced genome with amplifications and homozygous deletions irrespective of the presence of immunoglobulin-related chromosome translocations. Haematologica. 2007;92:795–802. doi: 10.3324/haematol.11052. [DOI] [PubMed] [Google Scholar]
- Li A, et al. GPHMM: an integrated hidden Markov model for identification of copy number alteration and loss of heterozygosity in complex tumor samples using whole genome SNP arrays. Nucleic Acids Res. 2011;39:4928–4941. doi: 10.1093/nar/gkr014. [DOI] [PMC free article] [PubMed] [Google Scholar]
- Li C, et al. Major copy proportion analysis of tumor samples using SNP arrays. BMC Bioinformatics. 2008;9:204. doi: 10.1186/1471-2105-9-204. [DOI] [PMC free article] [PubMed] [Google Scholar]
- Li J, et al. CONTRA: copy number analysis for targeted resequencing. Bioinformatics. 2012;28:1307–1313. doi: 10.1093/bioinformatics/bts146. [DOI] [PMC free article] [PubMed] [Google Scholar]
- Lisovich A, et al. A novel SNP analysis method to detect copy number alterations with an unbiased reference signal directly from tumor samples. BMC Med. Genomics. 2011;4:14. doi: 10.1186/1755-8794-4-14. [DOI] [PMC free article] [PubMed] [Google Scholar]
- Magi A, et al. Detecting common copy number variants in high-throughput sequencing data by using JointSLM algorithm. Nucleic Acids Res. 2011;39:e65. doi: 10.1093/nar/gkr068. [DOI] [PMC free article] [PubMed] [Google Scholar]
- Magi A, et al. Read count approach for DNA copy number variants detection. Bioinformatics. 2012;28:470–478. doi: 10.1093/bioinformatics/btr707. [DOI] [PubMed] [Google Scholar]
- Maher CA, Wilson RK. Chromothripsis and human disease: piecing together the shattering process. Cell. 2012;148:29–32. doi: 10.1016/j.cell.2012.01.006. [DOI] [PMC free article] [PubMed] [Google Scholar]
- Maresso K, Broeckel U. Genotyping platforms for mass-throughput genotyping with SNPs, including human genome-wide scans. Adv. Genet. 2008;60:107–139. doi: 10.1016/S0065-2660(07)00405-1. [DOI] [PubMed] [Google Scholar]
- Mc Sherry EA, et al. Formalin-fixed paraffin-embedded clinical tissues show spurious copy number changes in array-CGH profiles. Clin. Genet. 2007;72:441–447. doi: 10.1111/j.1399-0004.2007.00882.x. [DOI] [PubMed] [Google Scholar]
- McCarroll SA, Altshuler DM. Copy-number variation and association studies of human disease. Nat. Genet. 2007;39:S37–S42. doi: 10.1038/ng2080. [DOI] [PubMed] [Google Scholar]
- McCarroll SA, et al. Integrated detection and population-genetic analysis of SNPs and copy number variation. Nat. Genet. 2008;40:1166–1174. doi: 10.1038/ng.238. [DOI] [PubMed] [Google Scholar]
- Olshen AB, et al. Circular binary segmentation for the analysis of array-based DNA copy number data. Biostatistics. 2004;5:557–572. doi: 10.1093/biostatistics/kxh008. [DOI] [PubMed] [Google Scholar]
- Pique-Regi R, et al. R-Gada: a fast and flexible pipeline for copy number analysis in association studies. BMC Bioinformatics. 2010;11:380. doi: 10.1186/1471-2105-11-380. [DOI] [PMC free article] [PubMed] [Google Scholar]
- Sathirapongsasuti JF, et al. Exome sequencing-based copy-number variation and loss of heterozygosity detection: exomeCNV. Bioinformatics. 2011;27:2648–2654. doi: 10.1093/bioinformatics/btr462. [DOI] [PMC free article] [PubMed] [Google Scholar]
- Snijders AM, et al. Assembly of microarrays for genome-wide measurement of DNA copy number. Nat. Genet. 2001;29:263–264. doi: 10.1038/ng754. [DOI] [PubMed] [Google Scholar]
- Stamoulis C, Betensky RA. A novel signal processing approach for the detection of copy number variations in the human genome. Bioinformatics. 2011;27:2338–2345. doi: 10.1093/bioinformatics/btr402. [DOI] [PMC free article] [PubMed] [Google Scholar]
- Teo SM, et al. Statistical challenges associated with detecting copy number variations with next-generation sequencing. Bioinformatics. 2012;28:2711–2718. doi: 10.1093/bioinformatics/bts535. [DOI] [PubMed] [Google Scholar]
- Thompson PA, et al. Selective genomic copy number imbalances and probability of recurrence in early-stage breast cancer. PLos One. 2011;6:e23543. doi: 10.1371/journal.pone.0023543. [DOI] [PMC free article] [PubMed] [Google Scholar]
- Uchida M, et al. Genomic profiling of gastric carcinoma in situ and adenomas by array-based comparative genomic hybridization. J. Path. 2010;221:96–105. doi: 10.1002/path.2686. [DOI] [PubMed] [Google Scholar]
- van de Wiel MA, et al. CGHcall: calling aberrations for array CGH tumor profiles. Bioinformatics. 2007;23:892–894. doi: 10.1093/bioinformatics/btm030. [DOI] [PubMed] [Google Scholar]
- Walter V, et al. DiNAMIC: a method to identify recurrent DNA copy number aberrations in tumors. Bioinformatics. 2011;27:678–685. doi: 10.1093/bioinformatics/btq717. [DOI] [PMC free article] [PubMed] [Google Scholar]
- Wang J, et al. High-throughput single nucleotide polymorphism genotyping using nanofluidic dynamic arrays. BMC Genomics. 2009;10:561. doi: 10.1186/1471-2164-10-561. [DOI] [PMC free article] [PubMed] [Google Scholar]
- Wang K, et al. PennCNV: an integrated hidden Markov model designed for high-resolution copy number variation detection in whole-genome SNP genotyping data. Genome Res. 2007;17:1665–1674. doi: 10.1101/gr.6861907. [DOI] [PMC free article] [PubMed] [Google Scholar]
- Wang Q, et al. Hybridization and amplification rate correction for Affymetrix SNP arrays. BMC Med. Genomics. 2012;5:24. doi: 10.1186/1755-8794-5-24. [DOI] [PMC free article] [PubMed] [Google Scholar]
- Wineinger NE, Tiwari HK. The impact of errors in copy number variation detection algorithms on association results. PLos One. 2012;7:e32396. doi: 10.1371/journal.pone.0032396. [DOI] [PMC free article] [PubMed] [Google Scholar]
- Wu LY, et al. A Bayesian segmentation approach to ascertain copy number variations at the population level. Bioinformatics. 2009;25:1669–1679. doi: 10.1093/bioinformatics/btp270. [DOI] [PubMed] [Google Scholar]
- Xi R, et al. Copy number variation detection in whole-genome sequencing data using the Bayesian information criterion. Proc. Natl Acad. Sci. USA. 2011;108:E1128–E1136. doi: 10.1073/pnas.1110574108. [DOI] [PMC free article] [PubMed] [Google Scholar]
- Yau C, Holmes CC. CNV discovery using SNP genotyping arrays. Cytogenet. Genome Res. 2008;123:307–312. doi: 10.1159/000184722. [DOI] [PubMed] [Google Scholar]
- Zhang D, et al. Accuracy of CNV detection from GWAS data. PLos One. 2011;6:e14511. doi: 10.1371/journal.pone.0014511. [DOI] [PMC free article] [PubMed] [Google Scholar]
Associated Data
This section collects any data citations, data availability statements, or supplementary materials included in this article.


