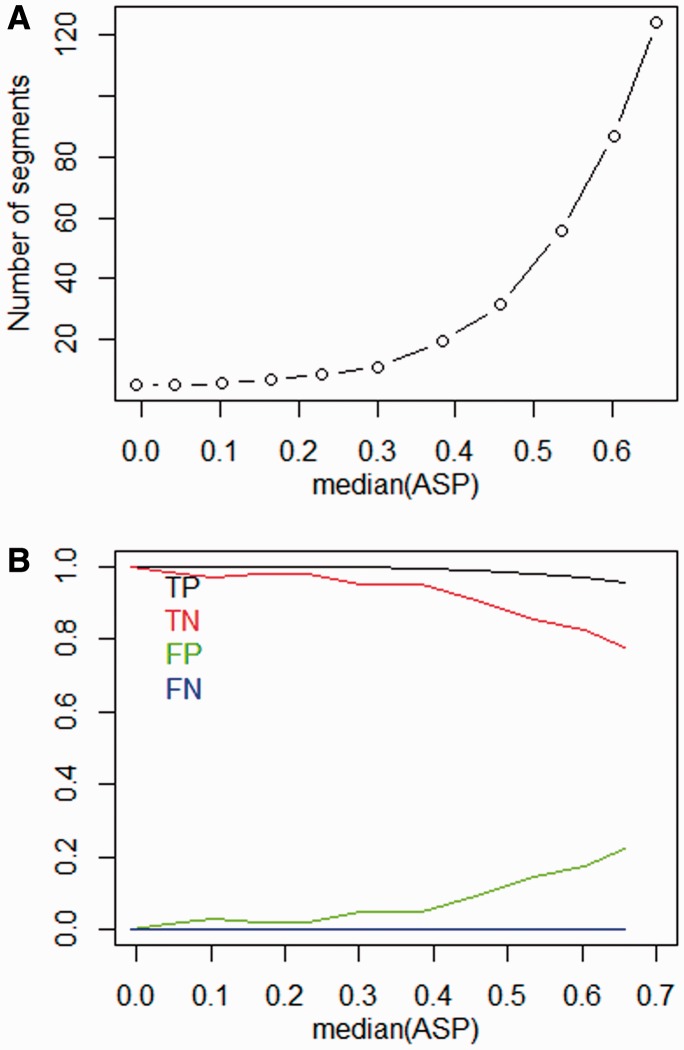
Fig. 3.
Simulation results. (A) Relationship between median of ASP and number of segments according to CBS algorithm. (B) Relationship between median of ASP and FP rate, FN rate, TP rate and TN rate. CNP data are generated using random values with no significant copy number changes. The size of each CNP is 100 000. Autocorrelation is incorporated through coupling the signals of neighboring probes (see Methods)

